
Abstract
Background
Early diagnosis of renal cell carcinoma is extremely significant for the effective treatment of kidney cancer. The development of AS1411 aptamer modified Mn-MoS2 QDs provides a promising fluorescence/magnetic resonance (MR) dual-modal imaging probe for the precise diagnosis of renal clear cell carcinoma.
Methods
In this work, Mn-MoS2 QDs were synthesized through a simple “bottom-up” one-step hydrothermal method. AS1411 aptamer was modified on the Mn-MoS2 QDs to improve the specificity to renal cell carcinoma. The characteristics of Mn-MoS2 QDs were confirmed by transmission electronic microscopy (TEM), atomic force microscope (AFM), X-ray photoelectron spectrometer (XPS), photoluminescence (PL) emission spectra, etc. Cellular fluorescence labelling was investigated using the Mn-MoS2 QDs and AS1411-Mn-MoS2 QDs. The T1-weighted MR imaging was assessed by the in vitro MR cell imaging and in vivo MR imaging. Finally, the long-term toxicity of Mn-MoS2 QDs was investigated by the hematology and histological analysis.
Results
The prepared Mn-MoS2 QDs exhibited excellent aqueous property, intense fluorescence, low toxicity, high quantum yield of 41.45% and high T1 relaxivity of 16.95 mM−1s−1. After conjugated with AS1411 aptamer, the AS1411-Mn-MoS2 QDs could specifically fluorescently label the renal carcinoma cells and present a specific MRI signal enhancement in the tumor region of mice bearing renal carcinoma tumors. Furthermore, Mn-MoS2 QDs revealed low toxicity to the mice via hematology and histological analysis.
Conclusion
These results demonstrated the potential of AS1411-Mn-MoS2 QD as a novel nanoprobe for targeted MR imaging and fluorescence labelling of renal cell carcinoma.
Introduction
Cancer has been a major public concern and a serious threat to health across the world. It is estimated that a total of 18.1 million new cancer cases and 9.6 million cancer deaths will occur worldwide in 2018.Citation1 Kidney cancer accounted for 3.3% among the new cases and the incidence has increased globally in recent years. Specially, renal cell carcinoma is the main type and occupies approximately 90–95% of all kidney neoplasm. Unfortunately, about 30% of the renal cell carcinoma patients showed metastatic disease upon its diagnosis, thus, aggravating the mortality of the renal cell carcinoma patients.Citation2 Therefore, early diagnosis for the cancer is extremely important to greatly increase the chances for effective treatment of renal cell carcinoma.Citation3
Recently, multimodal imaging has attracted tremendous attention as an effective diagnosis strategy for the early detection of cancer.Citation4 The integration of several imaging techniques allows precise and fast diagnosis by acquiring the comprehensive information of the tissues through the signals of the synergistic-multiplexed imaging, including fluorescence imaging, photoacoustic imaging (PA), magnetic resonance imaging (MRI), computed tomography imaging (CT), etc.Citation5–Citation7 Among them, MRI has revealed many advantages in the non-invasive diagnosis by producing high 3D spatially resolved images of the tissues with a deep penetration.Citation5–Citation8 On the other hand, fluorescence imaging (FL) is highly sensitive, thus could be applied for qualitative or quantitative studies of biological behaviors in molecular or cellular levels, which could compensate for the disadvantages of MRI.Citation9 Therefore, the combination of FL and MRI would maximize their advantages and provide an effective approach for the localization of cancer.Citation7,Citation10
Normally, gadolinium (Gd) has been widely used as the contrast agent attributed to the excellent contrast effect in T1-weighted imaging.Citation11 However, as reported, the Gd contained contrast agents may cause a rare but extremely severe disease, nephrogenic fibrosis.Citation12 Therefore, a special contrast agent without Gd is also needed to address this issue. Fortunately, manganese (Mn) element could also produce similar contrast enhancement in T1-weighted imaging ascribed to its five unpaired 3d electrons.Citation13 On the other hand, Mn is also an essential element of physiological metabolism, and its homeostasis can be effectively regulated by the in vivo biological system, enabling its potential application in MRI.Citation14 However, as previous reports, the Mn element in its free form may cause apparent neurotoxicity in the mice and rat study. For example, the aqueous Mn(II) has been found to impart neurotoxicity with an LD50 in mice of 0.3 mmol/kg injected intravenously and 1.0 mmol/kg injected intraperitoneally. Therefore, various approaches were used to tackle the problem associated with free Mn by preparing chelated manganese, hybrid manganese agents, macromolecular agents, and nanoparticle-based agents to mask the free manganese.Citation15
In recent years, quantum dots (QDs) have been studied for their size-dependent optical and electronic properties attributed to the bandgap widening when the dimensions of QDs are reduced below the exciton Bohr radius of the material.Citation16 To date, various quantum dots have been prepared as fluorescent probes, including graphene QDs, semiconductor QDs, carbon dots, polymer dots, etc.Citation16–Citation18 However, most of these QDs exhibited strong cell toxicity and low stability, hindering their applications in the biomedical fields.Citation19 Recently, MoS2 QDs have been identified as a promising QD nanomaterial candidate attributed to its high stability, low toxicity, abundance and unique optical and electronic properties.Citation20 For example, Zhou et al prepared a MoS2 QD for long-term tracking of living cells.Citation21 Lin et al synthesized a MoS2 QD with size-dependent tunable photoluminescence for real-time optical cellular imaging.Citation22 These as-prepared MoS2 QDs were generally developed via a “top-down” route to engineer the size and dimension of bulk MoS2 powder. However, the “top-down” method always required high-powered sonication, long reaction time and hazardous organic solvents.Citation23 Very recently, a “bottom-up” hydrothermal method has attracted great attention for the facile synthesis of MoS2 QDs.Citation24 Typically, MoS2 QDs could be produced via one-step with different sulfur and molybdenum as precursors. For example, Gu et al fabricated water-soluble MoS2 QDs via a one-step hydrothermal method as a fluorescent probe for hyaluronidase detection.Citation24
Recently, metallic atoms were also employed to dope in the 2D MoS2 nanomaterials to improve their properties.Citation25 Tan et al substituted Mn atoms into the MoS2 nanosheet by supercritical hydrothermal reaction to create the intrinsic ferromagnetism.Citation26 Se atoms were doped into the MoS2 nanosheet to enhance the catalytic performance by the increasing number of active sites and enhanced conductivity.Citation27 However, to date, to the best of our knowledge, the Mn-doped MoS2 QDs have not been investigated for MR imaging and cell fluorescence imaging.
Besides, aptamers are short single-stranded DNA or RNA oligonucleotides that can specifically and selectively bind to small molecular ligands or protein targets with high affinity. Moreover, aptamers are highly specific, relatively small in size, non-immunogenic and can be readily stabilized by chemical modifications to enable the expansion of their diagnostic and therapeutic ability.Citation28 Till date, aptamers have been used as therapeutic aptamers for macular degeneration, oncology, diabetes, inflammation and coagulation. Among these aptamers, AS1411, a 26-base guanine-rich oligonucleotide (GRO) with an unmodified (phosphodiester) DNA backbone, is the first aptamer in clinical trials for the treatment of human cancer. The AS1411 aptamer could recognize nucleolin and be internalized in a variety of cancer cells, such as renal, breast and other adenocarcinoma cell lines.Citation29 In this study, the AS1411 aptamer was used to improve the targeting ability of Mn-MoS2 QDs to renal cell carcinoma.
Herein, in this study, we propose a novel Mn-doped MoS2 QDs (Mn-MoS2 QDs) via a “bottom-up” one-step hydrothermal technique for MR imaging and cell fluorescence labelling of renal cell carcinoma. AS1411 aptamer was used to improve the targeting ability of Mn-MoS2 QDs to renal cell carcinoma.Citation30 The composition and structure of Mn-MoS2 QDs were investigated by transmission electronic microscopy (TEM), atomic force microscope (AFM) and X-ray photoelectron spectrometer (XPS). The optical properties were analyzed with the photoluminescence (PL) emission spectra. We investigated the potential of application in cell fluorescence imaging using the Mn-MoS2 QDs. Enhanced contrast effect of imaging was assessed by the in vitro MR cancer cell imaging and in vivo MR imaging with AS1411-Mn-MoS2 QDs incubation. Finally, the long-term toxicity of Mn-MoS2 QDs was investigated by the hematology and histological analysis. Therefore, the AS1411-Mn-MoS2 QDs would be a potential candidate in dual-modal imaging for renal cell carcinoma diagnosis.
Materials and Methods
Materials
Glutathione and manganese nitrate tetrahydrate were purchased from Aladdin Chemical Reagent Co., Ltd. (Shanghai, China). Manganese nitrate tetrahydrate was received from Guoyao Group Chemical Reagents Co., Ltd. (Shanghai, China). Trichloromethane was obtained from Bailingwei Technology Co., Ltd. (Beijing, China). Reagents for cell cultures including fetal bovine serum, trypsin and RPMI1640 were supplied by Gibco. Thermo Fisher Scientific Co., Ltd. (Shanghai, China). DNA oligos were obtained from Shanghai Sangon Biotechnology Co. Ltd. (Shanghai, China). All chemicals involved in this work were analytical-grade. All aqueous solutions were prepared with ultrapure water (≥18 MΩ, Milli-Q, Millipore). The DNA sequence was listed as follows. HS-SH-AS1411: 5ʹ-HS-SH-GGTGGTGGTGGTTGTGGTGGTGGTGG-3ʹ.
Synthesis of Mn-Doped Molybdenum Disulfide Quantum Dots (Mn-MoS2 QDs)
In this study, Mn-MoS2 QDs were synthesized via “bottom-up” one-step hydrothermal method. Briefly, Mn(NO3)2·4H2O (12.5 mg) was dispersed in deionized water (5 mL), followed by the addition of Na2MoO4·2H2O (25 mg) and GSH (634 mg). The mixture was ultrasonicated for 10 mins and then sealed in a poly(tetrafluoroethylene) (Teflon) autoclave. The autoclave was heated to and maintained at 200°C for 36 h, then cooled to the room temperature naturally. Subsequently, the resultant solution was filtered through 0.22 μm microporous membrane and dialyzed against water in a dialysis bag to remove the unreacted raw materials. The AS1411 aptamer conjugation was realized by adding HS-SH-AS1411 (20 μL, 250 μmol/L) dropwise in Mn-MoS2 QDs, then reacted in 37°C water bath for 2 hrs. Finally, the Mn-MoS2 QDs and AS1411-Mn-MoS2 QDs were obtained and stored under 4°C for further use.
Characterization of Mn-MoS2 QDs
The size, morphology and composition of Mn-MoS2 QDs and AS1411-Mn-MoS2 QDs were analyzed with a dynamic light scattering (DLS) analyzer (Zetasizer Nano ZS90, England), an atomic force microscope (AFM, SP13800, Japan) and a high-resolution transmission electron microscopic (HR-TEM, JEOL JEM200CX, Japan) with energy dispersive X-ray function (EDS). X-ray photoelectron spectrometry (XPS) spectra were obtained from X-ray photoelectron spectrometer (XPS, Thermo escalab250Xi, USA). The content of Mn in Mn-MoS2 QDs was assessed by an inductively coupled plasma mass spectrometry (ICP-MS, Optima 5300DV, PerkinElmer, USA). The UV-vis absorption spectra and PL emission of Mn-MoS2 QDs were measured by a UV-vis NIR spectrometer (UH4150 HITACH) and LS55 Fluorescence Spectrometer (PerkinElmer, America), respectively. The absorbance for MTT assay was determined by a microplate reader (Multiskon MK3, USA) at 490 nm.
In vitro Cell Cytotoxicity
Cell Culture
786-O renal carcinoma cells, MDA-MB-231 breast cancer cell, HO-8910 ovarian cancer stem cells, HK-2 renal tubular epithelial cells and EA.hy926 human umbilical vein endothelial cells were purchased from the Cell Bank of the Chinese Academy of Sciences (Shanghai, China). The aforementioned cell lines were maintained in RPMI medium containing 10% (v/v) FBS and penicillin–streptomycin (100 μg/mL) and incubated at 37°C in a humidified 5% CO2 atmosphere.
Cell Cytotoxicity Test
Cell cytotoxicity of Mn-MoS2 QDs was determined via MTT method.Citation31 Briefly, the above-mentioned cells were seeded in 96-well plates for 24 hrs for cell attachment. Subsequently, Mn-MoS2 QDs at various concentrations were added in each cell and co-incubated for another 24 hrs. Then, 10 μL MTT solution (5mg/mL) was added to each well with further incubation for 4 hrs. Afterwards, the MTT solution was removed and replaced with 100 μL DMSO to dissolve the formazan crystals. Finally, the absorbance was detected at 490 nm using a BioTek Epoch microplate reader (Multiskon MK3, USA).
Bioimaging and Cell Labelling
The 786-O and EA.hy926 cells were used to assess the ability of Mn-MoS2 QDs as fluorescence cell labelling agent. Cells were seeded on sterile coverslips in a 6-well plate overnight for cell attachment. Then, the cells were incubated with Mn-MoS2 QDs (2 mM) or AS1411-Mn-MoS2 QDs (2 mM) for 2 hrs for cellular labelling. Subsequently, the cells were washed three times with PBS. Finally, the samples were observed using a fluorescence microscopy.
T1 Relaxivity of Mn-MoS2 QDs
The T1-weighted MRI contrast measurement of Mn-MoS2 QDs was conducted on a 3.0T Discovery 750W MR system. Mn-MoS2 QDs were analyzed over various Mn concentrations of 0.345, 0.689, 1.379, 2.758, 5.516, 11.03 and 22.06 mM. The T1-weighted MR images of these samples were obtained with Spin-Echo sequence under the following parameters: TR= 425ms, TE=Min Full, matrix size =384×224, field of view=18 cm×18 cm, slice thickness=3.0 mm, spacing= 1.5 mm.
In vitro Enhanced MR Imaging
To assess the MR cellular imaging ability of Mn-MoS2 QDs and AS1411-Mn-MoS2 QDs, 786-O and EA.hy926 cells were inoculated on 6-well plates overnight at a density of 2×10⁵ cells/well. Subsequently, the cells were co-incubated with Mn-MoS2 QDs or AS1411-Mn-MoS2 QDs at a concentration of 2 mM for 2 hrs to allow cellular uptake. Thereafter, the cells were washed thrice with cold PBS and trypsinized with EDTA-trypsin, then were resuspended in 300 μL 1% agarose gel. Finally, the MR imaging was conducted on the previous MR system.
In vivo MR Imaging
For in vivo MRI, the tests were investigated on 786-O bearing BALB/c nude mice (male, 5 weeks old) and approved by the Animal Care Committee of Xuzhou Medical University, and were performed in accordance with the committee’s guidelines. To develop the 786-O bearing mice, cells (2×10⁶) suspended in serum-free cell medium were subcutaneously injected on the back of each nude mouse. When the tumor volume reached about 1 cm3, the mice were injected with Mn-MoS2 QDs or AS1411-Mn-MoS2 QDs (200 μL 2mM Mn) for in vivo imaging. The MRI studies were performed on the previous MR system pre- and post-injection (0.25, 0.5, 0.75, 1, 2, 3, 4, 6, 12 hrs).
In vivo Toxicity Analysis
In vivo toxicity test was performed on the healthy Kunming mice (female, 8 weeks). The animals were randomly divided into two groups: Control and AS1411-Mn-MoS2 QDs (200 μL 2mM Mn), each group containing six mice. The blood samples were collected on days 1, 7 and 21 for blood serum analysis. Then, the blood samples were centrifuged at 3000 rpm for 5 mins to obtain the serum for biochemistry analysis.Citation32 Simultaneously, the mice were sacrificed to harvest the major organs (heart, liver, spleen, kidney and lung). Afterwards, the organs were fixed with 10% formalin, sectioned and stained with hematoxylin and eosin (H&E). Finally, the histological samples were examined under an optical microscope.
Statistical Analysis
SPSS 16.0 software (Chicago, IL) was used for statistical analysis. One-way ANOVA and Dunnett t-tests were used to compare the statistical significance between different groups. Quantitative data are presented as mean ± SD, p<0.05 was considered significant in all cases.
Results and Discussion
Synthesis and Characterization of Mn-MoS2 QDs
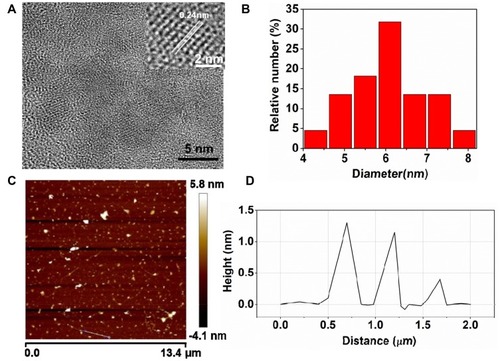
In this study, Mn-MoS2 QDs were synthesized via “bottom-up” one-step hydrothermal method using manganese nitrate tetrahydrate, sodium molybdate, and glutathione as manganese, molybdenum and sulfur sources, respectively. As shown in , a typical spherical morphology was observed in the TEM image of Mn-MoS2 QDs. Mn-MoS2 QDs exhibited excellent crystal structure with noticeable lattice fringes (spacing=0.24 nm) showed in the high-resolved TEM images (inset in ). The spacing was consistent with the typical lattice of the MoS2 QDs, indicating that the doping of Mn induced no obvious change to the crystal structure of MoS2 QDs.Citation21,Citation22,Citation24 Moreover, the Mn-MoS2 QDs were well dispersed with a narrow size distribution and an average diameter of approximately 6.07 nm (). The content of Mn in Mn-MoS2 QDs was further assessed by ICP-MS, and was calculated to be 9.5 (wt %), which is sufficient for the T1-weighted MR imaging. Furthermore, AFM was conducted to investigate the thickness and morphology of Mn-MoS2 QDs. As shown in the AFM image (), the thickness ranged from 0.6 to 1.2 nm, indicating the monolayer or bilayer structure of the as-prepared Mn-MoS2 QDs.Citation24
Figure 1 Characterizations of Mn-MoS2 QDs: (A) TEM images of Mn-MoS2 QDs (inset, high-resolution TEM images), (B) size distributions of Mn-MoS2 QDs, (C) AFM image of Mn-MoS2 QDs, and (D) size and height distributions of the MoS2 QDs.
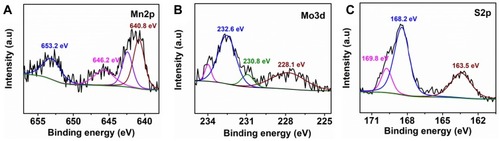
The XPS analysis was also conducted to evaluate the chemical structure of Mn-MoS2 QDs. As shown in high-resolution Mo 3d spectrum in , two typical peaks were observed at 228.1 eV and 232.6 eV, which corresponded to the Mo 3d3/2 and Mo 3d5/2, respectively, indicating that the Mo element existed as 4+ oxidation state in Mn-MoS2 QDs. The peaks at 163.4 eV and 169.7 eV belong to the S 2p3/2 and S 2p1/2 orbitals of divalent sulfide ions (). Furthermore, two characteristic peaks were observed at 640.8 eV and 642.4 eV, which correspond to the spin-orbit coupled Mn 2p3/2, suggesting that the valence state of Mn-MoS2 QDs was divalent and tetravalent (). These results demonstrated the successful synthesis of Mn-MoS2 QDs.
Figure 2 XPS spectra of the Mn-MoS2 QDs: (A) Mn2p, (B) Mo3d, and (C) S2p.
Optical Features of Mn-MoS2 QDs
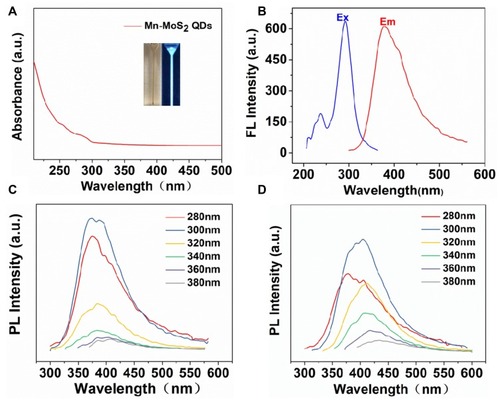
The optical property of the Mn-MoS2 QDs was characterized by ultraviolet-visible spectroscopy (UV-vis). As shown in , the UV-vis spectra of Mn-MoS2 QDs showed a shoulder peak located at 290 nm attributed to the blue-shifted excitonic peaks. Typically, the excitonic peaks always blue shift with the formation of MoS2 QDs. The UV-vis spectra result further confirmed the successful formation of Mn-MoS2 QDs. The fluorescence spectra of the Mn-MoS2 QDs were measured at various excitation wavelengths from 260 to 380 nm and shown in . The excitation at 290 nm induced a strong luminescence band with a maximum at 380 nm (). And the emission peak red-shifted from 380 to 435 nm within the excitation wavelength ranging from 260 to 380 nm. The excitation-dependent emission is consistent with the previous studies. The Mn-MoS2 QDs aqueous were observed as pale pink under natural light, but revealed vivid blue luminescence under the UV light excitation ( inset). Furthermore, the quantum yield (QY) of Mn-MoS2 QDs was assessed by comparing with the quinine sulfate standard, and was calculated to be 41.45% (Figure S1). The QY value was much higher than that of MoS2 nanosheets and other quantum dots. The excellent luminescence and high QY of the Mn-MoS2 QDs enabled their potential application in cell labelling.
Figure 3 Optical properties of Mn-MoS2 QDs: (A) UV–vis absorption spectra of Mn-MoS2 QDs, (B) PL emission and excitation of the Mn-MoS2 QDS, (C) fluorescence emission spectra of the Mn-MoS2 QDs at different excitation wavelengths, and (D) fluorescence emission spectra of the Mn-MoS2 QDs at different excitation wavelengths.
T1 Relaxivity
To evaluate the possibility of using Mn-MoS2 QDs as MRI contrast agents, the T1 relaxation times of the QDs at various Mn concentrations were measured with a 3.0T MR system. The T1 relaxation time decrease with the increase of the amounts of Mn-MoS2 QDs. As shown in , Mn-MoS2 QDs clearly exhibited bright signal enhancement in the T1-weighted MR imaging. Furthermore, the bright signal enhancement indicated a concentration-dependent relation with the prepared Mn-MoS2 QDs, thus manifesting their potential application as a T1-weighted contrast agent (). The longitudinal relaxation rate (1/T1), also known as relaxivity r1, was calculated to be 16.95 mM−1s−1, which was 4-fold of the commercial product Gd-DTPA (4.21 mM−1s−1, Figure S2). The high r1 relaxivity value of Mn-MoS2 QDs might be mainly ascribed to high concentration of metal ions exposed on the surface of nanoparticles which favored the longitudinal relaxation of the water proton to present a better contrast effect. Furthermore, as shown in Figure S3, AS1411 conjugation did not induce significant change on the MRI contrast effect of Mn-MoS2 QDs. These results indicated that the prepared Mn-MoS2 QDs could be a potential contrast agent for MR imaging to enhance the relaxivity of the commercial Gd-DTPA.
In vitro Cytotoxicity of Mn-MoS2 QDs
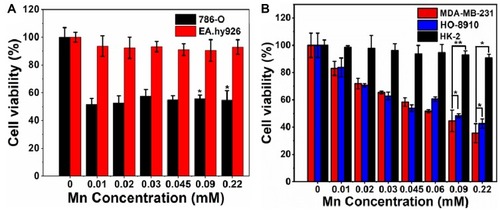
Although the prepared Mn-MoS2 QDs exhibited excellent MR contrast and PL property in aqueous solution, it is of great significance to ensure good biocompatibility of the QDs to be applied in cell labelling and tracking in the biological system. At first, the cytotoxicity of Mn-MoS2 QDs at various concentrations was assessed against 786-O renal carcinoma and EA.hy926 normal umbilical vein endothelial cells. As shown in , the viability of EA.hy926 normal umbilical vein endothelial cells remained above 85% flowing with the incubation of Mn-MoS2 QDs even at a high concentration of 0.22 mM. In contrast, the Mn-MoS2 QDs indicated obvious toxicity to the 786-O cancer cells under the same situation. To further investigate the different appearance between normal and cancer cells, Mn-MoS2 QDs were co-incubated with MDA-MB-231 breast cancer, HO-8910 ovarian cancer and HK-2 renal tubular cells. As indicated in , similarly, Mn-MoS2 QDs revealed low toxicity to HK-2 normal cells and concentration-dependent cytotoxicity to the MDA-MB-231 breast cancer and HO-8910 ovarian cancer cells. Normally, the tumor microenvironment and lysosome exhibited mildly acidic and H2O2-rich property compared with the normal tissues. As reported, the Mn contained QDs indicated noticeable anticancer effect by the production of oxygen with H2O2 triggered by Mn contained QDs.Citation33 Therefore, in this study, the cancer cytotoxicity associated with Mn-MoS2 QDs may also be attributed to the generation of singlet oxygen from H2O2 decomposition in the tumor microenvironment and lysosome. These results demonstrated that Mn-MoS2 QDs represented wonderful biocompatibility to the normal cells and killing-effect to various cancer cells.
Figure 4 In vitro cytotoxicity test of Mn-MoS2 QDs against (A) 786-O and EA.hy926 cells, *p < 0.05 was compared to EA.hy926 cell of the same treated concentrations and (B) MDA-MB-231, HO-8910 and HK-2 cells, *p < 0.05 and **p < 0.01.
In vitro Cell Labelling
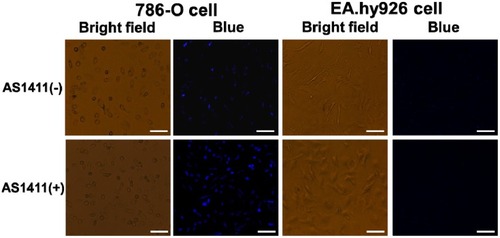
Encouraged by the excellent PL property of the as-prepared Mn-MoS2 QDs, we moved to investigate the cell labelling ability of QDs on 786-O and EA.hy926 cells. AS1411 aptamer was used to conjugate on the Mn-MoS2 QDs to improve the affinity of the QDs to the 786-O cells. As shown in , no obvious fluorescence was observed in EA.hy926 cells under the incubation with Mn-MoS2 QDs and AS-1411-Mn-MoS2 QDs. In comparison, the 786-O cells displayed weak blue fluorescence after the staining with Mn-MoS2 QDs. However, after the AS1411 conjugation, the blue fluorescence was significantly improved in the 786-O cells after staining. It indicated that the AS1411 aptamer could improve the binding of Mn-MoS2 QDs with 786-O cells. Cell surface nucleolin is selectively expressed in cancer cells compared to normal cells, and that it mediates the binding and uptake of AS1411 in cancer cells.Citation34 The 786-O renal carcinoma cells also reported high expression of nucleolin on the outer surface of cell membrane.Citation35 Therefore, the AS1411 aptamer modified Mn-MoS2 QDs could specifically bind to nucleolin on the surface of 786-O renal carcinoma cells and taken up by the cells through the macropinocytosis process. It demonstrated that the AS1411-Mn-MoS2 QDs could serve as promising and specific fluorescent probe for the labelling of 786-O renal carcinoma cells.
In vitro Specific MR Imaging
The specific cellular targeting of the QDs was further investigated by the T1-weighted MR imaging of 786-O and EA.hy926 cells. The cells were co-incubated with PBS buffer, Mn-MoS2 QDs and AS1411-Mn-MoS2 QDs, respectively. As shown in the T1-weighted MR images and T1-mapping images (), the Mn-MoS2 QDs did not induce obvious MR enhancement to the EA.hy926 cells compared with the PBS treated group. In addition, AS1411 conjugation did not lead to significant effect on the MRI behavior ascribed to the low expression of nucleolin on the normal cells (). However, the 786-O cells exhibited brighter signal after the incubation of Mn-MoS2 QDs compared with the EA.hy926 cells, indicating the higher cellular uptake of Mn-MoS2 QDs by cancer cells. Furthermore, the T1 signal was significantly enhanced for 786-O cells in the presence of AS1411 aptamer. It demonstrated that the AS1411 aptamer could facilitate the QDs to bind with the nucleolin on the surface of cancer cells to result in a higher T1 signal. These results demonstrated that the 786-O cancer cells could be specifically marked by the AS1411-Mn-MoS2 QDs with fluorescence/MR dual-modal imaging mode.
Figure 5 MR contrast ability of Mn-MoS2 QDs: (A) linear relationship between longitudinal relaxation rate of Mn-MoS2 QDs and Gd-DTPA at different concentrations, (B) T1-weighted phantom images of Mn-MoS2 QDs at different Mn concentrations using a 3.0T MR scanner, (C) T1-weighted 786-O and EA.hy926 cellular MR imaging with Mn-MoS2 QDs and AS1411-Mn-MoS2 QDs.
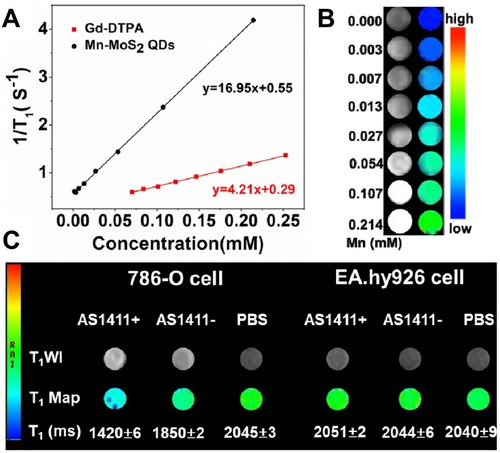
Figure 6 Fluorescence imaging of 786-O cells and EA.hy926 cells labeled with Mn-MoS2 QDs and AS1411-Mn-MoS2 QDs, scale bar = 50μm.
In vivo MRI
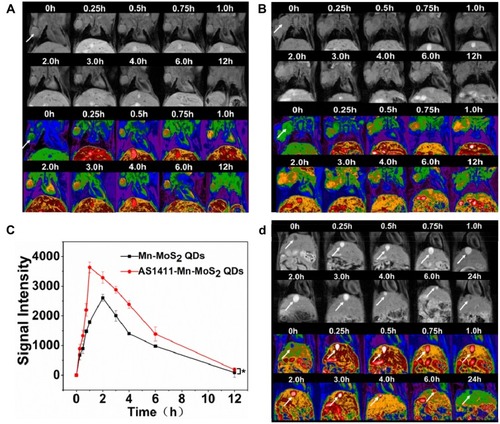
The potential of A1411-Mn-MoS2 QDs as a MRI contrast agent for in vivo cancer imaging was investigated using BALB/c nude mice with 786-O renal carcinoma. T1-weighted MRI scans were conducted prior to, and at various time points post-injection of Mn-MoS2 QDs and AS1411-Mn-MoS2 QDs. As shown in , compared with the pre-injected mice, the tumor exhibited contrast-enhanced regions 15-min post-injection following the accumulation of Mn-MoS2 QDs and AS1411-Mn-MoS2 QDs. The T1 MR signal gradually became brighter within 1–2 hrs, then turned weaker following the time. Particularly, the AS1411-Mn-MoS2 QDs showed much brighter signal in T1-weighted images at the same time point in the tumor regions compared with the Mn-MoS2 QDs, indicating that the AS1411 aptamer could improve the accumulation of Mn-MoS2 QDs in the tumor tissues, thus enhancing the MR contrast effect. The measured MR intensity values of the tumors were presented in . The MR signal intensity values of AS1411-Mn-MoS2 QDs were higher than the counterparts in all time points, which was consistent with the T1-mapping MR images. It further demonstrated the targeting ability of the QDs to the tumor benefit from the AS1411 aptamer. In addition, as shown in , high MR signal was also observed within 6 hrs post-injection in the gall bladder and liver. However, the signal in the liver and bladder became weaker, indicating that the clearance of the QDs was mainly completed by hepatobiliary system. Overall, the in vivo MRI suggested the potential applications of AS1411-Mn-MoS2 QDs for renal carcinoma diagnosis.
Figure 7 T1-weighted in vivo MR imaging of mice pre- and post-injection of (A) Mn-MoS2 QDs and (B) AS1411-Mn-MoS2 QDs nanoprobe at different time points, the white arrows indicate tumor, *p < 0.05. (C) Signal intensity in the tumors, (D) T1-weighted MR images of mice pre- and post-injection of Mn-MoS2 QDs. The white arrows indicate gall bladder.
In vivo Cytotoxicity of Mn-MoS2 QDs
In vivo cytotoxicity studies of the Mn-MoS2 QDs were investigated on the healthy Kunming mice for 21 days. The Mn-MoS2 QDs were suspended in PBS and injected in the mice via tail vein with the saline injected mice as control. Blood was collected after 1, 7, 21 days administration and investigated with complete blood count and serum biochemistry analysis. For the hematology study, we selected several important indicators as white blood cells (WBC), red blood cells (RBC), hematocrit (HCT), mean corpuscular volume (MCV), mean corpuscular hemoglobin (MCH) and mean corpuscular hemoglobin concentration (MCHC). As shown in , the hematological factors did not exhibit obvious difference between the control and Mn-MoS2 QDs injected groups. Only the WBC and RBC values showed slight decrease in the Mn-MoS2 QDs injected mice compared with the control. However, all the hematological values including WBC still maintained within the normal range, indicating no acute toxicity. Serum biochemistry analysis was also performed to assess the potential toxicity of the Mn-MoS2 QDs on mice.Citation33 As shown in , the blood urea nitrogen (BUN) maintained normal level, indicating the good condition of the kidney. Otherwise, the damage to the renal function may induce the increase of urea nitrogen in the blood. Furthermore, the hepatic function markers – albumin (ALB), alanine aminotransferase (ALT), aspartate aminotransferase (AST) and total protein (TP) revealed a slight discrepancy in 1 day, but returned to the normal level in 7 and 21 days. However, all the hepatic indicators maintained within the normal ranges, demonstrating that Mn-MoS2 QDs may affect the hepatic function in the short time after administration but without liver injury in a long term.
Figure 8 In vivo toxicity test of Mn-MoS2 QDs: (Aa–l) Mouse serum biochemistry analysis and blood routine analysis before (0d, control) and after injection of Mn-MoS2 QDs for 1, 7, 21d. (B) Histological images of the heart, lungs, liver, spleen and kidneys of mice 1, 7 and 21 days post-intravenous injection of Mn-MoS2 QDs and in control mice. The organs were sectioned and stained with hematoxylin and eosin (H&E) and observed under a light microscope, scale bar = 100 μm.
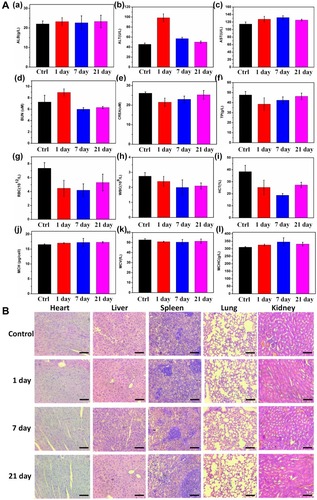
Histological analysis for the major organs (heart, liver spleen, lung, kidney) was also performed to identify the effect of Mn-MoS2 QDs to various tissues. As shown in , there was no obvious inflammation or damage lesions observed in major organs after 21-day injection of Mn-MoS2 QDs. The H&E images exhibited similar morphology in the different organs compared with the control groups. These results suggested the low toxicity of the Mn-MoS2 QDs in the animal body, unlocking their potential in biomedical applications.
Conclusions
A novel AS1411-Mn-MoS2 nanoprobe was successfully synthesized via bottom-up one-step hydrothermal technique for targeted MR and fluorescence imaging of renal clear cell carcinoma. The as-prepared AS1411-Mn-MoS2 QDs exhibited excellent aqueous property, intense luminescence, low toxicity and high quantum yield. Owing to the strong absorption and emission in the visible region, AS1411-Mn-MoS2 QDs were successfully applied in cell labelling for renal cell carcinoma. Besides, AS1411-Mn-MoS2 QDs also revealed wonderful targeted MR contrast behavior for the renal carcinoma in the in vitro and in vivo MR tests compared with the clinical Gd-DTPA. Therefore, the experimental results demonstrate that the AS1411-Mn-MoS2 QDs could be used as a nanoprobe for the specific recognization of renal clear cell carcinoma.
Disclosure
There are no conflicts of interest.
Acknowledgment
This work was supported by the National Natural Science Foundation of China (81771904, 81901798), Natural Science Foundation of Jiangsu Province for the Excellent Young Scholars (BK20170054), Natural Science Fund for Colleges and Universities in Jiangsu Province (19KJB310025), Startup Fund for Youth Talent in Xuzhou Medical University (D2019028), China Postdoctoral Science Foundation (2016M601890, 177607), Qing Lan Project, the Peak of Six Talents of Jiangsu Province (WSN-112), Jiangsu Provincial Medical Youth Talent (QNRC2016776), Six One Project of Jiangsu Province (LGY2018083), and the Science and Technology Development Program of Xuzhou (KC19141).
References
- Bray F, Ferlay J, Soerjomataram I, Siegel RL, Torre LA, Jemal A. Global cancer statistics 2018: GLOBOCAN estimates of incidence and mortality worldwide for 36 cancers in 185 countries. CA Cancer J Clin. 2018;68(6):394–424. doi:10.3322/caac.2149230207593
- Wong MCS, Goggins WB, Yip BHK, et al. Incidence and mortality of kidney cancer: temporal patterns and global trends in 39 countries. Sci Rep. 2017;7:15698. doi:10.1038/s41598-017-15922-429146923
- Hsieh JJ, Purdue MP, Signoretti S, et al. Renal cell carcinoma. Nature Rev Dis Primers. 2017;9(3):17009. doi:10.1038/nrdp.2017.9
- Lee DE, Koo H, Sun IC, Ryu JH, Kim K, Kwon IC. Multifunctional nanoparticles for multimodal imaging and theragnosis. Chem Soc Rev. 2012;41:2656–2672. doi:10.1039/C2CS15261D22189429
- Evertsson M, Kjillman P, Cinthio M, et al. Combined magnetomotive ultrasound, PET/CT and MR imaging of 68Ga-labelled superparamagnetic iron oxide nanoparticles in rat sentinel lymph nodes in vivo. Sci Rep. 2017;7:4824. doi:10.1038/s41598-017-04396-z28684867
- Yang W, Guo W, Le W, et al. Albumin-bioinspired Gd: CuS nanotheranostic agent for in vivo photoacoustic/magnetic resonance imaging-guided tumor-targeted photothermal therapy. ACS Nano. 2016;10:1024510257. doi:10.1021/acsnano.6b05760
- Zhou R, Sun S, Li C, Wu L, Hou X, Wu P. Enriching Mn-doped ZnSe quantum dots onto mesoporous silica nanoparticles for enhanced fluorescence/magnetic resonance imaging dual-modal bio-imaging. ACS Appl Mater Interfaces. 2018;10:34060–34067. doi:10.1021/acsami.8b1455430211537
- Hart AG, Bowtell RW, Kockenberger W, Wensellers T, Ratnieks FL. Magnetic resonance imaging in entomology: a critical review. J Insect Sci. 2003;3:5. doi:10.1673/031.003.050115841222
- David K, Hildebrandt N. Quantum dots: bright and versatile in vitro and in vivo fluorescence imaging probes. Chem Soc Rev. 2015;44:4792–4834.25777768
- Yao YY, Gedda G, Girma WM, Yen CL, Ling YC, Chang JY. Magnetofluorescent carbon dots derived from crab shell for targeted dual-modality bioimaging and drug delivery. ACS Appl Mater Interfaces. 2017;9:13887–13899. doi:10.1021/acsami.7b0159928388048
- Liu Y, Zhang N. Gadolinium loaded nanoparticles in theranostic magnetic resonance imaging. Biomaterials. 2012;33(21):5363–5375. doi:10.1016/j.biomaterials.2012.03.08422521487
- Semelka RC, Ramalho M, Alobaidy M, Ramalho J. Gadolinium in humans: a family of disorders. Am J Roentgenol. 2016;207(2):229–233. doi:10.2214/AJR.15.1584227224028
- Pan D, Caruthers SD, Senpan A, Schmieder AH, Wickline SA, Lanza GM. Revisiting an old friend: manganese-based MRI contrast agents. Wires Nanomed Nanobiotechnol. 2011;3:162–173. doi:10.1002/wnan.116
- Aggett PJ. 1 Physiology and metabolism of essential trace elements: an outline. Clin Endocrinol Metab. 1985;14(3):513–543. doi:10.1016/S0300-595X(85)80005-0
- Pan D, Schmieder AH, Wickline SA, Lanza GM. Manganese-based MRI contrast agents: past, present and future. Tetrahedron. 2011;67:8431–8444. doi:10.1016/j.tet.2011.07.07622043109
- Michslet X, Pinaud FF, Bentolila LA, et al. Quantum dots for live cells, in vivo imaging, and diagnostics. Science. 2005;307(5709):538–544. doi:10.1126/science.110427415681376
- Roy P, Periasamy AP, Lin CY, et al. Photoluminescent graphene quantum dots for in vivo imaging of apoptotic cells. Nanoscale. 2015;7:2504–2510. doi:10.1039/C4NR07005D25569453
- Zheng S, Yu N, Han C, et al. Preparation of gadolinium doped carbon dots for enhanced MR imaging and cell fluorescence labelling. Biochem Biophys Res Commun. 2019;511(2):207–213. doi:10.1016/j.bbrc.2019.01.09830777335
- Frasco MF, Chaniotakis N. Semiconductor quantum dots in chemical sensors and biosensors. Sensors. 2009;9(9):7266–7286. doi:10.3390/s9090726622423206
- Barua S, Dutta HS, Gogoi S, Devi R, Khan R. Nanostructured MoS2-based advanced biosensors: a review. ACS Appl Nano Mater. 2018;1(1):2–25. doi:10.1021/acsanm.7b00157
- Zhou K, Zhang Y, Xia Z, Wei W. As-prepared MoS2 quantum dot as a facile fluorescent probe for long-term tracing of live cells. Nanotechnology. 2016;27:275101. doi:10.1088/0957-4484/27/27/27510127242334
- Lin H, Wang C, Wu J, Xu Z, Huang Y, Zhang C. Colloidal synthesis of MoS2 quantum dots: size-dependent tunable photoluminescence and bioimaging. N J Chem. 2015;39:8492–8497. doi:10.1039/C5NJ01698C
- Wang Y, Ni Y. Molybdenum disulfide quantum dots as a photoluminescence sensing platform for 2,4,6-trinitrophenol detection. Anal Chem. 2014;86(15):7463–7470. doi:10.1021/ac501201425001878
- Gu W, Yan Y, Zhang C, Ding C, Xian Y. One-step synthesis of water-soluble MoS2 quantum dots via a hydrothermal method as a fluorescent probe for hyaluronidase detection. ACS Appl Mater Interfaces. 2016;8:11272−11279. doi:10.1021/acsami.6b0116627082278
- Yue Q, Chang S, Qin S, Li J. Functionalization of monolayer MoS2 by substitutional doping: a first-principles study. Phys Letters A. 2013;377:1362–1367. doi:10.1016/j.physleta.2013.03.034
- Tan H, Hu W, Wang C, et al. Intrinsic ferromagnetism in Mn-substituted MoS2 nanosheets achieved by supercritical hydrothermal reaction. Small. 2017;13:1701389. doi:10.1002/smll.v13.39
- Ren X, Ma Q, Fan H, et al. A Se-doped MoS2 nanosheet for improved hydrogen evolution reaction. Chem Commun. 2015;51:15997. doi:10.1039/C5CC06847A
- Kaur H, Bruno JG, Kumar A, Sharma TK. Aptamers in the therapeutics and diagnostics pipelines. Theranostics. 2018;8(15):4016, 4032. doi:10.7150/thno.2595830128033
- Chopra A, Shukla R, Sharma TK. Aptamers as an emerging player in biology. Aptamers Synth Antibodies. 2014;1(1):1–11.
- Li JJ, Wang S, Wu C, et al. Activatable molecular MRI nanoprobe for tumor cell imaging based on gadolinium oxide and iron oxide nanoparticle. Biosens Bioelectron. 2016;86:1047–1053. doi:10.1016/j.bios.2016.07.04427501342
- Zheng S, Han J, Jin Z, et al. Dual tumor-targeted multifunctional magnetic hyaluronic acid micelles for enhanced MR imaging and combined photothermal-therapy. Colloids Surf. 2018;164:424–435. doi:10.1016/j.colsurfb.2018.02.005
- Hao J, Song G, Liu T, Yang K, Cheng L, Liu Z. In vivo long-term biodistribution, excretion, and toxicology of PEGylated transition-metal dichalcogenides MS2 (M = Mo, W, Ti) nanosheets. Adv Sci. 2017;4:1600160. doi:10.1002/advs.201600160
- Jia Q, Ge J, Liu W, et al. A Magnetofluorescent carbon dot assembly as an acidic H2O2-driven oxygenerator to regulate tumor hypoxia for simultaneous bimodal imaging and enhanced photodynamic therapy. Adv Mater. 2018;1706090. doi:10.1002/adma.201706090
- Bates PJ, Laber DA, Miller DM, Thomas SD, Trent JO. Discovery and development of the G-rich oligonucleotide AS1411 as a novel treatment for cancer. Exp Mol Pathol. 2009;86:151–164. doi:10.1016/j.yexmp.2009.01.00419454272
- Dai Y, Zhang A, You J, Li J, Xu H, Xu K. Fabrication of AS1411 aptamer functionalized Gd2O3-based molecular magnetic resonance imaging (mMRI) nanoprobe for renal carcinoma cell imaging. RSC Adv. 2015;5:77204–77210. doi:10.1039/C5RA17211J