 ?Mathematical formulae have been encoded as MathML and are displayed in this HTML version using MathJax in order to improve their display. Uncheck the box to turn MathJax off. This feature requires Javascript. Click on a formula to zoom.
Abstract
A nanoparticle delivery system termed dynamic magnetic shift (DMS) has the potential to more effectively treat metastatic cancer by equilibrating therapeutic magnetic nanoparticles throughout tumors. To evaluate the feasibility of DMS, histological liver sections from autopsy cases of women who died from breast neoplasms were studied to measure vessel number, size, and spatial distribution in both metastatic tumors and normal tissue. Consistent with prior studies, normal tissue had a higher vascular density with a vessel-to-nuclei ratio of 0.48 ± 0.14 (n = 1000), whereas tumor tissue had a ratio of 0.13 ± 0.07 (n = 1000). For tumors, distances from cells to their nearest blood vessel were larger (average 43.8 μm, maximum 287 μm, n ≈ 5500) than normal cells (average 5.3 μm, maximum 67.8 μm, n ≈ 5500), implying that systemically delivered nanoparticles diffusing from vessels into surrounding tissue would preferentially dose healthy instead of cancerous cells. Numerical simulations of magnetically driven particle transport based on the autopsy data indicate that DMS would correct the problem by increasing nanoparticle levels in hypovascular regions of metastases to that of normal tissue, elevating the time-averaged concentration delivered to the tumor for magnetic actuation versus diffusion alone by 1.86-fold, and increasing the maximum concentration over time by 1.89-fold. Thus, DMS may prove useful in facilitating therapeutic nanoparticles to reach poorly vascularized regions of metastatic tumors that are not accessed by diffusion alone.
Introduction
Breast cancer is the second leading cause of death in American women.Citation1 The most important factor that determines survival in these patients is tumor stage, but more specifically the presence of metastases. The 5-year relative survival rate declines from 98% in cases with localized primary lesions to 23% in cases with distant stage with metastasis in organs.Citation1 Treatment of breast cancer includes local strategies such as surgery and radiation, as well as the systemic use of chemotherapeutic agents. However, successful treatment of metastases is a daunting undertaking due to the numerous challenges involved.Citation2 Identification of efficacious antitumor agents, tumor heterogeneity, evolving drug resistance, and host toxicity are among the difficulties involved in developing therapies that reduce morbidity and mortality in patients with advanced disease.
The three-dimensional tumor microenvironment introduces an additional level of complexity, as the rapid and uncontrolled growth of tumor cells can result in a disorganized and only partially functional biological milieu, an environment that favors tumor growth over normal physiological processes. One outcome of this process is an abnormal vascular system.Citation3 Unlike the well-structured series of small vessels that create a fine meshwork of capillaries in normal tissues to deliver oxygen and nutrients within a diffusion-limited distance of cells, tumors often exhibit a complex and disordered blood supply, resulting in diminished perfusion to some or all parts of the tumor microenvironment and reduced delivery of blood-borne components, including systemically administered therapeutic agents.Citation4–Citation9
The full complement of reasons for poor chemotherapeutic efficacy in metastases is not understood;Citation4,Citation6 however, to improve drug delivery, functionalized nanoparticles are being developed to target cancers and increase local drug concentrations, cellular uptake, and clinical effectiveness.Citation10–Citation18 Unlike small drug molecules that equilibrate quickly through tissue space by diffusion alone,Citation19,Citation20 larger functionalized nanoparticles (including targeting antibodies,Citation10–Citation12,Citation14,Citation15 environmental reactive drugs,Citation21 or imaging reagentsCitation22,Citation23) are unable to diffuse as easily.Citation19,Citation20 Several in vivo studies have shown that with targeted carriers, even if the cellular uptake is increased, the tumor drug concentration remains unchanged compared with untargeted carriers.Citation11–Citation13 This poor penetration can reduce the efficacy of large nanoparticle carriers, particularly within poorly vascularized cellular regions in the tumor environment.
In order to provide adequate nanoparticle concentrations to breast and other metastatic tumors, we are evaluating a new method of normalizing nanotherapyCitation30–Citation37 (see ) that is designed to achieve two important goals: (1) increase nanoparticle levels in poorly vascularized tumors or tumor subregions by equalizing the concentration between tumor and normal tissues, and (2) improve tumor nanoparticle levels simultaneously in all tumor foci across a given anatomical region, without the need for imaging-based, positional information of lesions. To accomplish these objectives, magnetic nanoparticles would be given systemically and allowed to distribute throughout the body. A magnetic force would then be applied in one direction over a specified anatomical zone of the body to promote movement of the therapeutic particles into the tumor space from adjacent, well-vascularized normal tissue (an effective external nanoparticle reservoir) and also from subregions within the tumor that contain high levels of nanoparticles (eg, internal vessels). The externally applied magnetic forces would overcome diffusion limits by physically displacing ferromagnetic drug carriers across nano- or micrometer distances (). This displacement can be driven in one direction only, but our studies show that it is advantageous to repeat the process in at least two directions to more uniformly distribute the nanoparticles due to the complex geometries of vessels within tumor foci. Because the nanoparticles have a finite circulation time in vivo, there is a balance between magnetically actuating for as long as possible in one direction versus successively applying magnetic forces in multiple directions to better redistribute drugs into and throughout metastatic tumors. Our finding is that two directions is a practical compromise between shift distance and number of shift directions, and we examine that case here.
Figure 1 A map of when dynamic magnetic shift (DMS) is predicted to be advantageous over diffusion alone for poorly perfused liver metastases (for a sample 0.5 mm diameter tumor, therapeutic particles are assumed to have a 45-minute in vivo residence time). For two common types of tissue models, a Renkin Pore modelCitation19,Citation20,Citation24 or a Fiber-Matrix model,Citation19,Citation20,Citation25 the coloring shows when DMS treatment will improve drug delivery to the tumor. Here, “High diffusion” refers to the region where diffusion alone should suffice. It is the region where particle diffusion is predicted to create a concentration of therapy in all tumor cells that is ≥85% of the concentration of therapy in the bloodstream. “Some advantage” (yellow) and “Most advantageous” (red) is where diffusion will not suffice and DMS has the potential to improve therapy concentration to all cells in the tumor by >17% and >100%, respectively, compared with diffusion alone. Thus, DMS will be advantageous for mid-range 10–500 nm particle sizes, when the particles are big enough that diffusion alone is no longer effective but small enough that they can be magnetically moved through tissue. Particles of this size include heat shock protein cages (<16 nm),Citation26 polymeric micelles (<50 nm),Citation27 colloidal suspensions of albumin-Taxol (Abraxane, 130 nm),Citation28 and functionalized carbon nanotubes (0.1–4 μm).Citation29
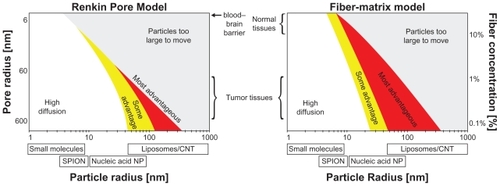
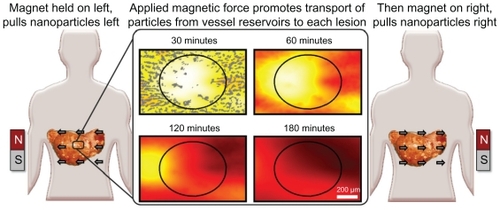
Figure 2 Schematic illustration of magnetic left-then-right shift option to increase nanoparticle levels into and throughout liver metastatic tumor foci. Left and right panels: appropriately chosen (strong and correctly sized) magnets can create sufficient magnetic gradients on therapeutic magnetic nanoparticles to displace them from dense distributions in normal tissue into adjacent poorly vascularized tumor regions. In this example, magnetic shift is shown in just two successive directions, but the process can be repeated in multiple spatial planes. Middle panel: computer simulations of the resulting therapeutic particle distributions in a 1 mm-wide tissue region using blood vessel geometry taken from autopsy data (gray markings). The color gradient shows the resulting nanoparticle concentration at each tissue location (red is high, white is low). Magnetic actuation increases nanoparticle concentration in the tumor area (marked by the black circle, also clearly visible by a lack of blood vessels) at 30, 60, 120, and 180 minutes after systemic injection.
To evaluate the histological and vascular features of metastatic foci in human subjects and their implications for magnetic drug delivery, a series of autopsy cases from women who died from metastatic breast cancer were analyzed. Blood vessel density and geographic distribution were quantitatively measured and these data used for mathematical simulations of the distribution of magnetic particles within tumors with and without magnetic actuation, to assess the feasibility of dynamic magnetic shift (DMS) and also to describe and understand the critical elements that affect the process. In brief, strong magnets of a carefully selected size (20 × 40 cm) that create substantial magnetic gradients inside the body (magnetic fields fall off with distance creating a spatial gradient) were evaluated; the magnetic fields, gradients, and forces were computed by standard methods;Citation32,Citation38–Citation41 the most realistic available parameters were used for human tissue resistance to particle motion;Citation19,Citation20,Citation24 and DMS parameters (strength and timing for a two-direction shift) were varied to evaluate different treatment regimens. Finally, because one of the most common sites for metastasis of breast cancer is the liver and there is clinical evidence suggesting that treatment of metastatic hepatic lesions can lead to improvement in patient outcome, we focused our attention on hepatic metastasis.Citation2,Citation42–Citation44
Materials and methods
Evaluation of autopsy reports and specimen selection
Autopsy reports of patients with metastatic breast cancer as the underlying cause of death at the National Institutes of Health (NIH) Clinical Center between 1991 and 2007 were evaluated for the study. The reports included a complete clinical history and autopsy findings. Areas of metastatic spread were identified for each patient to reveal organs most frequently affected by metastases, and chemotherapeutic treatment history and cause of death were compiled. A pathologist based the block selection on two criteria: the presence of at least one metastasis, and the presence of adjacent normal tissue for comparison. After histopathological review, ten cases were selected for the study.
Immunohistochemistry
Immunohistochemical staining of formalin-fixed and paraffin-embedded liver sections for CD31 expression was performed with a standard immunohistochemistry protocol using the Dako EnVision+ System-HRP kit (Dako North America, Inc, Carpinteria, CA). After deparaffinizing each 5 μm-thick histological section, antigen retrieval was performed using 1X citrate buffer with 0.05% Tween 20 (Invitrogen Corporation, Carlsbad, CA) for 30 minutes in a steamer, then cooled slowly to room temperature. Peroxidase block was applied for 30 minutes at room temperature. After rinsing with 1X phosphate buffered saline, tissue sections were incubated overnight at 4°C with ready-to-use anti- CD31 primary mouse monoclonal antibody (Dako #IS610) and then incubated with mouse antimouse secondary antibody conjugated to peroxidase for 1 hour (Dako). The DAB + substrate-chromogen solution (Dako) was applied for 15 minutes; after rinsing in ddH2O, the samples were submerged in DAB Enhancer (Invitrogen) for 30 minutes. Sections were counterstained with hematoxylin, dehydrated, and coverslipped. Negative controls were established by replacing the primary antibody with antibody diluent, and no detectable staining was evident.
Image analysis (Aperio, ImagePro, Matlab)
After CD31 immunohistochemistry and hematoxylin counterstaining, we acquired whole-section images with the Scanscope CS system (Aperio Technologies, Inc, Vista, CA) from the ten cases. Within each image, ten areas of normal and ten of tumor were chosen arbitrarily in 1.2 × 0.75 mm rectangles, totaling 200 images. We counted the number of nuclei (hematoxylin-stained; blue) and the number of blood vessels (CD31-positive cells; brown) using the Image-Pro system (Media Cybernetics) and Manual Color Selection. The appropriate colors for nuclei and vessels were chosen separately for each image to maximize the software’s recognition for each structure and to minimize background. For tumor images, Watershed was applied to separate the clustered nuclei. Matlab was used to compute and plot the distance from each tissue location to the nearest blood vessel.
Parameters for nanoparticle diffusion and magnetic transport through human tissue
At present, nanoparticle diffusivity and tissue resistance are not well known or characterized, especially within metastatic tumors in humans.Citation19,Citation20 However, there are several models that can be used to predict the relative movement of nanoparticles through tissue based on the size of the particles and relevant tissue parameters. Two traditional models (the Renkin Pore modelCitation19,Citation20,Citation24 and the Fiber-Matrix modelCitation19,Citation20,Citation25) were examined to determine the range of both diffusivity and tissue resistance.
The classical method of describing particle motion through different media is by a reduced diffusion coefficient that scales both the blood diffusion coefficientCitation19,Citation20,Citation41 and the magnetic drift coefficient (by assuming Einstein’s relation).Citation20,Citation41 This reduced coefficient usually depends upon particle size (it decreases as the size increases) and the properties of the tissue (denser tissues increase particle motion resistance). Conversely, the magnetic force increases with particle size, it simply scales with particle volume.Citation32,Citation41,Citation45 Thus, there is an optimal particle size for different tissue properties. The particles should be big enough so that the magnetic force is substantial but small enough to effectively move through the tissue ().
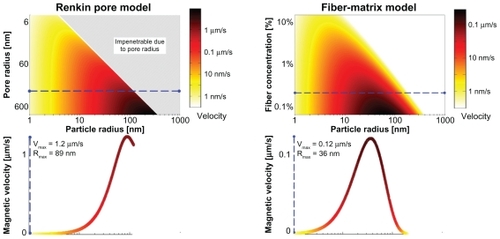
Figure 3 Optimal particle size for dynamic magnetic shift. Two classical models of tissues (Renkin Pore and Fiber-Matrix model) are used to determine the maximum velocity for a given particle size. The top panels show the nanoparticle magnetic velocity (by a color scale, with black being the fastest and white the slowest) for a given particle radius and tissue characteristic (pore size or fiber concentration). A cross-section was taken (dashed line) to show the magnetic velocity for either a pore radius of 200 nm or a fiber concentration of 0.3%. A 20 × 40 cm magnet with a 2.5 Tesla remnant magnetization held 11 cm away was used to calculate the magnetic velocity of the nanoparticles. There is a clear optimal particle size choice. For this tissue density it is 89 nm or 36 nm according to the Renkin or Fiber-Matrix model, respectively.
Using and assuming a physiologically worst-case scenario for DMS of a very diffusive metastatic tumor (where the diffusion of nanoparticles is high, reducing the potential beneficial impact of the magnetic actuation, see ), a fiber concentration CF ≈ 0.3% using the Fiber-Matrix modelCitation19,Citation20 was chosen, which led to an optimal particle diameter of 60 nm and a maximum particle magnetic drift velocity of ≈0.09 μm/s. The associated tissue diffusion coefficient, via the particle’s size and Einstein’s relation, is D ≈ 9 × 10⁻¹³ m2/s. These parameters were used to evaluate the DMS methodology.
Magnetic drug transport simulations (Comsol Multiphysics)
To examine the effect that low vascular density has upon magnetic targeting procedures, simulations were constructed using the histology of a representative small metastatic tumor (diameter ≈ 0.5 mm) and the surrounding normal liver parenchyma. Using finite element modeling software, the behavior of magnetic nanoparticles was examined with and without the application of magnetic actuation (Comsol Multiphysics).Citation46 All magnetic fields, gradients, resulting forces, and particle motions were computed from physical first principles,Citation32,Citation38,Citation39,Citation41,Citation45 using the most realistic available parameters for particle diffusivity and resistance to motion in human tissue.Citation19,Citation20
The evolution of particle distributions in media was described by partial differential equations. Here, for diffusion and magnetic transport in tissue, the appropriate partial differential equation with boundary and initial conditions is shown in EquationEquations (1)(1) and Equation(2)
(2) Citation47,Citation48 (details provided in Supplementary information).
This type of formulation is standard, and the properties of tissue (D, V⃗magnetic, thalf-life, C0) were chosen to match the properties of drug-coated 60 nm-diameter magnetic particles in human tissue.Citation19,Citation20,Citation38,Citation41,Citation49 The decay constant, λ, defines how the particle concentration in blood is related to the nanocarrier half-life, thalf-life. A Fiber-Matrix model with a 1 nm-radius fiber volume concentration of CF = 0.3%Citation19,Citation20,Citation25 was chosen to evaluate the worst-case situation for DMS where the diffusion coefficient of the particles is high, thus reducing the benefit of DMS (for this CF = 0.3%, the reduced diffusion coefficient of the Fiber-Matrix model is DT ≈ 0.15).Citation19,Citation20,Citation25,Citation41 The magnetic field and magnetic gradient around a 20 × 40 cm magnet (2.5 T remnant magnetization) was solved using COMSOL,Citation39,Citation41 which gave the magnetic force at a depth of ≈11 cm in the body as Fmag ≈ 0.34 fN. Comparing this force with tissue resistance, Fresistance ≈ (1/DT) 6 π a η Vmagnetic, where a is the particle radius, η is the fluid viscosity, and Vmagnetic is the speed at which nanoparticles are transported through the region of tissue by the applied magnetic force, yielded a particle magnetic drift velocity of Vmagnetic ≈ 0.09 μm/s.Citation38,Citation41
Three treatment scenarios were considered: (a) no applied magnetic forces (for a treatment duration of t = 3 hours), (b) a constant unidirectional west magnetic force (t = 3 hours), and (c) a sequence of magnetic forces chosen by intuition that begins with no magnetic force (for t = 45 minutes) followed by a unidirectional east force (for t = 1.5 hours), which then switches to a unidirectional west force (for t = 45 minutes). Option c was chosen to test the effects of switching magnetic force directions on both the average and maximum-over-time nanoparticle concentration achieved in the tumor region to see whether it could be improved over the results of option b. Subsequently, we carried out a comprehensive search over magnetic force duration and number of pull directions (single or bidirectional pull) to go beyond option c and to find optimal DMS treatment parameters for a 1.5-hour treatment.
Results
Overall clinical picture
Autopsies from 18 women with metastatic breast cancer who died at the NIH Clinical Center were initially evaluated. The liver (89%) and the lungs (89%) were the extra-skeletal organs most commonly affected in this cohort of patients, although a majority of the women also had widespread systemic metastases. The most common causes of death were overall tumor burden and respiratory compromise, often associated with infections that were secondary to therapy and immune suppression. The chemotherapeutic treatment history in the patients varied; however, in all cases the drugs received were standard regimens. Grossly, the metastatic tumor foci appeared as firm, white nodules, in contrast to the adjacent, dusky, liver parenchyma ().
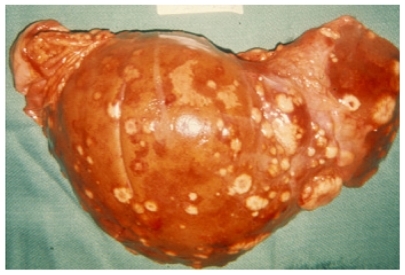
Figure 4 Photograph of metastatic breast cancer in liver. The lesions appear grossly as firm, white nodules, consistent with a host desmoplastic response and poor vascularization.
Notes: The image is representative of the pathological descriptions in the autopsy cases in the study but is not an actual image from one of the cases. Photo provided courtesy of Drs Hanne Jensen and Robert D Cardiff, Center for Comparative Medicine, University of California, Davis.
Vessel measurements: normal liver and metastases
Ten autopsies were chosen for vessel analysis based on the quality of CD31 immunostaining. All ten patients had liver metastases, ranging from micrometastases that were only a few millimeters in diameter to grossly visible lesions that were a centimeter or more across. At the microscopic level the metastases comprised sheets of irregularly shaped tumor cells with pleomorphic nuclei. Foci of chronic inflammation, necrosis, and microhemorrhage were variably observed in the tumors.
Normal liver in the patients contained a fine meshwork of small vessels and capillaries interspersed throughout the parenchyma, an architectural pattern consistent with an even distribution of blood flow and diffusion-based delivery of oxygen and nutrients to hepatocytes and associated support cells. In contrast, the tumor vessels were generally larger in diameter but fewer in number than in the adjacent normal liver, with a more random distribution and a greater vessel-to-vessel spatial separation. This difference in tumor vasculature is evident in the low-power histological views shown in and was observed in the metastases from nine of the ten patients analyzed.
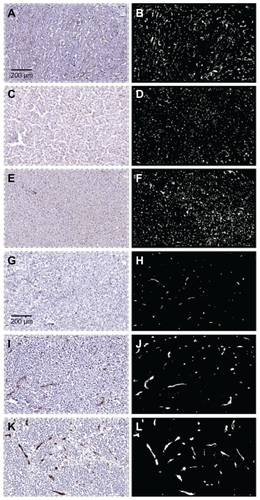
Figure 5 Photomicrographs of vessel staining in three cases of metastatic breast cancer in liver. Images on the left are immunostained histological sections. On the right are the same sections visualized in black and white to highlight the CD31-stained vasculature. Panels A–F are from normal liver and panels G–L are from matched tumors. At low power the normal sections show a fine meshwork of capillaries. In contrast, tumors exhibit vessels that are generally larger in size and fewer in number.
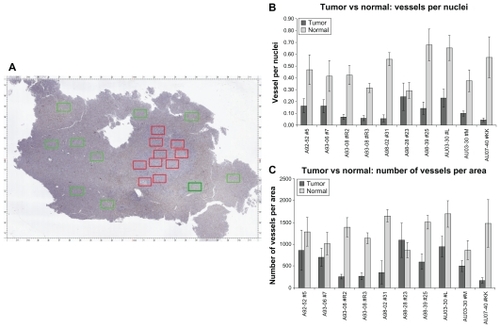
To quantitatively assess the vasculature patterns of both normal tissue and tumor, 20 arbitrary histological regions were chosen for each case: ten that contained normal liver (green rectangles) and ten with tumor (red rectangles). As an example, a low-power microscopic view of one case and geographic regions selected for analysis is shown in . Overall, the measurements revealed that tumors contained fewer vessels and had more vascular heterogeneity than normal tissue, consistent with the visual observations seen in . Except for outlier case A98-28 (the only lobular breast cancer case in the series, see Discussion section), all tumor cases had fewer vessels than normal tissue as measured using vessel count per cell number () or using vessel count per area ().
Figure 6 Quantitative measurement of vessels in normal liver and adjacent metastatic breast cancer in ten cases. Panel A: representative whole slide image of a histological liver section containing both normal tissue and tumor. Each rectangle represents a randomly chosen region (green = normal, red = tumor; dimensions = 1.2 × 0.75 mm; 100× magnification). Panel B: the vessels-to-nuclei ratio in tumor regions is lower and more variable than in normal areas. Panel C: tumor regions have a lower number of blood vessels per area than in normal tissue.
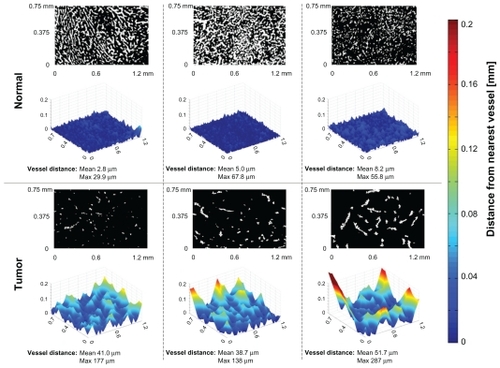
We next assessed the tumor microenvironment in terms of regions with the lowest number of vessels. In other words, we purposefully looked for and measured subregions of tumors with the lowest vascular density, then compared these subregions against normal tissue of the same patient by computing the distance to the nearest blood vessel for every location within the tissue image. As seen in the panels across the top of , in a normal region the average of the distance from each cell to its nearest blood vessel is 5.3 ± 2.7 μm (the maximum is 67.8 μm; n ≈ 5500). In contrast, in the selected tumor region, the average was observed to be 43.8 ± 6.9 μm (the maximum was 287 μm; n ≈ 5500). These results indicate that in addition to a lower average vascular density than normal tissue, there exist specific subregions of tumors that are far away from all vessels, regions that are likely poorly perfused and difficult for systematically administered particles to access.
Figure 7 Computation of the distance of normal liver cells (panels across top) or tumor cells (bottom) to their nearest blood vessel. The black and white images indicate tissue (black) and vessel (white) locations. Each normal and tumor region was selected for analysis based on the fewest number of vessels observed at low magnification. The three-dimensional relief graphs show the distance in microns to the nearest blood vessel for a given tissue location. As the graphs increase in height, that tissue location is further from its nearest blood vessel. In all examples, the tumor cases have cells located further away from nearest blood vessels (indicated by larger mean and maximum values).
Magnetic drug transport simulations
To evaluate the utility of externally applied magnetic forces in equilibrating nanoparticle levels in tumors, a series of simulations of EquationEquations (1)(1) and Equation(2)
(2) were performed. The rate of nanoparticle extravasation through capillary walls, the decay constant λ in EquationEquation (2)
(2) , was inferred from the measured half-life (thalf-life) of nanoparticles in patients in the clinical trials of Lubbe et al.Citation50,Citation51 (For additional details on the simulations and mathematics, see Supplementary information.)
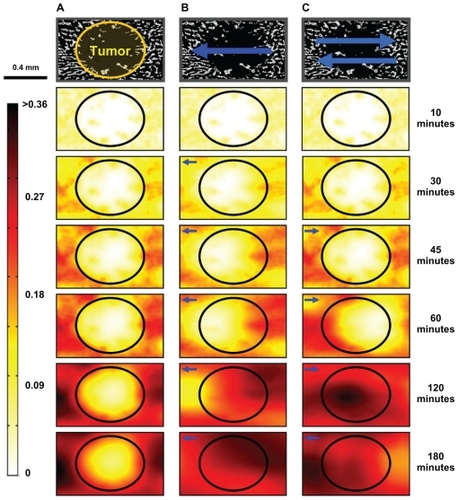
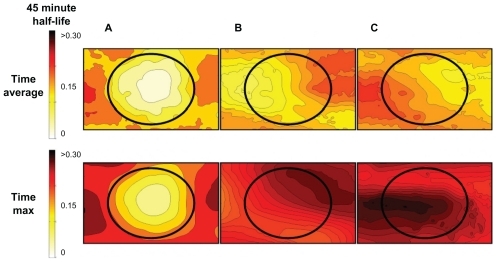
and compare the time-progressed behavior of the magnetic nanoparticles for the three treatment scenarios. represents the change in particle concentration with no applied magnetic forces over 3 hours for a tissue sample that includes a small metastasis. Locations with high vascular densities (normal tissue) produced regions with high particle concentrations, whereas regions with lower vascular densities (tumor) experienced lower concentrations. In , a constant west magnetic force was applied for 3 hours. The increase in particle concentration in the tumor is especially evident at the end of the second hour (at 120 minutes). Single direction shift yielded a 15.8% (compared with in blood) time-averaged nanoparticle concentration in the tumor, instead of the prior 9.9% value (a 1.6-fold improvement), whereas time-averaged particle concentration in the normal tissue remained almost the same as for diffusion only (19.6% instead of 20.4%). Thus, magnetic shift in just one direction partially renormalized particle concentration from normal to tumor tissue. simulated an alternating bidirectional magnetic treatment. This simulation began with no magnetic forces (for 45 minutes) then a unidirectional east magnetic force (for 1.5 hours), which then switched to a unidirectional west force (for 45 minutes). Alternating the direction of magnetic forces more effectively normalized particle concentration between normal and tumor tissue as the time-averaged concentration of particles in the tumor was 18.0%, which is close to the 19.7% concentration in normal tissue, a 1.99-fold improvement compared with no magnetic actuation. The timeaveraged metric is appropriate for time-dependent therapies or phase-specific therapiesCitation52 like paclitaxelCitation53 and topotecan,Citation54 where it is important to ensure that cancer cells experience a higher dosage of therapy over a long time window to continue treating them until they enter the correct phase of their cell cycle. For phase-nonspecific therapies or dose-dependent drugsCitation52 like gemcitabineCitation55 and carboplatin,Citation56 it would suffice to increase the dose in cancer cells for just a short time, because the drug efficacy is not dependent upon the cancer’s cell cycle phase. In this phase-nonspecific case, it is more appropriate to consider the time-maximum concentration at each tissue location. If such a time-maximum metric is considered, then even a single direction shift is sufficient to normalize the maximum-over-time nanoparticle concentration from normal to tumor regions (see ).
Table 1 Time-averaged and time-maximum particle concentrations in tumor versus surrounding normal tissue
Figure 8 Time progression of nanoparticle concentration for the three treatments. The panels across the top were from a histological image of normal liver containing a small metastasis (marked by the circle). (A) Nanoparticle concentration with no magnetic forces and only diffusive effects. The tumor region had a low nanoparticle concentration even after 180 minutes. (B) Nanoparticle concentration with a constantly applied magnetic force to the left (west). The nanoparticles were displaced to the left, increasing the particle concentration in the tumor. (C) Nanoparticle concentration with an alternating magnetic force first to the right (east) and then to the left (west). Nanoparticles from surrounding normal tissue were effectively brought into the tumor region by dynamic magnetic shift.
plots the results from the simulations, showing the average and maximum nanoparticle concentration over time in the tissue for three scenarios: case (a) no applied magnetic forces (diffusion only), case (b) west-only magnetic force, and case (c) a sequence of alternating magnetic forces (east then west). In case (a), diffusion only with no magnetic forces applied, both the time-averaged and the time-maximum nanoparticle concentration in the tumor region was half what it was in the normal tissue (Ave[Normal]a = 20.4%, Ave[Tumor]a = 9.9%; Max[Normal]a = 28.9%, Max[Tumor]a = 15.8%) (). In case (b), a constant unidirectional (west) magnetic force improved the maximum nanoparticle concentration over time significantly in the tumor, but the average over time increased only moderately compared with the surrounding normal tissue (Ave[Normal]b = 19.6%, Ave[Tumor]b = 15.8%; Max[Normal]b = 27.4%, Max[Tumor]b = 27.4%) (). Finally, case (c), a bidirectional sequence of magnetic forces (east then west), was shown to be the most effective and improved both the average and maximum tumor nanoparticle concentrations relative to normal tissue (Ave[Normal]c = 19.7%, Ave[Tumor]c = 18.0%; Max[Normal]c = 29.0%, Max[Tumor]c = 30.1% in tumor) (). Overall, case (c) increased the Ave[Tumor] ratio for magnetic actuation versus diffusion by 1.86-fold, and increased the Max[Tumor] ratio by 1.89-fold. In essence, magnetic shift was able to normalize the concentration of nanoparticles between normal and tumor cells, both according to the time-averaged (for slow-acting therapies) and time-maximum (for fast-acting therapies) metrics. (Further details on these simulations are provided in Supplementary information.)
Figure 9 Visualization of the time-averaged (for slower-acting therapies) and time-maximum (for fast-acting therapies) concentration of therapy in normal and tumor tissue for the three cases from . The top shows the time-averaged nanoparticle concentrations achieved across the tissue section over the 3-hour treatment window using: (A) diffusion only, (B) a left magnetic pull only, and (C) a two-directional magnetic pull. The tumor in the center of the image receives both significantly higher average and time-maximal nanoparticle levels when dynamic magnetic shift is applied.
The cases in show that DMS can normalize nanoparticle concentrations across tumors by effectively transporting particles from well-vascularized normal tissue to poorly vascularized tumor regions. In the example in , the bidirectional mode timing was chosen based on intuition. It was thought beneficial to wait for some time to allow nanoparticles to first accumulate around vessels, and then to pull in the two different directions. To improve on case (c), based on the collected autopsy data, we sought to determine the best DMS parameters by optimizing the timing and direction of the applied magnetic force.
Timing optimization proceeded by defining a therapy normalization metric, by considering a cohort of tissue slices that included a metastatic tumor surrounded by normal tissue, and then by varying parameters and optimizing the metric to find the most effective DMS timing parameters. Because our goal was to normalize particle distribution across the tissue (we wanted to avoid the situation where nanoparticles are present in normal tissue but are absent from the tumors), the chosen metric had to include a notion of concentration uniformity. We also wanted to continue to consider both slow-acting and fast-acting therapies, for which, respectively, time-averaged and time-maximum particle concentrations are more appropriate. Thus, we chose to consider the following two metrics:
The numerator was simply chosen to be the spatial average of the nanoparticle concentration across the entire tissue, for either the time averaged or time maximum. However, the denominator of the metrics penalizes high spatial variance across tissue. If the spatial variance is high (eg, the tumor has regions of both high and low particle concentration, an undesired situation because some tumor regions remain untreated), then the denominator is high and the metric is low. The numerator and denominator together try to ensure a nonzero and uniform concentration of therapy across the entire tissue, which is the normalization that DMS is trying to achieve. In particular, if DMS parameters can be chosen to create a completely uniform nanoparticle concentration, then this metric will reach infinity (its highest possible value). Without DMS, the therapy concentration is high in well-vascularized normal tissue but low in poorly perfused tumors ().
For DMS optimizations, we considered a small cohort of four tissue slices that included microtumors. Two DMS parameters were chosen: the duration of the first pull and the duration of the second pull. Because the treatment time was kept constant at 1.5 hours, this also defined the waiting period at the start by twait = 1.5 hours − tfirst-pull − tsecond-pull. Each of the two pull durations was varied across 25 values, for a total of 625 simulations per tissue slice and an overall total of 2500 simulations. It took 4 days to complete the simulations on a Core i7 2.6 GHz computer running Windows 7 with 6 GB of RAM. shows the fold increases in the two metrics J avg and J max versus the diffusion only case.
Figure 10 The degree of nanoparticle normalization fold increase over diffusion alone as a function of two dynamic magnetic shift parameters (pull left duration and pull right duration). For each tissue slice, the average over time for slow-acting therapies (left panel) or maximum over time for fast-acting therapies (right panel) was considered. Then, the degree of nanoparticle normalization, Jtime-avg and Jtime-max, was calculated using the formulae of EquationEquation (3)(3) . The fold increase of the degree of normalization versus diffusion alone was plotted. High J values corresponded to high average concentrations and low spatial variances in the particle concentrations. Hence, the highest J value would be for a uniform high concentration. Low J values corresponded to low concentrations or high spatial variances that would correspond to hot and cold spots in the tissue and are the opposite of what dynamic magnetic shift is trying to achieve. The shift parameters are shown with the first pull duration and direction on the horizontal axis, and the second pull duration on the vertical axis. The first pull was either to the west (W) or east (E) for a fraction of the total time (hence, it is shown from −1 to 1). The second pull was always in the opposite direction to the first and was similarly a fraction of the total time. Thus, the location (+0.6, −0.2) corresponded to 20% (18 minutes) initial waiting time, followed by a 60% (54 minutes) pull to the east, then a final 20% (18 minutes) pull to the west. In this representation, pure diffusion (no pulling) corresponded to the vertical axis centered at “D” for diffusion only. For any pair where magnetic actuation was not applied for the full duration (anywhere within the interior of the triangles), diffusion occurs first during the initial waiting period. The optimal shift parameters are marked by the four blue stars. The found optima are different for phase-specific (time-averaged metric) and phase-nonspecific (time-maximum metric) therapies.
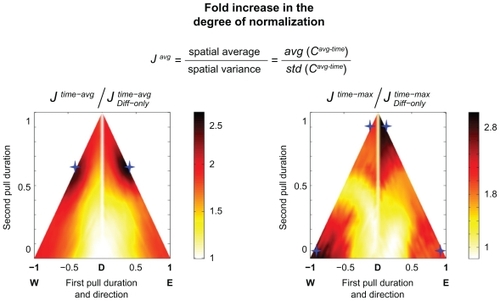
shows the four optimal situations as indicated by the blue diamonds. To increase the degree of normalization for slow-acting therapies (time-averaged cases, Jtime-avg), it was best to allow the nanoparticles to diffuse a small amount from the vessels and then shift in one direction for ≈40% of the time, and then shift in the opposite direction for the remainder of the time (≈60%). This corresponded to shifting in one direction until just before the half-life of the nanoparticle is reached (at time 0.5). Neglecting small statistical variations that remained because we analyzed only four tissue samples (due to computing constraints), it made no difference whether one shifts left or right first. In contrast, in order to increase the degree of normalization for fast-acting therapies (time-maximum cases, Jtime-max), it was best to shift the nanoparticles in only one direction – either only left or only right for the entire duration of the treatment. This ensured that every region of tissue sees as many new nanoparticles as possible. In this simulation, bringing the particles back in the opposite direction did not improve the maximum-over-time metric. Thus, depending on what kind of therapy was being considered (fast or slow acting), a different DMS strategy was optimal (single or bidirectional pull).
Discussion
Metastatic tumors exhibit a diverse set of cellular, pathological, and structural features that make them a challenging target for therapeutic intervention.Citation2,Citation42 Evaluation at the microscopic level shows a variety of histopathologies, both within and among different cancer foci. For example, tumor grade, cellularity, degree of inflammation, desmoplastic host response, microhemorrhages, and necrosis can vary from lesion to lesion and even from subregion to subregion within a neoplasm. Moreover, the vascular characteristics of metastatic tumors differ from normal tissues and among cancer sites, both spatially and temporally.Citation5 Tumor vessels are often dilated, saccular, tortuous, and disorganized in their patterns of interconnection, producing a geometric resistance to blood flow and a decrease in perfusion.Citation7 The dysfunctional vasculature is evident at the gross pathological level as a striking feature of metastatic lesions is their firm, white appearance, suggesting that blood perfusion is less than that of most normal organs ().
The chaotic nature of the vasculature and the subsequent increase in interstitial fluid pressure can result in uneven, fluctuating blood flow in tumors and prevent exposure to conventional nanotherapies that rely on the blood supply for diffusion-based distribution throughout the body, because the highest concentration of systemically delivered therapeutics is achieved at sites closest to the blood vessel, and the concentration falls as the distance increases. As an example of this phenomenon, a study of local concentration of fluorouracil in liver metastases models as compared with adjacent normal tissue revealed limited fluorouracil penetration in areas of poor blood flow.Citation4 Inadequate tumor perfusion can also result in hypoxia, which is postulated to be a central feature of cancer that is important to the physiological functioning and survival of the tumor cells and associated host cells. Historically, hypovascular tumor foci have been indirectly observed by their resistance to ionizing radiotherapy that relies on tissue oxygen content at the time of treatment.Citation6 More recently, hypoxic regions have been described to produce genomically unstable, clinically aggressive tumor cells that thrive in these regional microenvironments.Citation9 Thus, poorly vascularized tumors or tumor subregions can be clinically problematic based on both the inability to achieve therapeutically effective drug levels and the hypoxic microenvironment that is favorable to tumor cell growth and progression.
In the present study, we found that metastatic breast tumors in liver consistently had a lower number of blood vessels, on average, across the lesions than adjacent normal liver tissue (see ). Moreover, specific tumor subregions contained little or no vasculature, with vessel-to-tumor cell distances as large as 287 μm (see ). The one exception to this pattern was the outlier case A98-28. Interestingly, A98-28 is a liver metastasis of lobular carcinoma, the only nonductal cancer that was included in the study. Detailed histopathological inspection of this tumor revealed large, poorly differentiated cells that did not grow in solid sheets but rather in clusters that invaded the liver through the sinusoidal system, expanding it rather than replacing the normal tissue. The endothelium of the expanded sinusoids continues to express CD31; however, the majority of the CD31-positive cells are not blood vessels. Thus, although case A98-28 appears well perfused, it may in fact be the least vascularized tumor in the series due to the pathological features associated with metastatic lobular carcinoma.
To date, magnetic drug delivery has been used for focusing antineoplastic agents to primary, superficial tumors and has been evaluated in phase I clinical trials by placing a strong permanent magnet (0.8 Tesla) near the tumor.Citation50,Citation51,Citation57 Although this approach is promising to treat single inoperable tumors in known, near-skin surface locations, it does not solve the larger clinical problem of increasing therapeutic levels in widespread metastatic disease, including lesions that are not near the skin surface. For nanotherapy, this is especially problematic because nanocarriers will diffuse substantially less effectively than small drug molecules. Simulations of the effect that magnetic gradients have upon nanoparticle movement in tissue revealed that it is possible to use DMS to transport nanoparticles from vessel reservoirs in normal tissue to avascular tumor areas. Both single- and two-directional dynamic shifts were able to better distribute nanoparticles over the tissue space, with the bidirectional approach achieving a more even concentration throughout the tumor, showing the promise of using magnetic actuation for reaching into regions of the body that are inaccessible to pure diffusive movement of nanocarriers. Of particular note, the DMS method described and simulated here can be applied simultaneously to all metastatic foci in a given anatomical region of the body, as the magnets used would create sufficient gradients and forces on nanoparticles across all target locations, without the use of radiological imaging to identify lesions. This is important in breast cancer and other common epithelial tumors where many hundreds of metastatic sites typically exist in patients with advanced disease, ranging in size from grossly visible tumors to small, micrometastatic foci (for an example in liver, see ). A one-by-one approach to visualizing each tumor by radiological imaging and then using magnetic control to target them individually would be impractical; however, DMS does not require such imaging and can be applied simultaneously to all lesions within a defined anatomical zone.
DMS appears to be a promising solution to the problem of low blood supply in tumors. However, there are specific caveats that must be considered regarding this approach and the results described previously. First, we used vascular density as a surrogate marker of perfusion, and this assumption may not be accurate. In other words, the decrease in vessel number in metastatic lesions and the focal subregions with few or no vessels are consistent with decreased perfusion, but it is also possible that the unique nature of the tumor microenvironment, or other factors we have not yet considered, can compensate for the disordered vasculature, and so perhaps therapeutic levels of drugs or nanoparticles may reach most or all tumor cells by diffusion alone. Ultimately, measurement of actual drug levels in clinical cancer samples will be necessary to gauge the effect of the abnormal tumor vasculature on drug concentration close to and distant from vessels, and such studies will be undertaken in future work.
The second caveat is that the liver tissue utilized as a “normal control” in our study may not be an appropriate metric for evaluating tumor vessels. Liver is richly vascularized with vessels and sinusoids in order to support the extensive metabolic functions of hepatocytes and has a high degree of vascular input and output. The fact that metastases have fewer vessels than adjacent liver tissue does not necessarily indicate that the tumor vasculature is incapable of providing therapeutic nanoparticle levels to cancer cells.
Finally, the use of external magnets as a nanoparticle delivery system requires particles of large enough size to generate sufficient force to displace them in tissue. The larger the particle, the larger the force. However, as the size of the particle increases, the diffusability (D in the differential equation described in the Results section) will decrease due to mechanical constraints in the microenvironment, including physical barriers of cell-to-cell adhesion, the composition and density of stromal constituents, and the nature of the tumor cell-stromal interactions. Overall, the balance of magnetic force versus tissue resistance favors medium-sized particles (>10 nm but <200 nm). Magnetic forces increase with particle volume (radius cubed), whereas the tissue resistance initially increases slowly with particle size until the particle size nears a defining characteristic of the tissue (ie, pore radius for the Renkin Pore model), making the resistance grow exponentially thereafter.Citation19,Citation20 In normal highly organized and tightly compartmentalized tissues, the characteristics that define a tissue will favor smaller particles (ie, small pore radii ~10 nm). But within the disorganized and haphazard structure of the tumor microenvironment, the tissues can be described to have much larger pore sizes that allow relatively unimpeded movement of even large-sized nanoparticles (~200 nm) through substantial areas of tumor space. Clearly, though, all of these critical aspects of magnetic drug delivery will need to be carefully evaluated both in future simulations and in model systems designed to test and optimize the method in the laboratory. The goal in this paper is to present the motivation and initial proof of concept for DMS based on autopsy studies of vasculature in human metastases and using mathematical modeling that has been validated against both in vitro and in vivo experiments in prior studies.Citation41,Citation58
Conclusion
In summary, DMS simulations based on quantitative analysis of the tumor vasculature in women who died of metastatic breast cancer indicate that improved nanoparticle concentrations can be achieved using magnetic gradients generated by one or two externally held strong magnets. Depending on the desired therapy, slow or fast acting, we determined an optimal DMS strategy for improving the nanoparticle normalization throughout the entire tumor space within the treated anatomical region. The next steps of this effort are additional simulations to further refine the modeling followed by laboratory evaluation of DMS in ex vivo tissue specimens, in order to experimentally test and visualize nanoparticle transport in animals with poorly perfused tumors to mimic the situation observed in human patients.
Supplementary information
EquationEquation (1)(1) describes the basic physics of nanoparticle transport inside the body and shows that accumulation or depletion of particles at any location is due to transport by diffusion and applied magnetic forces. This type of formulation is standard.Citation49,Citation60 Parameters are chosen to reflect the tissue properties of the region of interest (eg, the diffusion coefficient can be changed to reflect parameters of normal or tumor tissue), and it is this equation that is simulated here. EquationEquation (2)
(2) reflects our knowledge about the residence time of nanoparticles in vivo and states that the amount of particles that extravasate from blood to tissue at a given time is linked to the plasma concentration, which decays exponentially over time due to uptake of the nanoparticles by the reticuloendothelial system.
Magnetic fields, gradients, and the resulting forces on nanoparticles
For any electromagnet or permanent magnet, a magnetic field surrounds the magnet with field lines leaving the north pole and re-entering the south pole.Citation45 The field generated will be stronger closer to the magnet (specifically at the corners) and weaker as the distance from the magnet increases.Citation40,Citation41,Citation45,Citation61 The magnetic field falls off very quickly further from the magnet relative to its size (larger magnets will have a slower decreasing magnetic field strength),Citation41,Citation62 creating a magnetic field gradient, and it is this gradient that creates a force that attracts particles towards the magnet. For a 20 × 40 cm magnet with a remnant magnetization of 2.5 T, the field at 11 cm distance (along the long axis of the magnet) will be B ≈ 0.43 T or H ≈ 3.4 × 10⁵ A/m. The gradient of the magnetic field at that distance will be ∂H/∂x ≈ 2.7 × 10⁶ A/m2. Using these values and considering a magnetic nanoparticle with a diameter of 60 nm, the magnetic forceCitation41,Citation45 acting on this particle will be FMagnetic ≈ (2/3)a3 μ0 [χ/(1 + χ/3)] H (∂H/∂x) ≈ 0.34 fN = 0.34 × 10⁻¹⁵ Newtons (a femto-Newton is 10−15 Newtons). Considering a Fiber- Matrix model with CF = 0.3%, as discussed in the Materials and methods section, the reduced diffusion coefficient of the described Fiber- Matrix model will be DT ≈ 0.15. Assuming that the reduced diffusion coefficient impacts forced particle movement in a similar manner as diffusion (Einstein’s relation),Citation19,Citation20,Citation42 the tissue resistance can be expressed as follows: Ftissue-resistance = (1/DT) 6 π a η VMagnetic. At equilibrium, the magnetic force and the tissue resistances are equal; therefore, the expected speed of a particle through a tissue space will be VMagnetic ≈ 0.09 μm/s or ≈90 nm/s.
Simulating nanoparticle movement
Each case simulated consisted of solving the constitutive EquationEquation (1)(1) over the entire image and marching it forward through time. Nanoparticles enter the surrounding tissue (shown in black in , top row) from the identified blood vessels (white regions in ) over time. The amount of nanoparticles moving from the vessels into the adjacent tissue is described by EquationEquation (2)
(2) , from which EquationEquation (1)
(1) generates the distribution of particles at the next time instant across the region of interest. This calculation is marched through time for 3 hours, creating a complete solution of the nanoparticle distribution for the entire treatment window ().
Boundary conditions
Two sets of boundary conditions are necessary to solve EquationEquation (1)(1) : one set to describe the extravasation from the blood vessels into the tissue (EquationEquation (2)
(2) ), and the second to describe the movement of nanoparticles out of the simulated region.
The first set of conditions is determined by the diffusion of particles from the vessels into the adjacent tissue governed by the nanoparticle concentration gradient (high in blood, low in tissue). Therefore, the movement of particles into the tissue is dependent upon the blood plasma concentration. Here we describe the concentration of nanoparticles within blood plasma as one that decays over time as described by EquationEquation (2)(2) . This decay models the known physiological plasma concentration of systemically injected nanoparticles. From this equation, the half-life (thalf-life) of nanoparticles in the blood plasma can be chosen to mimic physiological parameters in humans (here, thalf-life = 45 mins was used).Citation50,Citation51
The second set of boundary conditions defines the free movement, the flux, of nanoparticles out of the region of interest (). Nanoparticles leave only when the magnetic force pulls them out of the simulated region; therefore, the total flux of particles out of the tissue is equal to the convective flux created by the magnetic forces as described by the following equation:
Simulation region
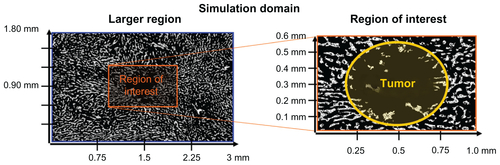
In case (b) and (c) of , nanoparticles are swept out of the simulated region then re-enter during treatment. We assessed the effects of particle re-entry on the accuracy of our simulation results by tripling the simulated region of to 3 × 1.8 mm, which centered on the original region of interest (). The increase in size was sufficient enough to accurately track all particles passing through the original region at any time. This did not change the results. In other words, all particles near the exterior boundary of the expanded region that would either enter or leave (ie, particles that would not be correctly tracked by our simulation) were too far away from the original region to contribute to its nanoparticle concentration.
Physiological modifications
The simulation framework presented can be modified, and detail can be added to address additional questions and to examine different treatment options. Variations in histology, changes to nanoparticles, and alterations in magnetic treatment correspond to changing the parameters in EquationEquation (1)(1) and choosing their variation in time and space. For instance, the initial distribution of magnetic particles in blood vessels after systemic injection, but not yet in surrounding tissue by subsequent extravasation, diffusion, and magnetic forces, is reflected by choosing the initial condition C0 (x, y, z) to match the geometric distribution of blood vessels measured from the histology (). Likewise, computing the magnetic forces and including the migration velocity they cause for nanoparticles in each location in the body, including the effect of varying magnetic fields during treatment, can be included in V⃗ magnetic(x, y, z, t). The impact particle and physiological parameters have upon specific terms in EquationEquation (1)
(1) , however, is not always obvious. For example, varying the particle size will affect not only the diffusion coefficient D but also the magnitude of the particle migration velocity, V⃗magnetic , as discussed in the Materials and methods section. The diffusion coefficient, as is described by Brownian motion, decreases as the particle size increases.Citation49 The magnetic forces on particles scales with the volume of the particles but is opposed by the viscous resistance to nanoparticle motion offered by blood, interstitial fluid, or tissue, and that scales nominally with particle size. However, assuming various tissue models, as particle size increases above the geometrical thresholds of the tissue (ie, above the pore size in a Renkin model), the tissue resistance climbs very quickly.Citation19,Citation20,Citation24 The net result is that the migration velocity increases with the square of particle diameter for an optimal range and then decreases dramatically.Citation20,Citation41,Citation63–Citation65 Variations in tissue properties also affect both the diffusion and the migration velocity parameters. Nanoparticles have more difficulty moving through dense cellular networks than through interstitial fluid;Citation19,Citation20 thus, tissue morphology effects both the diffusion and magnetic migration of the particles. Extravasation modifies how these particles move out from blood into surrounding tissue. In summary, although quantifying tissue properties of diffusion, migration, and extravasation is challenging and these parameters are often poorly known or uncertain, the mathematical model provides the ability to change them in simulations, to rapidly see the consequences, and to thus better understand how these tissue properties can affect nanoparticle distribution in tissue.
Figure S1 Simulation domain showing the larger region (left panel) that encompasses the smaller region of interest (right panel). The yellow ellipse represents the tumor.
Acknowledgments
We thank Dr Andreas Lubbe for helpful input and discussions. This study was supported by the Center for Cancer Research, National Cancer Institute, National Institutes of Health (NIH). All patients were on Institutional Review Board approval at the NIH. Drs Shapiro and Emmert-Buck are inventors on a patent application covering dynamic magnetic shift technology that was submitted jointly by the University of Maryland and NIH.Citation59
Disclosure
The authors report no conflicts of interest in this work.
References
- Cancer Facts and Figures 2010American Cancer Society2010
- PaganiOSenkusEWoodWInternational guidelines for management of metastatic breast cancer: can metastatic breast cancer be curedJNCI Journal of the National Cancer Institute2010
- JainRKMolecular regulation of vessel maturationNature Medicine20039685693
- BurkeDCarnochanPGloverCAllen-MershTGCorrelation between tumour blood flow and fluorouracil distribution in a hypovascular liver metastasis modelClin Exp Metastasis20001861762211688968
- FukumuraDJainRKTumor microenvironment abnormalities: causes, consequences, and strategies to normalizeJ Cell Biochem200710193794917171643
- GrayLHCongerADEbertMThe concentration of oxygen dissolved in tissues at the time of irradiation as a factor in radiotherapyBr J Radiol19532663864813106296
- JainRKDeterminants of tumor blood flow: a reviewCancer Res198848264126583282647
- JainRKNormalization of tumor vasculature: an emerging concept in antiangiogenic therapyScience2005307586215637262
- TozerGMKanthouCBaguleyBCDisrupting tumour blood vesselsNat Rev Cancer2005542343515928673
- RudnickSILouJShallerCCInfluence of affinity and antigen internalization on the uptake and penetration of anti-HER2 antibodies in solid tumorsCancer Res201171225021406401
- HatakeyamaHAkitaHIshidaETumor targeting of doxorubicin by anti-MT1-MMP antibody-modified PEG liposomesInt J Pharm200734219420017583453
- KirpotinDBDrummondDCShaoYAntibody targeting of long-circulating lipidic nanoparticles does not increase tumor localization but does increase internalization in animal modelsCancer Res2006666732674016818648
- IinumaHMaruyamaKOkinagaKIntracellular targeting therapy of cisplatin-encapsulated transferrin-polyethylene glycol liposome on peritoneal dissemination of gastric cancerInt J Cancer20029913013711948504
- HsuJSerranoDBhowmickTEnhanced endothelial delivery and biochemical effects of [alpha]-galactosidase by ICAM-1-targeted nano-carriers for Fabry diseaseJ Control Release201114932333121047542
- FarokhzadOCChengJTeplyBATargeted nanoparticle-aptamer bioconjugates for cancer chemotherapy in vivoProc Natl Acad Sci U S A20061036315632016606824
- Brannon-PeppasLBlanchetteJONanoparticle and targeted systems for cancer therapyAdv Drug Deliv Rev2004561649165915350294
- GuFXKarnikRWangAZTargeted nanoparticles for cancer therapyNano Today200721421
- PeerDKarpJMHongSNanocarriers as an emerging platform for cancer therapyNat Nanotechnol2007275176018654426
- FournierRLBasic Transport Phenomena in Biomedical EngineeringNew York, NYTaylor & Francis2007
- SaltzmanWMDrug Delivery: Engineering Principles for Drug TherapyNew York, NYOxford University Press2001
- NasongklaNBeyERenJMultifunctional polymeric micelles as cancer-targeted, MRI-ultrasensitive drug delivery systemsNano Lett200662427243017090068
- WinterPMCaruthersSDKassnerAMolecular imaging of angiogenesis in nascent Vx-2 rabbit tumors using a novel alpha(nu) beta3-targeted nanoparticle and 1.5 tesla magnetic resonance imagingCancer Res2003635838584314522907
- DevarajNKKeliherEJThurberGM18F labeled nanoparticles for in vivo PET-CT imagingBioconjugate Chemistry20092039740119138113
- RenkinEMFiltration, diffusion, and molecular sieving through porous cellulose membranesJ Gen Physiol19543822524313211998
- OgstonAGPrestonBNWellsJDOn the transport of compact particles through solutions of chain-polymers. Proceedings of the Royal Society of London. AMathematical and Physical Sciences1973333297
- FlennikenMLWillitsDAHarmsenALMelanoma and lymphocyte cell-specific targeting incorporated into a heat shock protein cage architectureChemistry and Biology20061316117016492564
- BatrakovaEVDorodnychTYKlinskiiEYAnthracycline antibiotics non-covalently incorporated into the block copolymer micelles: In vivo evaluation of anti-cancer activityBr J Cancer199674154515528932333
- GradisharWJTjulandinSDavidsonNPhase III trial of nanoparticle albumin-bound paclitaxel compared with polyethylated castor oil-based paclitaxel in women with breast cancerJ Clin Oncol2005237794780316172456
- WuWWieckowskiSPastorinGTargeted delivery of amphotericin B to cells by using functionalized carbon nanotubesAngewandte Chemie-International Edition20054463586362
- DecuzziPGodinBTanakaTSize and shape effects in the biodistribution of intravascularly injected particlesJ Control Release201014132032719874859
- FeronOTumor-penetrating peptides: a shift from magic bullets to magic gunsSci Transl Med2010234
- ForbesZGYellenBBBarbeeKAFriedmanGAn approach to targeted drug delivery based on uniform magnetic fieldsIEEE Transactions on Magnetics20033933723377
- KimGJNieSTargeted cancer nanotherapyMaterials Today200582833
- OriveGHernándezRMGascónARPedrazJLMicro and nano drug delivery systems in cancer therapyCancer Therapy20053131138
- ParkJHvon MaltzahnGXuMJCooperative nanomaterial system to sensitize, target, and treat tumorsProceedings of the National Academy of Sciences of the United States of America201010798198620080556
- SugaharaKNTeesaluTKarmaliPPTissue-penetrating delivery of compounds and nanoparticles into tumorsCancer Cell20091651052019962669
- TanakaTDecuzziPCristofanilliMNanotechnology for breast cancer therapyBiomedical Microdevices200911496318663578
- GriefADRichardsonGMathematical modeling of magnetically targeted drug deliveryJ Magn Magn Mater2005293455463
- GangulyRGaindAPSenSPuriIKAnalyzing ferrofluid transport for magnetic drug targetingJ Magn Magn Mater2005289331334
- VoltairasPAFotiadisDIMichalisLKHydrodynamics of magnetic drug targetingJ Biomech20023581382112021001
- NacevABeniCBrunoOShapiroBThe behaviors of ferro-magnetic nano-particles in and around blood vessels under applied magnetic fieldsJ Magn Magn Mater201132365166821278859
- KenneckeHYerushalmiRWoodsRMetastatic behavior of breast cancer subtypesJ Clin Oncol2010283271327720498394
- TerayamaNTeradaTNakanumaYAn immunohistochemical study of tumour vessels in metastatic liver cancers and the surrounding liver tissueHistopathology19962937438818692
- TerayamaNTeradaTNakanumaYHistologic growth patterns of metastatic carcinomas of the liverJapanese J Clin Oncol1996262429
- FeynmanRPLeightonRBSandsMThe Feynman Lectures on PhysicsReading, MAAddison-Wesley Publishing Company1964
- COMSOL multiphysics user’s guideBurlington, MACOMSOL AB2005
- TorchilinVPNanoparticulates as Drug CarriersLondon, UKImperial College Press, Distributed by World Scientific Pub2006
- RosensweigREFerrohydrodynamicsMineola, NYDover Publications, Inc1985
- IncroperaFPFundamentals of Heat and Mass TransferHoboken, NJJohn Wiley2007
- LubbeASBergemannCHuhntWPreclinical experiences with magnetic drug targeting: tolerance and efficacyCancer Res199656469447018840986
- LubbeASBergemannCRiessHClinical experiences with magnetic drug targeting: a phase I study with 4′-epidoxorubicin in 14 patients with advanced solid tumorsCancer Res199656468646938840985
- AlagkiozidisIFacciabeneATsiatasMTime-dependent cytotoxic drugs selectively cooperate with IL-18 for cancer chemo-immunotherapyJ Transl Med201197721609494
- HorwitzSBTaxol (paclitaxel): mechanisms of actionAnn Oncol19945S37865431
- LorussoDPietragallaAMainentiSReview role of topotecan in gynaecological cancers: current indications and perspectivesCrit Rev Oncol Hematol7416317419766512
- MiniENobiliSCaciagliBCellular pharmacology of gemcitabineAnn Oncol200617v716807468
- DuffullSBRobinsonBAClinical pharmacokinetics and dose optimisation of carboplatinClin Pharmacokinet1997331619314610
- LemkeAJvon PilsachMISLubbeAMRI after magnetic drug targeting in patients with advanced solid malignant tumorsEur Radiol2004141949195515300401
- NacevABeniCBrunoOShapiroBMagnetic nanoparticle transport within flowing blood and into surrounding tissueNanomedicine201051459146621128726
- ShapiroBEmmert-BuckMRShapiroBMethods and systems using therapeutic, diagnostic or prophylactic magnetic agents May 192008
- PantonRLIncompressible Flow2 edNew York, NYJohn Wiley & Sons, Inc1996
- YellenBBForbesZGBarbeeKAFriedmanGModel of an approach to targeted drug delivery based on uniform magnetic fieldsPaper presented at Magnetics Conference2003INTERMAG 2003IEEE International2003
- SarwarANemirovskiAShapiroBOptimal Halbach permanent magnet designs for maximally pulling and pushing nanoparticlesJ Magn Magn Mater2010 In press
- DobsonJMagnetic nanoparticles for drug deliveryDrug Dev Res2006675560
- ShapiroBTowards dynamic control of magnetic fields to focus magnetic carriers to targets deep inside the bodyJ Magn Magn Mater20093211594159920165553
- ShapiroBProbstRPottsHEDynamic control of magnetic fields to focus drug-coated nano-particles to deep tissue tumors7th International Conference on the Scientific and Clinical Applications of Magnetic CarriersVancouver, BC2008