Abstract
As the utility of magnetic resonance imaging (MRI) broadens, the importance of having specific and efficient contrast agents increases and in recent time there has been a huge development in the fields of molecular imaging and intracellular markers. Previous studies have shown that gadolinium oxide (Gd2O3) nanoparticles generate higher relaxivity than currently available Gd chelates: In addition, the Gd2O3 nanoparticles have promising properties for MRI cell tracking. The aim of the present work was to study cell labeling with Gd2O3 nanoparticles in hematopoietic cells and to improve techniques for monitoring hematopoietic stem cell migration by MRI. Particle uptake was studied in two cell lines: the hematopoietic progenitor cell line Ba/F3 and the monocytic cell line THP-1. Cells were incubated with Gd2O3 nanoparticles and it was investigated whether the transfection agent protamine sulfate increased the particle uptake. Treated cells were examined by electron microscopy and MRI, and analyzed for particle content by inductively coupled plasma sector field mass spectrometry. Results showed that particles were intracellular, however, sparsely in Ba/F3. The relaxation times were shortened with increasing particle concentration. Relaxivities, r1 and r2 at 1.5 T and 21°C, for Gd2O3 nanoparticles in different cell samples were 3.6–5.3 s−1 mM−1 and 9.6–17.2 s−1 mM−1, respectively. Protamine sulfate treatment increased the uptake in both Ba/F3 cells and THP-1 cells. However, the increased uptake did not increase the relaxation rate for THP-1 as for Ba/F3, probably due to aggregation and/or saturation effects. Viability of treated cells was not significantly decreased and thus, it was concluded that the use of Gd2O3 nanoparticles is suitable for this type of cell labeling by means of detecting and monitoring hematopoietic cells. In conclusion, Gd2O3 nanoparticles are a promising material to achieve positive intracellular MRI contrast; however, further particle development needs to be performed.
Introduction
Magnetic resonance imaging (MRI) is an important technique for medical image diagnostics. It has a unique ability to distinguish soft body tissue through endogenous contrast mechanisms. Exogenous contrast agents are frequently used in MRI for contrast enhancement and there are a variety of agents commercially available. Negative contrast is obtained by using superparamagnetic iron oxide particles. However, the most common clinically used substances, which give positive contrast enhancement, are paramagnetic chelates based on gadolinium (Gd) complexes. The Gd3+ ion, with seven unpaired f-electrons, is a preferred substance for contrast enhancement in MRI due to its paramagnetic properties. Gd chelates are, however, not very selective and have low relaxivity compared to what is theoretically possible. Citation1 In addition, when using Gd chelates as contrast agents, relatively high doses could be required due to the widespread distribution. Administration to patients with reduced renal clearance is linked to nephrogenic systemic fibrosis.Citation2–Citation4 Nephrogenic systemic fibrosis is a scleroma-like fibrotic skin disorder observed for patients with renal impairment. Deposits of collagen in tissues and skin are characteristic with skin thickening and hyperpigmentation as hallmarks. The disorder may have systemic involvement and in severe cases it can be fatal.Citation5 Therefore it is of importance that low doses of Gd are used without losing contrast effect, which drives the research of finding more efficient Gd-based agents. For this reason, Gd oxide (Gd2O3) nanoparticles have gained attention.Citation6–Citation8 In contrast to superparamagnetic iron oxide particles, Gd2O3 can easily generate positive contrast, thereby avoiding loss of signal and image voids that generally occur when using susceptibility contrast agents. Such signal loss could make it difficult to detect the contrast agent and discriminate between the agent, tissue, and image artifacts.
In addition, the field of molecular imaging using MRI in conjunction with contrast agents is increasingly improving and different cell labeling contrast agents have been developed in recent years. For such cell labeling studies, the development of positive contrast agents like Gd2O3 nanoparticles providing high signal per unit is of great interest.Citation9 MRI combined with molecular imaging will allow monitoring of specific tissues or cell types, for instance detection of stem cell migration and cellular trafficking, differentiation, and transplant rejection. Other available methods for cell visualization include genetic labels, radionuclides, or membrane dyes.Citation10,Citation11 However, MRI is among the least invasive of the currently available imaging methods. It is considered safe and would thus be preferred as a tracking method.
It is recognized that particulate agents of iron oxide, coated with dextran for example, can be internalized into a variety of cell types and labeling efficacy can be increased using different transfection agents, especially for cell types that are not naturally phagocytic.Citation12–Citation14 It has been shown earlier that THP-1 monocytes labeled with Gd2O3 nanoparticles provide positive contrast in MRI.Citation15 In the current work, the aim was to continue this research by visualizing intracellular particles with electron microscopy and to explore whether a hematopoietic progenitor cell line, Ba/F3, would take up the particles or not, and if a transfection agent could further improve uptake in the Ba/F3 cells. MRI was used to assess whether high MRI contrast could be obtained from the Gd2O3 nanoparticle-labeled cells. This study is part of a long term goal to improve the possibilities to monitor, for instance, stem cell migration with MRI by taking advantage of the positive contrast rendered by Gd2O3 nanoparticles.
Materials and methods
Gd2O3 nanoparticles
The polyol methodCitation16,Citation17 was used for synthesis of the Gd2O3 particles. GdCl3·6H2O (2 mmol) was dissolved in 10 mL diethylene glycol (DEG) by heating to 140°C. Solid sodium hydroxide (2.5 mmol) was dissolved in 10 mL DEG and subsequently added to the Gd-containing solution. The temperature was raised to 180°C and held constant for 4 hours under reflux and magnetic stirring, yielding a colloid. The solubility product or stability constant for Gd2O3 (Ksp = [Gd3+]2[OH−]6) is of the order ~10−31, as calculated from thermodynamic data, hence the oxide is unstable in water at neutral pH.Citation15 However, the solubility kinetics is quite slow.
To exclude aggregates and ions, the particle solution was filtered and dialyzed. A Vivaspin® polyethersulfone filter (Sartorius Vivascience AG, Hanover, Germany) with pore size 0.2 μm was used and filtering was performed by centrifuging the solution (1750 rpm) until all fluid had passed the filter (about 30 minutes). Then the samples were dialyzed in Milli-Q water (Millipore Corporation, Billerica, MA) using a membrane with a pore size of 1000 molecular weight cut-off. Dialysis proceeded for 24 hours and the water was changed three times. The sample-to-volume ratio in the dialysis procedure was at least 1:1000.
Particles were characterized through high-resolution transmission electron microscopy using a Tecnai™ G2 electron microscope (FEI Company, Hillsboro, OR) operated at 200 kV. X-ray photoelectron spectroscopy studies were performed using a Microlab 310F (Thermo VG Scientific, West Sussex, United Kingdom) with a hemispheric analyzer and unmonochromatized aluminum Kα photons (1486.6 eV). The pressure in the analysis chamber was approximately 2 × 10⁻⁸ mbar and the resolution was determined from the full-width half-maximum of the gold (4f7/2) line, which was about 2 eV with pass energy 50 eV. Sample preparations for transmission electron microscopy and X-ray photoelectron spectroscopy are described in Klasson et al.Citation15
Cell culturing and labeling
A hematopoietic progenitor cell line, Ba/F3, was used in this study and compared to a monocytic cell line, THP-1. Ba/F3 is a murine pro B-cell line established from mouse fetal liver.Citation18 The cell line grows in suspension (Roswell Park Memorial Institute 1640 medium with 10% fetal bovine serum, 2 mM L-glutamine, 25 mM HEPES, 50 μM 2-mercaptoethanol, 1% penicillin-streptomycin and 5% interleukin-3 [Sigma-Aldrich, St Louis, MO] and is kept in a cell culture flask at 37°C in 5% carbon dioxide atmosphere. As for the THP-1 cells, they are human monocytic cells derived from a 1-year-old boy with acute monocytic leukemia. Citation19 They are phagocytic and grow in suspension (Roswell Park Memorial Institute 1640 medium with 10% fetal bovine serum, 2 mM L-glutamine, 1% penicillin-streptomycin) with the same atmospheric conditions as for Ba/F3.
Experiments were conducted as follows; cells were transferred to 24-well culturing plates and each sample contained one million cells in 1 mL of cell culture medium. Cells were exposed to Gd2O3 nanoparticles in two different concentrations (0.5 mM and 2 mM). Prior to the particle addition, half of the different cell samples were also treated with 10 μg/mL protamine sulfate (Sigma-Aldrich Corporation, St Louis, MO) to investigate whether this could increase the particle uptake in especially the Ba/F3 cells. The samples were then incubated at 37°C in 5% carbon dioxide. THP-1 cells were incubated for 2 hours, which in previous studies was sufficient for particle uptake.Citation15 Pilot studies showed that doubling the incubation time to 4 hours did not significantly increase the uptake. Ba/F3 cells are not naturally phagocytic and therefore a longer incubation time of 24 hours was used for these cells.Citation20 After incubation, the samples were transferred into Falcon tubes (BD Biosciences, Franklin Lakes, NJ) and washed twice with cell culture medium (centrifuged for 8 minutes at 1050 rpm). For T1 and T2 determination, cell pellets were resuspended in 0.5 mL medium. Gelatin (0.5 mL, 2%) was added to each sample and then the samples were left to harden before MRI measurements.
Since both DEG and Gd can be toxic,Citation21 viability of Gd2O3 incubated Ba/F3 cells were monitored to ensure that cells were viable prior to MRI measurements. For this, the cells were stained with trypan blue and counted in a Bürker chamber (Sigma-Aldrich, St Louis, MO) directly after 24 hours, 48 hours, and 72 hours of incubation. THP-1 cells have previously been shown to tolerate treatment with these particles for an extended period of time.Citation15
Electron microscopy was performed to visualize intracellular Gd2O3 nanoparticles. Incubated cells were washed in cell culture medium and cell pellets were fixed in 2% glutaraldehyde with 0.1 M sodium cacodylate and 0.1 M sucrose, pH 7.2. After fixation, cells were rinsed in 0.15 M sodium cacodylate buffer and postfixed in 1% osmium tetroxide in 0.15 M sodium cacodylate buffer for 2 hours. After another rinse in sodium cacodylate buffer, the samples were dehydrated in 50% ethanol twice for 5 minutes and then contrasted with 2% uranyl acetate in 50% ethanol over night. Continuing dehydration steps was 70%, 85%, and 95% ethanol for 5 minutes each and 100% ethanol for 10 minutes. Embedding was then performed in 100% ethanol and Epon 812 (Shell Chemical LP, Houston, TX) for 30 minutes and then in pure Epon 812 for 2 hours, then polymerized in 60°C for 48 hours. Ultrathin sections (60 nm) were cut with a diamond knife (DiATOME, Bienne, Switzerland) on a Reichert-Jung Ultracut E (Leica Microsystems, Wetzlar, Germany) and collected on copper grids. Sections were stained with uranyl acetate and lead citrate and examined in a JEM 1230 electron microscope (JEOL Ltd, Tokyo, Japan) at 100 kV. Photos were taken with a SC1000 ORIUS™ CCD camera using DigitalMicrograph ™ software (Gatan, Inc, Pleasanton, CA).
The cell samples were analyzed by inductively coupled plasma sector field mass spectrometry (ICP-SFMS; ALS Scandinavia AB, Luleå, Sweden) to quantify the concentration of Gd in each sample after incubation and washing. From these results uptake percentages were calculated.
MRI
The relaxation time measurements were performed with an Achieva 1.5T A-series (Philips, Amsterdam, Netherlands) MRI scanner using a head coil. The longitudinal T1 relaxation times were measured with inversion recovery sequences with turbo spin echo acquisition (turbo spin echo factor 9). Echo time was 29 milliseconds, repetition time was 10 seconds, and inversion recovery delay times were 125, 300, 500, 1000, 2000, and 5000 milliseconds. The field of view was 200 mm and slice thickness 5 mm. The transverse T2 relaxation times were measured with a multiecho spin echo sequence with 16 echoes at multiples of 20 milliseconds, repetition time was 1000 milliseconds. Field of view was 200 mm and slice thickness was 5 mm.
Relaxation time measurements were performed by placing Falcon test tubes containing the samples in a holder immersed in a bowl of water at 21°C ± 1°C. For data presented in the present work, two experimental sessions were performed. At each session, relaxation times in two cell types (Ba/F3 and THP-1) incubated with Gd2O3 nanoparticles with low (0.5 mM) and high (2 mM) Gd concentration respectively treated and not treated with protamine sulfate were measured. This resulted in eight measurements per session. As a reference, five Gd-diethylene triamine pentacetic acid (Magnevist®; Bayer Schering Pharma AG, Berlin, Germany) samples all containing 0.1 mM Gd in water were spread out in different places in the tube holder to ensure that the measurements were stable throughout the coil.
A monoexponential least-squares fit was performed on the data to retrieve T1 and T2. The fit was implemented in an in-house developed Interactive Data Language program (Exelis Visual Information Solutions, Boulder, CO). Statistical analysis was obtained from GraphPad Prism® version 4 (GraphPad Software, San Diego, CA).
Results
Particle characterization
Gd2O3 nanoparticle samples synthesized through the polyol method consist (as synthesized) of different sized particles as well as a large fraction of Gd ions. Dialysis was performed to remove the ion content and thereby an ion-free nanoparticle solution was obtained. The Gd content after 24 hours of dialysis decreased from an initial concentration of 100 mM to about 10 mM, consistent with previously published data regarding dialysis.Citation9
To obtain information about the elemental composition of the particles, X-ray photoelectron spectroscopy measurements were performed. Results of dialyzed nanoparticle samples show a pure nanomaterial with reduced amount of hydrocarbon/DEG compared with nondialyzed material. For further details, see earlier published data.Citation6,Citation8,Citation15 Gd2O3-DEG particles have earlier been characterized by transmission electron microscopy showing crystalline particles with an average size of about 2–5 nm.Citation9,Citation16 In this work, crystalline particles in the same size range were obtained.
Cell viability
The viability of Ba/F3 cells was approximately 77% before incubation with Gd2O3 nanoparticles. The corresponding value for THP-1 cells was approximately 90% before treatment with particles. In a previous study,Citation15 viability results for THP-1 cells were reported; this is therefore not further addressed in this work.
After 24 hours of incubation with Gd2O3 particles at 2 mM Gd concentration, the viability of Ba/F3 cells had decreased slightly (), but not significantly. Samples were also investigated with or without protamine sulfate added, but there was no difference between these samples. After 48 hours and 72 hours of incubation the viability was principally retained. After 72 hours the viability of the sample incubated with Gd2O3 nanoparticles without protamine sulfate had decreased to 68%. However, this apparent decrease was within the standard deviation of the measurement error.
Table 1 Ba/F3 cells incubated in 2 mM gadolinium compared to nontreated cells
Visualization of intracellular particles
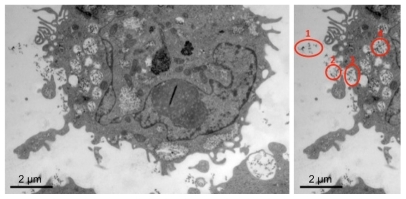
Electron microscopy images of Gd2O3 incubated cells show that THP-1 cells had a large cytoplasm and cellular parts near the cell surface indicating that they stretched out in phagocytic activity (). In addition, particle containing vesicles were visible.
Figure 1 Representative image of THP-1 cell treated with 2.0 mM gadolinium shows several vacuoles containing gadolinium oxide nanoparticles and invaginations at the cell surface indicating phagocytic processes (left panel). Illustration of the phagocytic process: (1) nanoparticles in the extracellular fluid, (2) nanoparticles approaching the cell surface, (3) nanoparticles at the cell surface, and (4) nanoparticles internalized in cell vacuole (right panel).
Ba/F3 cells consisted of a dominating nucleus. It is shown from the extracts in that Gd2O3 nanoparticles resided in vacuoles inside the cells as well as outside the cell membrane in some cases. The overall results from electron microscopy images suggest that THP-1 cells contain more particles in vacuoles than Ba/F3. It is shown that Ba/F3 bound particles to the cell surface () and in a few cases the cells had aggregated and particles were trapped in between the cells. The ability to attract particles near the cell membrane is, however, a prerequisite for cell internalization. Visual examination of the different cell samples showed more particles in protamine sulfate-treated cells. This result was also supported by the Gd content analysis by inductively coupled plasma sector field mass spectrometry.
Figure 2 Representative electron microscopy images of cells: THP-1 in (A) and (B); Ba/F3 in (C) and (D). (A) and (C) show gadolinium oxide incubated cells (treated with protamine sulfate and 2.0 mM gadolinium). Gadolinium oxide nanoparticles are visible inside vacuoles of the cell. Images (B) and (D) show control cells not treated at all. These cells do not have as many vacuoles indicating that they were not phagocytically active.
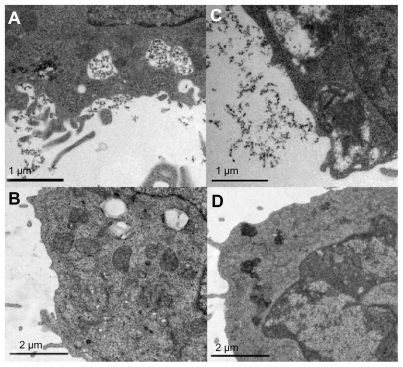
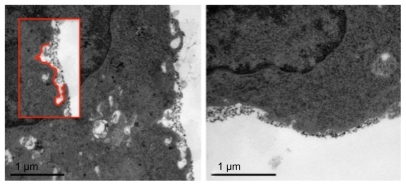
Figure 3 Ba/F3 cells with gadolinium oxide nanoparticles on cell surface. Small endocytic invaginations (see inset) indicate a possible internalization process.
The analysis of Gd concentration showed a mean uptake percentage of 2% in Ba/F3 cells treated with protamine sulfate. In nontreated Ba/F3 cells, the mean uptake percentage was 1% for the low concentration and 2% for the high concentration. THP-1 had higher uptake: 5% in protamine sulfate-treated cells and 3% and 4% in nontreated cells for the low and high incubation concentration, respectively. show representative parts of control cells containing no particles. In these samples there were not as many vacuoles/endosomes present indicating that the cells were not phagocytically activated.
MRI
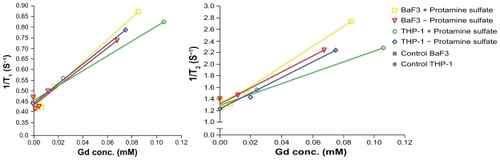
Samples incubated with Gd2O3 nanoparticles in higher Gd concentration contained higher amount of Gd and had higher relaxation rates (). The trend was similar for both cell types. THP-1 cells treated with protamine sulfate and incubated in the higher Gd concentration had decreased relaxation rates at high Gd content (0.11 mM) compared to the expected value from the overall relaxivity trends (). In addition, relaxivity for protamine sulfate-treated THP-1 cells seemed to be lower (r1 = 3.6 s−1 mM−1, r2 = 9.6 s−1 mM−1) compared to the relaxivity for the other samples (r1 ≥ 4.5 s−1 mM−1, r2 ≥ 13.4 s−1 mM−1). However, r1 from the different samples were not significantly different (P = 0.08, pooled relaxivity across samples = 4.4 s−1 mM−1), whereas r2 of the treated THP-1 cells were different from the other samples (P = 0.005). The ratio r2/r1 was approximately three for all cell samples.
Table 2 Relaxivity values r1 and r2 (s−1 mM−1) at 1.5 T and 21°C for Ba/F3 and THP-1 cell samples incubated with gadolinium oxide nanoparticles with or without protamine sulfate treatment
Figure 4 Relaxation of gadolinium oxide nanoparticles in THP-1 and Ba/F3 cells. Samples were either treated with protamine sulfate or not and the cells were incubated with gadolinium oxide nanoparticles in two different gadolinium concentrations for each sample (0.5 mM or 2.0 mM).
Abbreviations: conc, concentration; Gd, gadolinium.
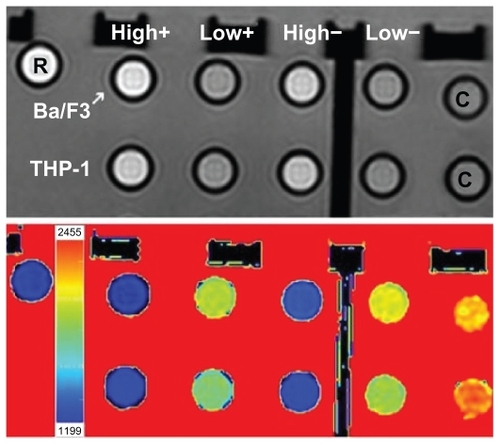
When observing signal intensity in the top panel of (repetition time was 1000 milliseconds, echo time was 20 milliseconds), samples incubated with Gd2O3 nanoparticles in higher Gd concentration can be seen to appear brighter. This supports the notion that high signal intensity can be obtained with intracellular Gd2O3 nanoparticles. Samples incubated in 2 mM Gd with an uptake of 0.07– 0.11 mM were, with these parameters, comparable in intensity to 0.1 mM Gd-diethylene triamine pentacetic acid in water. In addition, the T1 image (, bottom panel) shows approximately the same relaxation times for samples incubated in Gd2O3 nanoparticles at 2 mM Gd and the Gd-diethylene triamine pentacetic acid samples, whereas relaxation times of nanoparticle samples incubated with 0.5 mM Gd were close to the values of cell control samples.
Figure 5 Upper panel shows signal intensity of incubated cell samples (repetition time = 1000 milliseconds, echo time = 20 milliseconds). The first row is Ba/F3 and the second row is THP-1. Columns labeled “high” are treated with 2.0 mM gadolinium and “low” with 0.5 mM gadolinium. Columns labeled with “+” are protamine sulfate treated and with “−” are not treated with protamine sulfate. The rightmost samples (labeled C) are cell control samples with no particles. Sample labeled R is Gd-diethylene triamine pentacetic acid reference (0.1 mM gadolinium in water). Bottom panel shows corresponding T1 map, which shows different colors corresponding to different T1 times.
Discussion
Viability and solubility uptake
Results of the Ba/F3 viability study showed that the cells were viable after incubation with Gd2O3 nanoparticles and remained intact at the time for MRI measurement, which is essential for this work. Although the cells, especially Ba/F3, only partly took up the particles, they still were exposed to the Gd extracellularly, as the nanoparticles were not washed away during these observations. Taking this into account, the viability was not significantly reduced and this preserved good viability is confirmed by Faucher et al.Citation22 It is very promising that Ba/F3 cells withstand the Gd and DEG exposure to the same extent as THP-1 (previously studied in Klasson et al.Citation15 However, toxicology investigations of the Gd2O3 nanoparticles need more thorough viability studies and long term biological effects need to be evaluated. In addition, it has to be remembered that before considering in vivo studies of the particles used as a regular contrast agent, other cappings have to be considered, hence gaining a stable, tolerable contrast agent.
As expected, Gd2O3 nanoparticles were shown to be intracellularly located in THP-1 cells as well as in Ba/F3 cells. In the microscopy images, protamine sulfate effect on both Ba/F3 and THP-1 cells was observed, however not to any great extent. Higher particle content was observed in vacuoles in protamine sulfate-treated Ba/F3 compared to untreated Ba/F3 cells. THP-1 cells had high particle uptake in both protamine sulfate-treated as well as untreated cells. Because THP-1 is a naturally phagocytic cell type, this cell line is not dependent on a transfection agent for uptake. It should also be taken into account that THP-1 cells were only incubated for 2 hours, which is believed to be sufficient at regular conditions. It could, however, be beneficial to exceed that incubation time allowing the cells to interact with the transfection agent and particle solution for a longer period of time.
As previously mentioned, lower uptake was observed in endosomes and vacuoles in Ba/F3 cells than in THP-1 cells. In the electron microscopy images, extracellular Gd2O3 nanoparticles were noted near the cell membrane () and particles stuck in between cells. It is therefore probable that some of the measured Gd was not intracellular, but attached to the cell surface or located in between aggregated cell complexes. Another theory is that some of the intracellular particles could be located in the cytosol of the cells and therefore not clearly visible in the electron microscopy images.
In Ba/F3 cells, the low uptake was expected since these cells are not naturally phagocytic. However, lower uptake in THP-1 cells was observed in this work compared to a previous study,Citation15 which indicates that higher uptake, than seen in this work, is possible. According to the literature, the particle uptake in cells varies also at approximately similar experimental conditions.Citation15,Citation20,Citation23,Citation24 It is therefore concluded that different uptake might depend on the natural and biological difference in the cells in addition to different labeling methods and incubation times. To increase the internalization of particles, in particular Gd2O3 nanoparticles, other transfection agents, other incubation times, and higher incubation concentrations as well as surface modification of the particles can be considered. Dextran coating could for instance be an option, especially since dextran-coated superparamagnetic iron oxide particles show high cellular labeling efficacy.Citation25 In addition, these particles are larger than the Gd2O3 nanoparticles and the particle size can be the crucial parameter. Larger particles might interact easier with the cells and would be ingested faster. Also, the efficiency of membrane wrapping processes partly depends on particle size. Previous studies have observed that nanoparticles between 25–50 nm in diameters were internalized most efficiently.Citation26 This implies that it could be beneficial to increase the size of the Gd2O3 nanoparticles to make them more efficient for intracellular labeling. However, magnetic and relaxation properties might not be favored if particle size is increased.
MRI
There was no difference in r1 relaxivity between the different cell samples treated with Gd2O3 nanoparticles, but for THP-1 cells, a lower r2 relaxivity was observed for protamine sulfate-treated cells. However, more samples might be needed to ensure these results. In addition, protamine sulfate-treated cells might take up more particles concentrated to fewer vacuoles/endosomes, whereas in protamine sulfate-untreated cells the uptake might be spread in more and smaller vacuoles, which could affect the relaxivity.
Gd2O3 nanoparticles in this work shortened the relaxation times with higher intracellular concentration. This is visualized in , where samples with higher concentration have higher signal intensity (top panel), and lower T1 values (bottom panel). In contrast, the sample with THP-1 cells that had internalized the highest Gd concentration (the rightmost sample in ) had a lower relaxation rate compared to what was expected from the general trend. This result is interpreted as emanating from aggregation and/or saturation in the cells. Aggregated particles lower the relaxation rate due to a decreased surface-to-bulk ratio. Since Gd in the particle cores does not directly contribute to the relaxation effect, a decreased surface-to-bulk ratio will lead to fewer Gd ions at the surface that could interact with intracellular protons. Decreased relaxation rate could also be an effect of vacuoles that are filled to saturation with particles. Saturated vacuoles act like macroparticles and the beneficial relaxation properties of nanoparticles are lost. However, according to Faucher et al,Citation27 Gd2O3 aggregated nanoparticles could still act as an efficient “positive-T1” contrast agent at 1–3 T magnetic fields.
Conclusion
From the microscopy study of THP-1 and Ba/F3 cells incubated with Gd2O3 nanoparticles, vacuoles with visible particles were observed. Uptake in both Ba/F3 cells and THP-1 cells was increased by the transfection agent protamine sulfate. The MRI study showed that the relaxation times were shortened with increasing particle concentration and Gd2O3 nanoparticles are promising as a positive intracellular MRI contrast agent. For further studies on cell labeling, the particles need to be improved regarding capping stabilizing the particles from degradation as well as from aggregation. In addition, cell internalization, especially in cells not normally phagocytic, needs to be enhanced by modifying transfection methods and agents or optimizing incubation time. With these improvements it is possible to obtain an intracellular contrast agent generating positive contrast that could be used in pure stem cells and could contribute to the monitoring of stem cell migration.
Acknowledgments
We thank Bengt-Arne Fredriksson (Core Facility, Health Faculty, Linköping University) for help with electron microscopy images of cells. Ann-Charlotte Bergh, Pia Druid, and Anders Rosén (Department of Clinical and Experimental Medicine, Health Faculty, Linköping University) are acknowledged for housing cell cultures and assistance in the laboratories.
Swedish Research Council (621-2007-3810, 621-2009-5148 and 521-2009-3423) is acknowledged for funding as well as VINNOVA (2009-00194) and the Center in Nanoscience and Technology at LiTH (CeNano) (2009–2010).
Disclosure
The authors report no conflicts of interest in this work.
References
- RaymondKNPierreVCNext generation, high relaxivity gadolinium MRI agentsBioconjug Chem20051613815656568
- RofskyNMSherryADLenkinskiRENephrogenic systemic fibrosis: a chemical perspectiveRadiology2008247360861218487530
- PrinceMRZhangHLRoditiGHLeinerTKucharczykWRisk factors for NSF: a literature reviewJ Magn Reson Imaging20093061298130819937930
- AimeSCaravanPBiodistribution of gadolinium-based contrast agents, including gadolinium depositionJ Magn Reson Imaging20093061259126719938038
- WertmanRAltunAMartinDRRisk of nephrogenic systemic fibrosis: evaluation of gadolinium chelate contrast agents at four American universitiesRadiology2008248379980618632533
- AhrénMSelegårdLKlassonASynthesis and characterization of PEGylated Gd2O3 nanoparticles for MRI contrast enhancementLangmuir20102685753576220334417
- BridotJLFaureACLaurentSHybrid gadolinium oxide nanoparticles: multimodal contrast agents for in vivo imagingJ Am Chem Soc2007129165076508417397154
- EngströmMKlassonAPedersenHVahlbergCKällPOUvdalKHigh proton relaxivity for gadolinium oxide nanoparticlesMAGMA200619418018616909260
- FortinMAPetoralRMJrSöderlindFPolyethylene glycol-covered ultra-small Gd2O3 nanoparticles for positive contrast at 1.5T magnetic resonance clinical scanningNanotechnology20071839395501
- WeisslederRChengHCBogdanovaABogdanovAJrMagnetically labeled cells can be detected by MR imagingJ Magn Reson Imaging1997712582639039625
- BondeJHessDANoltaJARecent advances in hematopoietic stem cell biologyCurr Opin Hematol200411639239815548993
- JanicBIskanderASRadAMSoltanian-ZadehHArbabASEffects of ferumoxides-protamine sulfate labeling on immunomodulatory characteristics of macrophage-like THP-1 cellsPLoS One200836e249918575575
- KüstermannEHimmelreichUKandalKEfficient stem cell labeling for MRI studiesContrast Media Mol Imaging200831273718335477
- RadAMArbabASIskanderASJiangQSoltanian-ZadehHQuantification of superparamagnetic iron oxide (SPIO)-labeled cells using MRIJ Magn Reson Imaging200726236637417623892
- KlassonAAhrénMHellqvistEPositive MRI contrast enhancement in THP-1 cells with Gd2O3 nanoparticlesContrast Media Mol Imaging20083310611118546094
- BazziRFlores-GonzalezMALouisCSynthesis and luminescent properties of sub-5-nm lanthanide oxide nanoparticlesJ Lumin2003102–103445450
- SöderlindFPedersenHPetoralRMJrKällPOUvdalKSynthesis and characterization of Gd2O3 nanocrystals functionalized by organic acidsJ Colloid Interface Sci2005288114014815927572
- PalaciosRHensonGSteinmetzMMcKearnJPInterleukin-3 supports growth of mouse pre-B-cell clones in vitroNature198430959641261316201749
- TsuchiyaSYamabeMYamaguchiYKobayashiYKonnoTTadaKEstablishment and characterization of a human acute monocytic leukemia cell line (THP-1 cells)Int J Cancer19802621711766970727
- Daldrup-LinkHERudeliusMOostendorpRATargeting of hematopoietic progenitor cells with MR contrast agentsRadiology2003228376076712881578
- PałaszACzekajPToxicological and cytophysiological aspects of lanthanide actionsActa Biochim Pol20004741107111411996100
- FaucherLGuay-BéginAALagueuxJCôtéMFPetitclercEFortinMAUltra-small gadolinium oxide nanoparticles to image brain cancer cells in vivo with MRIContrast Media Mol Imaging20116420921821861281
- WilhelmCGazeauFRogerJPonsJNBacriJCInteraction of anionic superparamagnetic nanoparticles with cells: kinetic analyses of membrane adsorption and subsequent internalizationLangmuir2002182181488155
- MaxwellDJBondeJHessDAFluorophore conjugated iron oxide nanoparticle labeling and analysis of engrafting human hematopoietic stem cellsStem Cells200826251752418055451
- MatuszewskiLPersigehlTWallACell tagging with clinically approved iron oxides: feasibility and effect of lipofection, particle size, and surface coating on labeling efficiencyRadiology2005235115516115749976
- VanceDMartinJPatkeSKaneRSThe design of polyvalent scaffolds for targeted deliveryAdv Drug Deliv Rev2009611193193919596034
- FaucherLGossuinYHocqAFortinMAImpact of agglomeration on the relaxometric properties of paramagnetic ultra-small gadolinium oxide nanoparticlesNanotechnology2011222929510321693804