Abstract
Background
The focus of this study is on the antibacterial properties of silver nanoparticles embedded within a zeolite membrane (AgNP-ZM).
Methods and Results
These membranes were effective in killing Escherichia coli and were bacteriostatic against methicillin-resistant Staphylococcus aureus. E. coli suspended in Luria Bertani (LB) broth and isolated from physical contact with the membrane were also killed. Elemental analysis indicated slow release of Ag+ from the AgNP-ZM into the LB broth. The E. coli killing efficiency of AgNP-ZM was found to decrease with repeated use, and this was correlated with decreased release of silver ions with each use of the support. Gene expression microarrays revealed upregulation of several antioxidant genes as well as genes coding for metal transport, metal reduction, and ATPase pumps in response to silver ions released from AgNP-ZM. Gene expression of iron transporters was reduced, and increased expression of ferrochelatase was observed. In addition, upregulation of multiple antibiotic resistance genes was demonstrated. The expression levels of multicopper oxidase, glutaredoxin, and thioredoxin decreased with each support use, reflecting the lower amounts of Ag+ released from the membrane. The antibacterial mechanism of AgNP-ZM is proposed to be related to the exhaustion of antioxidant capacity.
Conclusion
These results indicate that AgNP-ZM provide a novel matrix for gradual release of Ag+.
Introduction
Given that we are in an era where antibiotic resistance is a growing concern, there is a renewed interest in developing products containing silver for use as antimicrobials. For thousands of years, silver has been used for food and beverage preservation, and in medicines.Citation1 The use of silver as an antibacterial agent declined with the discovery of antibiotics, but the evolution of antibiotic-resistant pathogens has brought a revival in silver-based applications. Silver is now an additive in consumer products including bandages, socks, shirts, water filters, antiperspirants, combs, paints, and washing machines.Citation2
The antibacterial mechanism of silver nanoparticles (AgNP) and Ag+ has been explored extensively. Baker et alCitation3 found that complete bacterial cell death could be achieved at 8 μg/cm2 AgNP and that smaller particles were more efficient antibacterials. Others have supported this finding, and found that the amount of chemisorbed Ag+ and aggregation status of AgNP influences antibacterial efficacy.Citation4 The formation of reactive oxygen species has been implicated in bacterial toxicity,Citation5 and these are thought to damage DNA and proteins, as well as perturb cell membrane integrity.Citation6
However, there is growing concern surrounding the increasing use of AgNP and their impact of the environment. The spread of AgNP into wastewater is an environmental concern, in that researchers have found that the numbers of nitrifying bacteria found in sludge are reduced when exposed to large quantities of AgNP,Citation7 which has severe implications on waste water treatment.
This motivated us to develop a method to immobilize AgNP into lithographically patterned zeolite membranes, and we have already reported that such membranes are effective in killing Escherichia coli upon contact.Citation8 Other research in this area has focused on Ag+-zeolite powders as antibacterial agents. Ag+ ions are ion-exchanged out of the zeolite powder into media and are sufficient to cause bacterial cell death in both E coli and Staphylococcus aureus.Citation9,Citation10 In the case of Ag+-zeolite, the release of Ag+ into solution is primarily determined by the ionic strength of the medium, because this is an ion-exchange process and is media-dependent. Recently, there has also been a report of AgNP in zeolite powders and their activity towards Gram-positive and Gram-negative bacteria.Citation11
In this study, we investigated the antibacterial capacity of AgNP embedded in zeolite membranes (AgNP-ZM) and found that their bactericidal properties stem from the gradual release of Ag+ into the media. From a materials perspective, zeolite membranes are more attractive as supports than powders, since macroscopic membranes can be grown on ceramics, metals, and polymeric and cellulose supports,Citation12 thus allowing for diverse applications, including use in the hospital setting. The mechanism of E. coli death was investigated using viability assays, gene expression arrays, and quantitative reverse transcriptase polymerase chain reaction (PCR). The biological studies suggest that exhaustion of antioxidant capacity is related to antibacterial function.
Materials and methods
Materials
Silver nitrate (99%), potassium nitrate, trypan blue, polyethylene glycol, Ludox SM-30, poly(methyl methacrylate), and hydrazine were purchased from Sigma Aldrich (St. Louis, MO). PEG-600 (Fluka, Buchs, Switzerland), Darvan (RT Vanderbilt Co Inc, Norwalk, CT), aluminum hydroxide (Alfa Aesar Ward Hill, MA, 80.5%), sodium hydroxide (Mallinckrodt Hazelwood, MO, 98.8%), 25 wt% tetramethyl ammonium hydroxide aqueous solution (Sachem, Austin, TX), AKP30 high-purity alumina powder (Sumitomo Chemical Co Ltd, Tokyo, Japan), with an average particle size of 300 nm, silastic T-2 polydimethylsiloxane (Dow Corning, Midland, MI), 200 proof ethyl alcohol (Pharmco, Brookfiled, CT), and 1-octanol (Puriss, Fluka, Buchs, Switzerland) were also purchased and used without further purification. Luria Bertani (LB) broth powder agar, brain heart-infusion broth, 100 mm sterile Petri dishes, and chloroform were obtained from Fisher Scientific (Pittsburgh, USA) and 0.4 μm pore transwell plates and six-well plates were obtained from Corning (Lowell, MA). Qiagen (Valencia, CA) supplied the Puregene DNA purification kit, the RNeasy RNA isolation kit, DNase, and QuantiTect SYBR Green reverse transcriptase PCR kit. Primers were purchased from Integrated DNA Technologies (San Diego, CA). The E. coli strain, XL-1 blue, which was derived from the K-12 strain, was a kind gift from Dr Joanne Trgovcich (Department of Surgery, The Ohio State University Medical Center). Bioanalyzer Lab-On-A-Chip Agilent 6000 Series II chips and E. Coli 8x15K Microarrays were purchased from Agilent (Santa Clara, CA).
Synthesis of AgNP-ZM
Macroporous alumina oxide supports were used as the substrate for zeolite membrane growth, and their preparation is described in detail in earlier studies.Citation13 Briefly, nanometer-sized zeolites are deposited on the alumina support and grown into a continuous membrane by hydrothermal synthesis. The zeolite membranes were then ion-exchanged with 0.005 M AgNOCitation3 solution, washed, and then reduced by hydrazine, as described earlier.Citation8 After washing, the AgNP-ZM were extensively ion-exchanged with 1 M NaCl to remove unreacted silver ions from the zeolite. A schematic of AgNP-ZM fabrication is provided in .
Chemical characterization of AgNP-ZM
Supernatants were collected from AgNP-ZM suspended in LB broth for various times and used for elemental analysis. Similar experiments were done with AgNP-ZM that were repeatedly exposed to LB broth. Silver content was measured using inductively coupled plasma optical emission spectroscopy at Galbraith Laboratories, Knoxville, TN.
Biological characterization
Cultures of XL-1 blue E. coli were incubated with the AgNP-ZM or zeolite membrane controls and assessed for viability using traditional colony counts. LB broth solution was prepared using a concentration of 25 g/L of LB. LB agar plates were prepared with 1.5% agar. Individual clones were inoculated in 3 mL of LB broth and shaken at 225 rpm overnight at 37°C. Prior to exposing bacteria to the zeolite membranes, bacterial cultures were adjusted to obtain an initial optical density between 0.2 and 0.8, with viable colony counts ranging between about 1 × 10⁵ and 1 × 10⁸ colony-forming units (cfu)/mL. For the initial viability experiment, one zeolite membrane and one freshly prepared AgNP-ZM were tested three times. Membranes were placed into six-well tissue culture plates and 5 mL (approximately 1 × 10⁶ cells/mL) of bacterial suspension was added to each well. Experimental plates were then incubated at 37°C and continuously shaken. For each experiment, samples were removed at 0, 30, 60, 120, and 180 minutes, where 100 μL was taken from wells containing zeolite controls or AgNP-ZM and added to a tube containing 0.9 mL of LB broth. Samples were further diluted in LB broth by 10-fold six more times. To obtain colony counts, 100 μL of samples were plated from each dilution. LB plates were incubated at 37°C overnight and cfu were counted to determine bacteria viability. Optical densities of culture supernatants were measured after exposure to two separate AgNP-ZM for 60, 120, or 180 minutes using a Shimadzu spectrophotometer at an absorbance wavelength of 600 nm.
We also tested the preliminary antibacterial activity of AgNP-ZM against a methicillin-resistant strain of S. aureus (MRSA, a kind gift from Dr Vijay Pancholi, Department of Pathology, The Ohio State University). Here, a clone of MRSA was grown overnight in brain-heart infusion broth. A fresh stock was inoculated into brain heart-infusion broth from the overnight culture and grown at 37°C under continuous shaking until the optical density reached 0.3. Bacterial cultures (5 mL in brain heart-infusion broth, about 5 × 10⁷ cell/mL) were then exposed to zeolite membranes or AgNP-ZM for up to 180 minutes. Samples were taken and serially diluted as described above. Samples from each dilution (100 μL) were streaked onto brain heart-infusion agar and incubated for 24 hours at 37°C prior to counting. Zeolite membranes were reused after decontamination by steam autoclave or with 70% ethanol for 20 minutes prior to air drying.
To determine if the antibacterial action of AgNP-ZM is contact-dependent, two approaches were taken. We first exposed two AgNP-ZM and one zeolite membrane control to 5 mL of LB broth for three hours. E. coli (at a concentration of approximately 1 × 10⁵ cells/mL in 5 mL of LB broth) was pelleted by centrifugation (3250 × g) for 15 minutes. The supernatants were discarded and the bacteria were resuspended in supernatants that had been exposed to the membranes. Samples were incubated at 37°C and 100 μL samples were taken at 30, 60, and 120 minutes. Colony counts were performed in the same manner as stated above, where a series of 10-fold dilutions were prepared, and 100 μL from each dilution was plated on LB agar. Plates were incubated for 24 hours at 37°C prior to counting.
To test further whether the antibacterial action of AgNP-ZM is contact-dependent, two AgNP-ZM and one zeolite membrane control were each placed in separate wells of six-well transwell plates with a membrane pore size of 0.4 μm. The membranes did not touch the bottom surface of the transwells. E. coli (approximately 1 × 10⁵ cells/mL in 5 mL LB broth) was applied to the apical chamber of the transwell plates. Plates were continuously shaken and incubated at 37°C. From the apical and basal chambers, 100 μL samples were taken after 30, 60, and 120 minutes, diluted using the serial dilution scheme described above, plated, and incubated overnight at 37°C.
The efficacy of AgNP-ZM was tested by exposing the same AgNP-ZM to approximately 1 × 10⁶ cells/mL of E. coli in 5 mL of LB broth a total of six times. LB broth samples (100 μL) were collected at 30, 60, and 120 minutes during each of the six experimental exposures. Colony counts were performed in the same manner stated earlier in the Materials and Methods section, where a series of 10-fold dilutions were prepared from the samples, and 100 μL from each dilution was plated on LB agar. Plates were incubated for 24 hours at 37°C prior to counting. In between each use, the AgNP-ZM were sterilized by steam autoclave, much like surgical instruments found in a hospital setting.
DNA and RNA extraction
E. coli genomic DNA was isolated using a Puregene DNA purification kit according to the manufacturer’s instructions. Bacterial RNA was extracted using standard procedures from E. coli exposed to zeolite membranes or exposed to AgNP-ZM for 30–45 minutes (see Supplemental Methods). The quality of RNA was examined using an Agilent 2100 Bioanalyzer Lab-On-A-Chip Agilent 6000 Series II chip. RNA samples were checked for DNA contamination by running PCR using samples with primers with or without reverse transcriptase. The presence of PCR products was determined by gel electrophoresis using 1% agarose gel.
Gene expression microarrays
Four individual zeolite supports containing AgNPs and four zeolite support controls were exposed to approximately 1 × 10⁸ cfu/mL of bacteria for 30 minutes prior to RNA isolation, and bacterial viability was determined via colony counts (). RNA samples were stored at −80°C until processing. Sample labeling and hybridizations were performed by the Nationwide Children’s Hospital’s Biomedical Genomics Facility (http://genomics.nchresearch.org/index.html). The RNA was of high quality and all samples passed the standard quality control cutoff. Sample labeling and hybridization was performed according to the manufacturer’s protocols. Samples were hybridized to the E. coli 8 × 15 K Microarray (AMADID 020097). Parameters regarding gene array methodology, quality control, and statistical analyses are included in the Supplemental Materials section.
Quantitative reverse transcriptase PCR
E. coli at a concentration of 1 × 10⁸ cfu/mL were exposed to zeolite membranes alone or containing AgNPs for 45 minutes prior to RNA isolation. Quantitative reverse transcriptase PCR analyses were completed using a Quantitect SYBR Green reverse transcriptase PCR kit under the following conditions. Master mixes were prepared using 12.5 μL 2× QuantiTect SYBR Green Master Mix, 0.25 μL QuantiTect reverse transcriptase mix, and 10.25 μL RNase-free water per reaction. Forward and reverse primers were added using 0.5 μL from 25 μM stocks, and primer sequences are listed in . Master mixes were aliquoted into 96-well plates (24 μL/well) along with 1 μL of RNA at a concentration of 1 ng/reaction. Reactions were cycled under the following conditions. Reverse transcription was performed for 30 minutes at 50°C. PCR activation was performed at 95°C for 15 minutes. Denaturation occurred at 94°C for 15 seconds, annealing occurred for 30 seconds at 58°C and extension occurred at 72°C for one minute. Cycling conditions were repeated 35 times. The ABI Prism 7500 sequence detection system was used to quantify gene expression using a gene-specific standard curve generated with bacterial DNA.
Statistical analysis
Significant differences in E. coli viability after incubation with AgNP-ZM and negative controls were determined by one-way analysis of variance using SigmaPlot version 11.0. For the gene expression data, bacteria were exposed to four independent zeolite membranes and four independent AgNP-ZM, and changes in expression that were two-fold or greater are considered statistically significant. In the figures, the number of AgNP-ZM used for each experiment and the statistics are included.
Results
AgNP-ZM synthesis and characterization
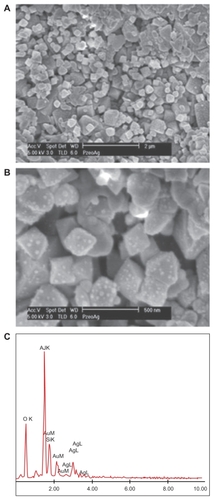
Synthesis of AgNP-ZM starts with the synthesis of porous alumina supports, on which a seeded layer of zeolite is deposited.Citation13 The zeolite membrane is then grown on the seeded side via secondary hydrothermal growth. shows the powder x-ray pattern of a typical membrane. The three strong peaks (marked with an asterisk) arise from the alumina support. All of the other peaks are from the zeolite, the major phase being zeolite Y with minor quantities of zeolite A (strongest peak 7° 2θ). shows a scanning electron microscopic cross-sectional image of the membrane with the dense 2–3 μm layer of zeolite on the porous alumina (2 mm). In order to make the AgNP, the zeolite membrane is ion-exchanged with Ag+, reduced with hydrazine to make Ag nanoclusters on the zeolite membrane, and extensively ion-exchanged with Na+ to remove any unreacted Ag+.Citation8 shows a scanning electron microscopic top view of the AgNP-ZM, and is a magnified image that clearly shows the presence of Ag clusters on the zeolite (<50 nm). is the elemental analysis of the surface of the membrane showing the presence of Ag, Si, and Al.
Figure 1 (A) Powder diffraction pattern of a zeolite membrane grown on an alumina support (the strongest peaks marked with an asterisk are due to the alumina, the rest are zeolite peaks. (B) Cross-section of the zeolite/alumina membrane by scanning electron microscopy.
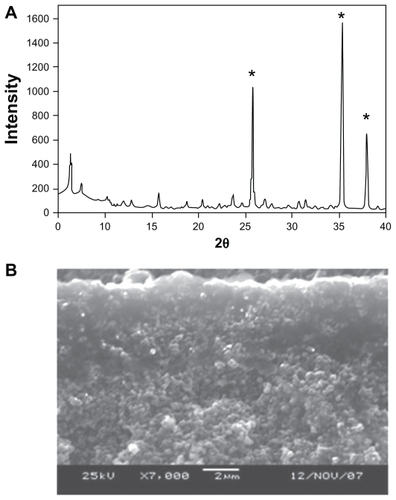
Figure 2 (A) Top view of the zeolite part of the silver-loaded zeolite/alumina membrane by scanning electron microscopy. (B) Magnified image of the top view of A showing discrete Ag particles on the zeolite. (C) Elemental analysis of the silver nanoparticles embedded in zeolite membranes, showing the presence of Ag, Si, and Al.
The AgNP-ZM were incubated in LB broth (5 mL), and the amount of Ag+ released over time was analyzed by elemental analysis. In order to estimate an upper limit of the amount of Ag+ that can be released from the membrane, freshly prepared (autoclaved) AgNP-ZM were exposed to LB broth for 48 hours under gentle shaking and the amount of Ag+ was found to be approximately 20 ppm. When this same AgNP-ZM was exposed to media for 30 minutes for a second time, 5.7 ppm Ag+ was released. After a third and fourth exposure (sample autoclaved prior to each exposure) of the same AgNP-ZM for 30-minutes and 60-minutes, contact with media released 1.9 and 1.7 ppm of Ag+, respectively. The goal of these elemental analysis studies was to evaluate an upper limit upon single exposure for an extended time period (48 hours), and to demonstrate that the AgNP-ZM have a large reservoir of Ag (primarily due to the large internal surface area of the zeolite) so that even a second, third, and fourth exposure leads to release of Ag+ at ppm levels.
Interaction of AgNP-ZM with E. coli
Antibacterial activity
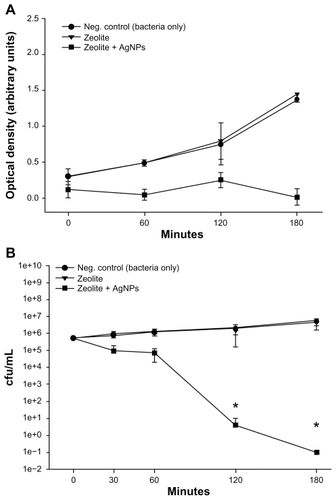
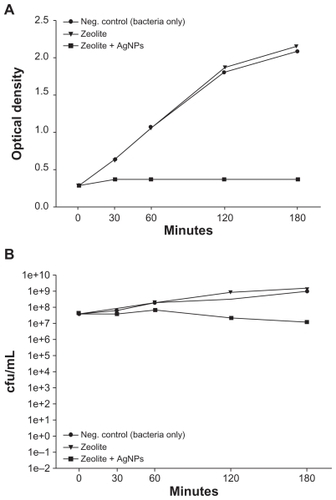
E. coli was incubated alone, with a control zeolite membrane, and with a freshly prepared AgNP-ZM to determine and compare the antibacterial activity of AgNP-ZM. Turbidity measurements performed on two separate occasions using freshly prepared AgNP-ZM revealed that bacterial growth was completely inhibited over a three-hour incubation period when E. coli was exposed to AgNP-ZM (optical density about 0.4), whereas with bacteria only and zeolite supports, proliferation increased over time, as shown in . shows the number of colonies after incubation with controls or AgNP-ZM, and a significant decrease in E. coli viability was observed over a three-hour period, although a decrease in bacterial viability was noted with AgNP-ZM after 30 minutes. All of the data in were obtained with one freshly prepared AgNP-ZM on three separate occasions.
Figure 3 (A) Turbidity analyses of supernatant samples from unexposed Escherichia coli and E. coli exposed to zeolite controls or zeolite-supported silver nanoparticles over time. Values are expressed as the mean and standard deviation of two experiments. (B) Enumeration of viable E. coli over time upon incubation with zeolite supports containing silver nanoparticles and controls.
Notes: *Significant differences versus zeolite membrane controls, n = 3, freshly-prepared zeolite supports containing silver nanoparticles, P < 0.05.
Abbreviation: cfu/mL, colony forming units per milliliter.
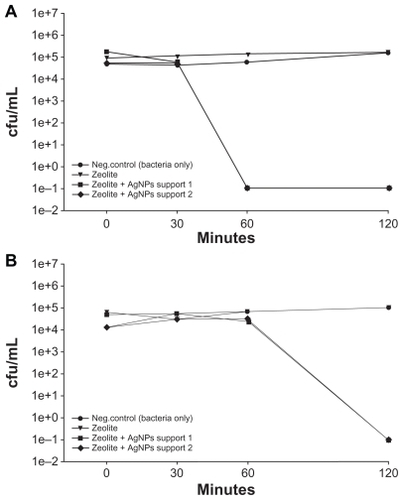
To determine if antibacterial action was contact-dependent, a zeolite membrane control and two AgNP-ZM were incubated with 5 mL of LB broth for three hours. The membranes were then removed, and the conditioned LB broth (5 mL) was collected. Bacterial cultures which had been adjusted to about 1 × 10⁵ cells/mL in 5 mL of LB broth were pelleted by centrifugation. The pellet was vortexed, and the conditioned broth (5 mL) was then applied to the culture. As shows, all E. coli were nonviable within 60 minutes in medium conditioned with AgNP-ZM. Medium-conditioned with zeolite membranes alone had no observable effect on bacterial viability. illustrates that for bacteria separated from the zeolite membranes using transwell plates containing inserts with a pore size of 0.4 μm, death was evident within 120 minutes when AgNP-ZM were used, while controls grew normally. To ensure that bacteria were unable to traverse the transwell membrane, media from the bottom chamber were sampled from all experimental treatments and plated for growth on LB agar, and no colonies were observed (data not shown).
Figure 4 (A) Viability of Escherichia coli after exposure to supernatants collected from two zeolite supports containing silver nanoparticles and zeolite controls that were soaked in Luria Bertani media for three hours. (B) Viability of E. coli after exposure to two zeolite supports containing silver nanoparticles that were separated from bacteria using transwell plates. Zeolite supports containing silver nanoparticles are listed as zeolite + silver nanoparticle support 1 and support 2 in the Figure.
Abbreviation: cfu/mL, colony forming units per milliliter.
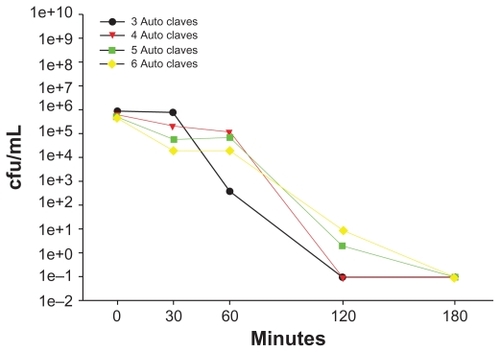
The antibacterial activity of a single AgNP-ZM was tested a total of six times in order to evaluate the feasibility of repeated use of a membrane. The support was sterilized by steam autoclave between each use. After the AgNP-ZM had been used three or four times, the viability of E. coli cultures seeded at a concentration of approximately 1 × 10⁶ cfu/mL was reduced to 0 cfu/mL within two hours (). However, after four or more uses, complete death was apparent after three hours of incubation.
Figure 5 Escherichia coli at a concentration of 1 × 10⁶ cfu/mL was incubated with the same zeolite supports containing silver nanoparticles six consecutive times, with autoclave sterilization between each use. Bacterial viability was determined using plate counts.
Abbreviation: cfu/mL, colony forming units per milliliter.
Gene expression by E. coli exposed to AgNP-ZM
Gene expression arrays revealed significant differences between E. coli exposed to AgNP-ZM versus zeolite membranes. A total of 145 genes were upregulated greater than two-fold, while 170 genes were downregulated ( and , respectively). Selected genes which were upregulated or downregulated by at least three-fold are included in and , respectively. Both copper transporter gene copA and magnesium transporter gene mgtA were upregulated over nine-fold. The genes which encode the antioxidants thioredoxin and glutaredoxin were also upregulated greater than about 7.5-fold compared with zeolite controls. In addition, several genes encoding proteins involved with sulfur transport, ie, cysW, cysA, cysD, and cysU, were upregulated greater than nine-fold (). Genes coding for multiple antibiotic resistance (marA and marR) were increased approximately eight-fold and seven-fold, respectively (). Several genes associated with iron transport, including fepG, fecR, fepC, fepA, fhuE, and fhuC, were downregulated (), although the gene expression of hemH (coding for ferrochelatase) was upregulated about 10-fold () in E. coli exposed to AgNP-ZM compared with zeolite membranes.
Table 1 Increases in Escherichia coli gene expression in response to 30-minute exposures to four independent zeolite supports containing silver nanoparticles versus E. coli exposed to four independent zeolite controls
Table 2 Decreases in Escherichia coli gene expression in response to 30-minute exposures to four independent zeolite supports containing silver nanoparticles versus E. coli exposed to four independent zeolite controls
Gene expression in E. coli changes with AgNP-ZM use
Quantitative reverse transcriptase PCR was used to confirm gene expression microarray data. Selected genes representing those involved with metal transport, resistance, and oxidative stress were analyzed in order to identify possible mechanisms of toxicity induced by exposure to AgNP-ZM. reports quantitative reverse transcriptase PCR data for genes encoding copper-silver efflux, glutaredoxin, multicopper oxidase, and thioredoxin, and their expression levels after each support use. With progressive use of AgNP-ZM, expression of the gene that encodes glutaredoxin decreased (fold-change of approximately 14 and 2, and virtually no change for trials 1, 2, and 3, respectively). The expression of thioredoxin was increased by approximately five-fold for E. coli exposed to AgNP-ZM compared with bacteria exposed to zeolite membranes alone for the first use, but for the second and third uses there was virtually no change in gene expression. Increased expression of the gene encoding multicopper oxidase remained significant with each support use, although expression decreased by approximately half with latter uses (44-fold, 33-fold, and 16-fold). Gene expression of cusC, which encodes copper-silver efflux, fluctuated slightly with each use (approximately 2-fold, 4-fold, and 2.5-fold for trials 1, 2, and 3, respectively). These experiments were done with a single AgNP-ZM on three separate occasions.
Table 3 Quantitative reverse transcriptase polymerase chain reaction analyses of select genes after three independent trials of zeolite support-containing silver nanoparticles. Escherichia coli at a concentration of 1 × 10⁸ colony forming units/mL was exposed to silver nanoparticles embedded in zeolite membranes or zeolite membrane controls for 45 minutes prior to RNA isolation and analyses. Values are fold-change ± standard deviation
Interaction of AgNP-ZM with other bacteria
The primary goal of this paper was to understand the interaction of AgNP-ZM with E. coli XL-blue, which is a laboratory strain. We also did some preliminary work using MRSA. Exposure to AgNP-ZM resulted in reduced replication, as interpreted by the lack of increase in supernatant turbidity compared with controls, although the killing efficiency of the AgNP-ZM was found to be less potent compared with E. coli over the same exposure period (180 minutes). These data are shown in . The gene expression studies were performed with E. coli, although further experimentation is underway using other clinically relevant bacterial strains.
Figure 6 Growth and viability of Staphylococcus aureus alone, exposed to a zeolite membrane, or exposed to zeolite supports containing silver nanoparticles was evaluated over time. (A) Turbidity was analyzed after 30, 60, 120 or 180 minutes of exposure to a single zeolite support containing silver nanoparticles. (B) Bacterial viability was measured after 30, 60, 120, and 180 minutes of exposure to a single zeolite support containing silver nanoparticles.
Abbreviation: cfu/mL, colony forming units per milliliter.
Discussion
The discussion primarily focuses on the properties of the AgNP-ZM and its effect on E. coli.
Release of Ag+ from AgNP-ZM
In our previous study,Citation8 we did not address the issue of the interactions between bacteria and AgNP-ZM. Our preliminary data indicate that AgNP-ZM were bacteriostatic against MRSA, a Gram-positive clinically relevant strain of S. aureus. However, the bactericidal properties against this bacterium were less potent compared with Gram-negative E. coli. We hypothesize that cell wall differences between these two bacteria may account for the differences in bacterial viability upon exposure to AgNP-ZM, and studies are underway to investigate these findings. It is clear from the present study () that reduction of E. coli growth and viability does not require contact with the membrane. This is in contrast with the findings of Su et al,Citation6 who found that Ag/clay-conditioned supernatants did not have appreciable antibacterial activity. With freshly prepared AgNP-ZM, we found that the release of Ag+ into the broth can be as high as 20 ppm after 48 hours. Since the zeolite membranes were extensively ion-exchanged with Na+ prior to these experiments, any Ag+ in solution would have to occur by AgNP oxidation and release. Slow release of Ag+ from the AgNP-ZM is also supported by the observation that bacteria sequestered in the transwell plates were not killed as quickly as those incubated with supernatants conditioned for three hours (). It is known that solutions of Ag+ at 0.05 ppm result in complete reduction of E. coli viability within two hours.Citation14 Oxidation of AgNP over time and release of Ag+ in less than 30 minutes has been noted.Citation4 With each AgNP-ZM, efficacy of the membranes decreased as well upon repeated use (). Ag+ released into media after the second, third, and fourth use was 5.7, 1.9, and 1.7 ppm, for 30-, 30-, and 60-minute exposures. There is clearly a decrease at the 30-minute exposure level between the second and third use, and it took twice as long (60 minutes) for the fourth use to match the release of the third use. Thus, we hypothesize that the bactericidal effects of AgNP-ZM are delayed due to reduction in the amount of Ag+ released from AgNP-ZM with repeated use. As is evident from the scanning electron microscopy images (), there is a distribution of sizes of AgNP. Smaller AgNP are expected to undergo faster dissolution than larger particles, thus after each use, the Ag+ release should decrease. In addition, autoclaving could alter the surface of the AgNP, such as the formation of insoluble hydroxides or oxides. Interestingly, it has been reported that nanosilver bandages exposed to temperatures >90°C have diminished bactericidal activity.Citation15 Other sterilization measures, such as ultraviolet light, are also problematic, because of the photochemistry of silver. We also used ethanol for decontamination, as reported above.
Disruption of oxidative balance
Several research groups studying AgNP have proposed that their antibacterial activity is due to the formation of reactive oxygen species. The mechanism of bacterial death was found to be a result of persistent surface free radicals found on AgNP, and that the antibacterial activity of both AgNP and Ag+ could be reversed by n-acetylcysteine.Citation16 The mechanism of toxicity of AgNP in clay was proposed to be cell membrane disruption caused by the generation of reactive oxygen species, and when incubated with the antioxidant, glutathione, their viability was restored.Citation6 When bacterial reporter strains specifically responding to superoxide radicals were incubated with 100–300 ppm Ag+, it was apparent that the mechanism of antibacterial activity was via reactive oxygen species, specifically superoxide, which formed after perturbation of the electron transport chain.Citation17 However, gene expression microarrays in the current study revealed downregulation of sodA, encoding a superoxide dismutase (3.1-fold decrease), which suggests that superoxide may not be the predominant reactive oxygen species driving bacterial oxidative stress. On the other hand, upregulation of expression of thioredoxin and glutaredoxin, which are crucial to maintaining oxidative balance, was noted after E. coli was exposed to AgNP-ZM (). Several genes associated with sulfur species transport and reduction were correlated with the multiple use of the AgNP-ZM. In the presence of silver (Ag+), bacteria may adjust sulfur pools to accommodate the synthesis of sulfur-containing antioxidants.
Genes associated with iron transport (fep genes) were downregulated, while hemH, which codes for ferrochelatase and plays an important role in heme synthesis, was upregulated. A possible response mechanism to the increased presence of Ag+ is that the bacteria decrease the available pools of intracellular iron by increasing expression of ferrochelatase, which tightly binds Fe2+, to combat and reduce oxidative stress.Citation18,Citation19 The downregulation of genes with a role in iron reduction and iron release from proteins further suggests that the bacteria are attempting to control the intracellular levels of Fe2+,Citation20 thereby reducing the amount of iron available for Fenton reactions. Attempts by bacteria to regulate and restore oxidative balance are also suggested by the upregulation of soxR, which is involved in redox sensing and controlling expression of superoxide dismutase and other antioxidants.Citation21,Citation22
Several genes encoding for metal ion influx and intracellular metal transport and efflux were upregulated. E. coli exposed to AgNP-ZM upregulated mgtA, which encodes for proteins used for Mg2+ influx, and also upregulated arsR and arsB, which encode genes involved in arsenic resistance, but currently have no known role in silver toxicity. The gene zraP, which encodes a protein used for zinc homeostasis and copA, which in turn encodes for an ATPase intracellular copper transporter, were both upregulated. Others have found that copA is induced in the presence of silver salts,Citation23 but does not appear to be involved in silver resistance.Citation24 Thus, it is likely that the mechanisms of AgNP toxicity are similar to those for copper toxicity. Slawson et alCitation25 reported that Ag+ toxicity was reduced when Cu2+ is also present, indicating that silver may compete with copper for entry into the cell. There appears to be some promiscuity of bacterial metal transport proteins, the functions of which have not been fully elucidated.
Developing resistance to silver
The genes known to encode silver resistance in E. coli are ybdE, ylcD, ylcC, ylcB, ylcA, and ybcZ.Citation26 Most silver-resistant bacterial strains have developed tolerance by utilizing Ag+ ATPase efflux pumps and antiporters rather than chemical detoxification mechanisms.Citation27 However, in the current study, only cusC (ylcB) and cusF (ylcC), the genes encoding for copper-silver efflux outer membrane protein and periplasmic copper and silver binding proteins, respectively, were upregulated when the bacteria were exposed to AgNP-ZM as compared with zeolite membrane controls. Further, we were able to confirm the upregulation of copper-silver efflux outer membrane protein (cusC) gene transcripts using quantitative reverse transcriptase PCR, although expression levels fluctuated with AgNP-ZM use, which may be a result of variations in Ag+ release. The increase in gene transcription of multiple antibiotic resistant genes marA and marR is remarkable. The increased expression of mar genes is associated with antibiotic resistance (including tetracycline and ampicillin resistance).Citation28 This work indicates that multiple antibiotic resistance genes may also play a role in the evolution of silver resistance in E. coli, and warrant further investigation.
Conclusion
The concept of using intrazeolitic space for storage of specific molecules and their slow release has found many applications. For example, controlled release of the preservative, cresol, from zeolite was successfully demonstrated by ErikksonCitation29 where E. coli and S. aureus viability was reduced. Another study demonstrated the feasibility of zeolites as a vehicle for drug delivery by releasing ketoprofen under different physiological conditions.Citation30 We have shown that surface-modified zeolites can release paraquat under controlled conditions.Citation31 However, this study is the first to demonstrate that zeolite membranes can serve as supports, and we demonstrate this functionality using AgNP for antibacterial use. The impact of using membranes is that such membranes can be grown on various supports, including plastics, cellulose, and metals.Citation12 Possible uses of this technology could include antibacterial coatings for a wide variety of applications. Further, these membranes have the propensity to be tailored for controlled release, thus dictating the amount of cargo released into the environment. Gene expression studies suggest that the mechanism for the antibacterial activity of AgNP-ZM is centered around the depletion of cellular antioxidant capacity by gradual release of Ag+ from zeolite membranes.
Supplemental Methods
RNA isolation
Bacteria were collected from each well and pelleted at 4°C in 15 mL centrifuge tubes at 3250 × g for 15 minutes. Supernatants were discarded and the pellets were homogenized in 5 mL Trizol for five minutes. Each tube was shaken vigorously for 30 seconds after the addition of 1 mL of chloroform. The tubes were incubated at room temperature for three minutes prior to centrifugation at 4°C and 3250 × g for 15 minutes. The organic layer was then removed and placed into clean RNase free microfuge tubes. Equal amounts of 100% ethanol were added to each tube and mixed by pipetting. RNA purification was then performed using RNeasy mini kits as per the manufacturer’s instructions, during which DNase was added to remove contaminating DNA. At the final elution step, RNA was resuspended in 20 μL of RNase-free H2O and stored at −80°C until further use in gene expression arrays and quantitative reverse transcription polymerase chain reaction experiments. The concentration of the samples provided was determined using the NanoDrop® ND-1000 ultraviolet-visible spectrophotometer.
Gene arrays
Microarray slides were hybridized overnight, washed, and then scanned with an Agilent G2505C microarray scanner. This high-resolution scanner features an industry-leading extended dynamic range of 106 (20-bits) for high sensitivity scanning without saturation, low-level detection resulting from optimized precision optics, broad dynamic range, and minimal spectral cross talk that enables detection of weak features. The information about each probe on the array was extracted from the image data using Agilent Feature Extraction 10.9. This data was stored in Feature Extraction “.txt” files. The raw intensity values from these files were imported into the mathematical software package “R”, which is used for all data input, diagnostic plots, normalization, and quality checking steps of the analysis process using scripts developed inhouse specifically for this analysis. These scripts call on several Bioconductor packages (http://www.bioconductor.org/). Bioconductor is an open source and open development software project that provides tools for the analysis and comprehension of genomic data.Citation1 Significance analyses of microarrays (SAM) is a powerful tool for analyzing microarray gene expression data useful for identifying differentially expressed genes between two conditions.Citation2 SAM was used to calculate a test statistic for relative difference in gene expression based on permutation analysis of expression data and calculated a false discovery rate using the q-value method presented by Storey and Tibshirani.Citation3 In outline, SAM identified statistically significant genes by carrying out gene-specific t-tests and computed a statistic for each gene. This test statistic measured the strength of the relationship between gene expression and a five-response variable. This analysis used no-parametric statistics, given that the data may not follow a normal distribution. The response variable described and grouped the data based on experimental conditions. In this method, repeated permutations of the data were used to determine if the expression of any gene is significantly related to the response. The use of permutation-based analysis accounted for correlations in genes and avoided parametric assumptions about the distribution of individual genes. For this experiment, SAM analysis was implemented in R using the Bioconductor Siggenes package. Also, Relative Log Expression values were computed for each probe set by comparing the expression value in each array against the median expression value for that probe set across all arrays. Gene expression arrays were analyzed using a 10% false discovery rate to generate the list of significantly differentially expressed genes. The q-values (false discovery rate) for each gene are provided in the results table, and the lower the value the more significant the result.
Figure S1 Schematic of fabrication of zeolite support containing silver nanoparticles. Alumina supports were used as the substrate for zeolite membrane synthesis. Zeolite was grown into a continuous membrane by hydrothermal synthesis. Zeolite membranes were then ion-exchanged with 0.005 M AgNOCitation3 solution, washed, and then reduced by hydrazine.
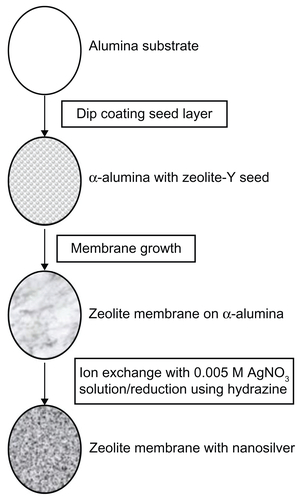
Figure S2 Viability of Escherichia coli after exposure to zeolite support containing silver nanoparticles for 30 minutes. The viability of E. coli was determined after exposure to zeolite support containing silver nanoparticles for 30 minutes. RNA was harvested from these experiments and used for the gene expression microarray analyses. Viability was significantly reduced after incubation with zeolite support containing silver nanoparticles for 30 minutes, compared with zeolite controls. Statistical significance was determined using the Student’s t-test (n = 4 for zeolite controls and zeolite support containing silver nanoparticles, P < 0.02).
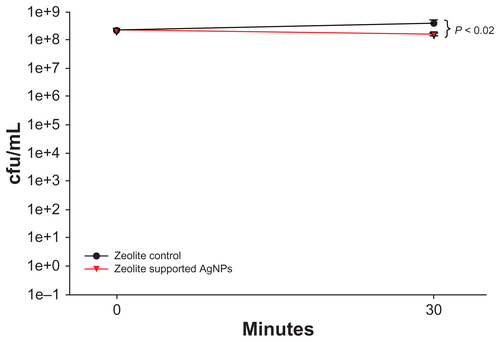
Table S1 E. coli primer sequences for quantitative real-time PCR (QRT-PCR)
Table S2 Increases in E. coli gene expression in response to 30-minute exposures to four independent zeolite supports containing AgNPs versus E. coli exposed to four independent zeolite controls
Table S3 Decreases in Escherichia coli gene expression in response to 30-minute exposures to four independent zeolite supports containing silver nanoparticles versus E. coli exposed to four independent zeolite controls
Supplemental References
- GentlemanRCCareyVJBatesDMBioconductor: Open software development for computational biology and bioinformaticsGenome Biol2004510R8015461798
- TusherVGTibshiraniRChuGSignificance analysis of microarrays applied to the ionizing radiation responseProc Natl Acad Sci U S A20019895116512111309499
- StoreyJDTibshiraniRStatistical significance for genomewide studiesProc Natl Acad Sci U S A2003100169440944512883005
Acknowledgments
Support for this research was obtained through grants from the National Institute for Occupational Safety and Health and US Department of Agriculture/National Institute of Food and Agriculture. We are grateful to Drs Vijay Pancholi and Joanne Trgovcich for donating the bacterial cultures used in this study. We thank David Newsom and Dr Peter White at the Nationwide Children’s Hospital’s Biomedical Genomics Core for their assistance with the gene expression microarray assays and analyses.
Disclosure
The authors report no conflicts of interest in this work.
References
- AlexanderJWHistory of the medical use of silverSurg Infect2009103289292
- ChenXSchluesenerHJNanosilver: A nanoproduct in medical applicationToxicol Lett2008176111218022772
- BakerCPradhanAPakstisLPochanDJShahSISynthesis and antibacterial properties of silver nanoparticlesJ Nanosci Nanotechnol20055224424915853142
- LokCNHoCMChenRSilver nanoparticles: Partial oxidation and antibacterial activitiesJ Biol Inorg Chem200712452753417353996
- ChoiOHuZSize dependent and reactive oxygen species related nanosilver toxicity to nitrifying bacteriaEnviron Sci Technol200842124583458818605590
- SuHLChouCCHungDJThe disruption of bacterial membrane integrity through ROS generation induced by nanohybrids of silver and clayBiomaterials200930305979598719656561
- LiangZDasAHuZBacterial response to a shock load of nanosilver in an activated sludge treatment systemWater Res201044185432543820638703
- SabbaniSGallego-PerezDNagyAWaldmanWJHansfordDDuttaPKSynthesis of silver-zeolite films on micropatterned porous alumina and its application as an antimicrobial substrateMicropor Mesopor Mat20101351–3131136
- FernándezASorianoEHernández-MunozPGavaraRMigration of antimicrobial silver from composites of polylactide with silver zeolitesJ Food Sci2010753E18619320492293
- Kwakye-AwuahBWilliamsCKenwardMARadeckaIAntimicrobial action and efficiency of silver-loaded zeolite XJ Appl Microbiol200810451516152418179543
- ShameliKAhmadMBZargarMYunusWMIbrahimNAFabrication of silver nanoparticles doped in the zeolite framework and antibacterial activityInt J Nanomedicine2011633134121383858
- TavolaroADrioliEZeolite membranesAdv Mater199911975996
- WhiteJCDuttaPKShqauKVerweijHSynthesis of ultrathin zeolite Y membranes and their application for separation of carbon dioxide and nitrogen gasesLangmuir201026102871029320392121
- JungWKKooHCKimKWShinSKimSHParkYHAntibacterial activity and mechanism of action of the silver ion in Staphylococcus aureus and Escherichia coliAppl Environ Microbiol20087472171217818245232
- LandryBKNadwornyPLOmotosoOEMahamYBurrellJCBurrellREThe kinetics of thermal instability in nanocrystalline silver and the effect of heat treatment on the antibacterial activity of nanocrystalline silver dressingsBiomaterials200930366929693919766307
- KimJSKukEYuKNAntimicrobial effects of silver nanoparticlesNanomed Nanotech Biol Med20073195101
- ParkHJKimJYKimJSilver-ion-mediated reactive oxygen species generation affecting bactericidal activityWater Res20094341027103219073336
- CrichtonRRWilmetSLegssyerRWardRJMolecular and cellular mechanisms of iron homeostasis and toxicity in mammalian cellsJ Inorg Biochem200291191812121757
- HunterGASampsonMPFerreiraGCMetal ion substrate inhibition of ferrochelataseJ Biol Chem200828335236852369118593702
- AndrewsSCIron storage in bacteriaAdv Microb Physiol1998402813519889981
- HaUJinSExpression of the soxR gene of Pseudomonas aeruginosa is inducible during infection of burn wounds in mice and is required to cause efficient bacteremiaInfect Immun199967105324533110496912
- GortASImlayJABalance between endogenous superoxide stress and antioxidant defensesJ Bacteriol19981806140214109515906
- RensingCFanBSharmaRMitraBRosenBPCopA: An Escherichia coli Cu(I)-translocating P-type ATPaseProc Natl Acad Sci U S A200097265265610639134
- FrankeSGrassGNiesDHThe product of the ybdE gene of the Escherichia coli chromosome is involved in detoxification of silver ionsMicrobiology2001147496597211283292
- SlawsonRMLeeHTrevorsJTBacterial interactions with silverBioMetals199033151154
- SilverSPhung leTSilverGSilver as biocides in burn and wound dressings and bacterial resistance to silver compoundsJ Ind Microbiol Bio technol2006337627634
- SilverSBacterial silver resistance: Molecular biology and uses and misuses of silver compoundsFEMS Microbiol Rev2003272–334135312829274
- OkusuHMaDNikaidoHAcrAB efflux pump plays a major role in the antibiotic resistance phenotype of Escherichia coli multiple-antibiotic-resistance (Mar) mutantsJ Bacteriol199617813063088550435
- ErikssonHControlled release of preservatives using dealuminated zeolite YJ Biochem Biophys Methods20087061139114417599464
- RimoliMGRabaioliMRMelisiDSynthetic zeolites as a new tool for drug deliveryJ Biomed Mater Res A200887115616418085645
- ZhangHKimYDuttaPKControlled release of paraquat from surface-modified zeolite YMicropor Mesopor Mat2006881–3312318