Abstract
Background
Hydrophobic biopolymers such as polylactide-co-glycolide (PLGA, 85:15) have been extensively explored as scaffolding materials for tissue engineering applications. More recently, electrospun microfiber-based and nanofiber-based scaffolds of PLGA have received increased attention because they act as physical mimics of the fibrillar extracellular matrix. However, the hydrophobicity of the PLGA microfiber surface can limit its use in biomedical applications. Therefore, in a previous study, we fabricated Pluronic® F-108 (PF-108)-blended PLGA microfibrous scaffolds that alleviated the hydrophobicity associated with PLGA by enriching the surface of microfibers with the ethylene oxide units present in PF-108.
Methods
In this study, we report the influence of the extent of surface enrichment of PLGA microfibers on their interaction with two model proteins, ie, bovine serum albumin (BSA) and lysozyme. BSA and lysozyme were adsorbed onto PLGA microfiber meshes (unmodified and modified) and studied for the amount, secondary structure conformation, and bioactivity of released protein.
Results
Irrespective of the type of protein, PF-108-blended PLGA microfibers showed significantly greater protein adsorption and release than the unblended PLGA samples. However, in comparison with BSA, lysozyme showed a 7–9-fold increase in release. The Fourier transform infrared spectroscopy studies for secondary structure determination demonstrated that irrespective of type of microfiber surface (unblended or blended), adsorbed BSA and lysozyme did not show any significant change in secondary structure (α-helical content) as compared with BSA and/or lysozyme in the free powder state. Further, the bioactivity assay of lysozyme released from blended PLGA microfiber meshes demonstrated 80%–85% bioactivity, indicating that the process of adsorption did not significantly affect biological activity. Therefore, this study demonstrated that the decreased hydrophobicity of blended PLGA microfibrous meshes not only improved the amount of protein adsorbed (lysozyme and BSA) but also maintained the secondary structure and bioactivity of the adsorbed proteins.
Conclusion
Modulating the hydrophobicity of PLGA via blending with PF-108 could be a viable strategy to improve its interaction with proteins and subsequent cell interaction in tissue engineering applications.
Introduction
Polylactide-co-glycolide (PLGA) has been extensively explored as a scaffolding material in tissue engineering applications because of its biocompatibility, biodegradability, and mechanical strength.Citation1,Citation2 More recently, electrospun PLGA fibers, because of their unique extracellular matrix mimicking microfibrous/nanofibrous structure, have shown potential for development as scaffolding systems.Citation3–Citation6 These fibrous meshes of PLGA (diameter ranging from tens of nanometers to a few microns) possess other desirable properties for scaffolding systems, such as a high aspect ratio, a highly porous structure (80%–90% porosity), and good tensile strength.Citation7,Citation8 The varieties of PLGA that have improved mechanical properties are the ones with a higher content of lactic acid. However, the higher lactic acid content leads to an increase in the hydrophobicity of the PLGA system, which in turn can adversely influence protein interaction and subsequent cellular behavior.Citation9–Citation13
Exposure of such an extracellular matrix mimicking f ibrous scaffold to the biological environment at the site of implantation would normally result in rapid adsorption of proteins onto the surface of the scaffold. The amount, orientation, and conformation of the adsorbed proteins is largely regulated by the surface properties of the scaffold, including surface chemistry, roughness, and charge.Citation11,Citation12,Citation14 These properties together determine the wettability of the scaffold surface, hence understanding the effect of wettability (hydrophobicity/hydrophilicity) on protein adsorption is desirable for scaffold design. Various studies have reported that adsorption of proteins on a highly hydrophobic surface can denature the native conformation of the protein and consequently compromise bioactivity.Citation15,Citation16 On the other hand, highly hydrophilic surfaces can inhibit protein adsorption.Citation17 Therefore, it is now well accepted that both extremely hydrophilic and hydrophobic surfaces may not be desirable for favorable protein interaction. Rather, surfaces with moderate hydrophobicity/hydrophilicity are considered more favorable for adsorbing proteins in their natural conformation, which can be an important factor in determining cell interactions with the scaffold surface.Citation11,Citation12,Citation16,Citation18,Citation19 Therefore, it would be desirable to design a PLGA microfibrous scaffold that maintains the advantages of PLGA while providing a reduced surface hydrophobicity in order to make them more amenable as tissue engineering scaffolds.
In a previous study, we reported the blending of small concentrations of the nonionic surfactant Pluronic® F-108 (PF-108) with PLGA (85:15), and demonstrated a significant reduction in the surface hydrophobicity of electrospun PLGA fibers while minimally compromising the thermal, mechanical, and degradation properties of PLGA.Citation20,Citation21 These studies also demonstrated that the reduction in hydrophobicity was due to surface enrichment of ethylene oxide units of PF-108 on microfibrous PLGA scaffolds. Further, it was also observed that the alleviation of surface hydrophobicity lead to an enhanced interaction with water throughout the mesh (as demonstrated by water uptake and swelling studies). Because proteins generally exist in aqueous solution under physiological conditions, we hypothesized that increased hydrophilicity of PF-108 blended PLGA microfibrous meshes will increase the possibility of interaction between water-solubilized protein molecules and microfiber surfaces. This can, in turn, influence the adsorbed protein in terms of its amount, secondary structure, and consequently its function. Therefore, this study was conducted to understand the influence of hydrophilization of PLGA microfibers on the adsorption behavior, secondary structure, and function of adsorbed proteins.
Materials and methods
Bovine serum albumin (99% purity), and chicken egg white lysozyme (99% purity) were obtained from Bangalore Genei, India, and used as received. PLGA (85:15) with a molecular weight of 45,000–70,000, and PF-108 (82.2% ethylene oxide and 17.8% propylene oxide) with a molecular weight of 14,600 were obtained from Sigma Aldrich, St Louis, MO. Tetrahydrofuran and dimethylformamide (solvents of high-pressure liquid chromatography grade) used for electrospinning were purchased from Merck India Ltd (Mumbai, India). Protein estimation was conducted colorimetrically using a bicinchoninic acid assay kit procured from Thermo Scientific (Rockford, IL) and lysozyme activity was quantified using the lysozyme assay kit procured from Sigma-Aldrich.
Fabrication of PLGA microfibrous meshes
The PLGA microfibrous meshes were fabricated by electrospinning as reported previously.Citation20 The electrospinning apparatus that was used for fabricating PLGA microfibers consisted of a high voltage power supply unit (Glassman High Voltage Inc, High Bridge, NJ), an adjustable rotatory mandrel (length 12 cm and diameter 7.5 cm) that served as a substrate for collection of fibers, and a syringe pump (Harvard Apparatus, Holliston, MA) that enabled pumping of the polymer solution. Briefly, a 22% w/v polymer solution (pure PLGA or PLGA blended with 0.5%–2.0% w/v of PF-108) prepared in tetrahydrofuran and dimethylformamide in a 3:1 ratio was used for electrospinning. The parameters used for electrospinning were as follows: flow rate of 0.5 mL/hour, electrospinning distance of 29 cm (distance between the tip of the needle [internal diameter = 0.394 mm] and the collector mandrel), and the voltage applied was 1.2 kV/cm. The PLGA solution when electrospun using the aforementioned parameters lead to the fabrication of microfibers that were deposited/collected on the rotating mandrel (300 rpm). The fabricated nonwoven microfibrous mesh was lyophilized for 48 hours and used for further experiments. For convenience, the following acronyms were used to represent the microfiber samples studied: PF-0.0 for pure PLGA microfibers, PF-0.5 for 0.5% PF-108 blended PLGA microfibers, PF-1.0 for 1.0% PF-108 blended PLGA microfibers, PF-1.5 for 1.5% PF-108 blended PLGA microfibers, and PF-2.0 for 2.0% PF-108 blended PLGA microfibers.
Scanning electron microscopy
An FEI Quanta 200 scanning electron microscope (SEM) was used to characterize the surface morphology and diameter of the electrospun microfibers. Microfibrous meshes were lyophilized for 24 hours and sputter-coated with gold prior to SEM analysis. SEM analysis was performed at a working distance of 10 mm and an accelerating voltage of 20 kV. The fiber diameters were measured using an indigenously developed algorithm (software) that estimated diameters using gray-scale images generated from the SEM. For each sample, three zones of view were imaged and analyzed using the software. For each zone, more than 50 measurements were recorded and measurements from all the three zones were averaged to arrive at average diameter values of blended and unblended microfiber meshes.
Protein adsorption
Freshly prepared solutions of bovine serum albumin (BSA, 5% w/v) and lysozyme (5% w/v) in phosphate-buffered saline (pH 7.4) were used for adsorption. Prewetted PLGA microfiber meshes (30 minutes in double distilled water) were immersed in protein solution for 30 minutes. After 30 minutes, the protein-adsorbed PLGA microfiber meshes were gently washed with deionized water three times. All microfibrous meshes (freshly prepared and protein adsorbed) were frozen at − 20°C for 24 hours prior to lyophilization. Frozen samples were then lyophilized at −50°C and 110 mb (1.59 psi) pressure for a duration of 72 hours using a lyophilizer (Freeze Dryer ALPHA 1–4 LD plus; Martin Christ Gefriertrocknungsanlagen GmbH, Osterode am Harz, Germany). The lyophilized samples were used for protein release and Fourier transform infrared (FTIR) spectroscopy studies.
Protein release and quantification study
For these studies, 1 × 1 cm samples of protein-adsorbed PLGA microf iber meshes (PF-0.0, PF-0.5, PF-1.5, and PF-2.0) were suspended in 1 mL of phosphate-buffered saline at pH 7.4. Culture tubes containing the suspended microfiber samples were incubated at 37°C in an orbital shaker at 50 rpm. At predetermined time points (2, 8, and 24 hours) 1 mL of phosphate-buffered saline containing released protein was aspirated and the culture tubes were replenished with a similar amount of fresh phosphate-buffered saline. The concentration of the released protein in the aspirated phosphate-buffered saline was quantified using the bicinchoninic acid assay.Citation22 For this, the protein-containing samples were incubated with bicinchoninic acid reagents for 60 minutes and the samples were prepared as per the Pierce (Thermo) protocol for ultraviolet analysis. The absorption values for the prepared samples were recorded at a wavelength of 595 nm using an ultraviolet-visible spectrophotometer (Thermo Electron Corp, Waltham, MA). The concentration of the protein at the respective time points was then calculated from reference plots of known concentrations of BSA and lysozyme (10–1000 μg/mL). All experiments were performed in triplicate.
Fourier transform infrared spectroscopy
For the secondary structure analysis of the adsorbed proteins, FTIR spectroscopy was used.Citation23 FTIR spectroscopy can process a variety of protein samples, such as solubilized proteins,Citation24,Citation25 proteins adsorbed on surfaces,Citation26–Citation29 and encapsulated proteins,Citation30 and hence can be a useful tool for the characterization of proteins associated with scaffolds in tissue engineering applications. Further, mathematical methods such as second derivative (qualitative)Citation31 and deconvolution (quantitative)Citation32,Citation33 can be applied to estimate the secondary structure of proteins adsorbed on biomaterial surfaces using its FTIR spectra. Hence, FTIR-based structural analysis was used in this study to understand the interactions between proteins and hydrophilized PLGA microfiber surfaces.
Attenuated total reflectance FTIR spectroscopy was conducted using a Bruker (Tensor 27) FTIR spectrometer. Control of the instrument as well as collection and primary analysis of data was accomplished using inbuilt Opus software. Prior to data acquisition, the optical bench was purged using dry N2 to minimize external interference. For each run, a total of 500 scans were collected at a resolution of 4 cm−1. In order to minimize the possibility of error, the FTIR spectra of all PLGA microfiber mesh samples (with and without adsorbed protein) were recorded at least three times from both sides. Each recorded spectrum was corrected for background (atmospheric components), and the spectrum for PLGA microfiber meshes without adsorbed protein (pure PLGA meshes) was used as a control for protein-adsorbed microfiber meshes. In order to obtain the amide absorbance, the spectra of protein-adsorbed microfiber meshes were subtracted from the spectra of pure PLGA meshes. For powder samples (pure BSA and lysozyme) spectra were recorded with 2 mg samples in 200 mg KBr as a compressed pellet. All samples used were lyophilized prior to FTIR analysis and used immediately after lyophilization to reduce the possibility of surface contamination/moisture adsorption.
Secondary structure determination of surface-bound proteins
The FTIR spectra of BSA and lysozyme consist of multiple signature peaks for secondary protein structure including amide I (1500–1600 cm−1), II (1480–1575 cm−1), and III (1229–1301 cm−1). However, in this study we used only the amide I adsorption region because it is majorly governed by C═O (70%–85%) and C-N groups on the protein backbone. To determine the secondary structure of adsorbed proteins, the sum of Gaussian curve to amide I region (ie, 1500–1600 cm−1) were fitted. The curve fitting was performed using a previously reported method in which the authors have presumed 5–6 Gaussian peaks.Citation23,Citation24,Citation30 Therefore, in this study there was a presumption of 5–6 Gaussian peaks, with each peak being ascribed to a segment assuming a distinct secondary structure: 1689–1682 cm−1 – β-structure; 1682–1661 cm−1 – turns; 1661–1647 cm−1 – α-helix; 1644–1637.5 cm−1 – random coils; 1637.5–1627 cm−1 – β-structure 2; and 1627.5–1615 cm−1 – β-structure 3. All possible Gaussian peaks were computed using a nonlinear least square iterative curve fitting method (origin 6.0). In all cases, a linear base line was fitted.
The secondary structures of BSA and lysozyme were quantified at three different stages: first, when they were in the nonadsorbed state (ie, free protein powder); second, adsorbed on PF-108 blended and unblended PLGA microfibrous meshes; and third, when they were released from the PLGA microfiber meshes. In all cases, samples were lyophilized for 72 hours prior to FTIR analysis.
Lysozyme bioactivity assay
Lysozyme causes hydrolysis of 1,4-beta-linkages between N-acetylmuramic acid and N-acetyl-D-glucosamine residues present in the peptidoglycan layer of bacterial cell walls. Hence, a bacteria (Micrococcus lysodeikticus) with an intact cell wall was used as the substrate for the lysozyme bioactivity assay. The assay was performed using a previously reported protocol.Citation34,Citation35 Briefly, a 0.01% (w/v) suspension of M. lysodeikticus was prepared in potassium phosphate buffer (0.1 M, pH 6.24). A 100 μL aliquot of released lysozyme solution was added to 2.5 mL of the cell suspension. The turbidity of the cell suspension (cell lysis causes a change in turbidity of the cell suspension and this change in turbidity was measured) was estimated from absorption values of nonlysed cells recorded at 450 nm using an ultraviolet-visible spectrophotometer. Absorbance values were recorded for a total duration of 5 minutes (at intervals of one minute). Lysozyme activity was calculated from the slope of the linear region of the absorbance at 450 nm versus time curve. Specific lysozyme activity was determined in terms of units/mL of released phosphate-buffered saline based on the fact that, for the conditions employed, one unit of enzyme activity reduced the absorbance value by 0.001/minute.
Statistical analysis
Results were presented as mean ± standard deviation. Statistical analysis was performed using analysis of variance to test for significant differences between the means of data sets, whereas multiple comparisons of sample means were performed using the Tukey-Kramer multiple comparison test. All analyses were performed using Graph Pad Instat software. Values of P < 0.05 were considered to be statistically significant.
Results and discussion
Microfiber fabrication and surface characterization
PLGA microfibrous meshes fabricated using the electrospinning technique were analyzed for their morphology using SEM. The SEM micrographs () of PF-108 blended and unblended PLGA microfiber mesh samples show that the fibers in both samples had a random orientation, nonwoven arrangement, porous structure, and smooth morphology. The fiber diameter ranged from 200 nm to 1000 nm () with an average diameter of 800 nm.
Figure 1 Scanning electron micrographs of Pluronic® F-108 blended and unblended PLGA microfibrous mesh. (A) Pure PLGA, (B) PLGA blended with 2.0% PF-108 (this is a representative micrograph of blended samples [PF-0.5 to PF-1.5] that are morphologically similar to those reported previouslyCitation20).
Abbreviations: PF, Pluronic® F; PLGA, polylactide-co-glycolide.
![Figure 1 Scanning electron micrographs of Pluronic® F-108 blended and unblended PLGA microfibrous mesh. (A) Pure PLGA, (B) PLGA blended with 2.0% PF-108 (this is a representative micrograph of blended samples [PF-0.5 to PF-1.5] that are morphologically similar to those reported previouslyCitation20).Abbreviations: PF, Pluronic® F; PLGA, polylactide-co-glycolide.](/cms/asset/1686923a-cb00-4169-982b-6565585e6c0b/dijn_a_26453_f0001_b.jpg)
In a previous study, 0.5%–2.0% PF-108 blended PLGA microf iber meshes were thoroughly characterized for surface properties.Citation20,Citation21 The results of that study demonstrated that, for PF-108 (0.5%–2.0%) blended PLGA samples, the contact angle of the microfiber meshes decreased significantly from 120° to 10°. The drop in contact angle demonstrated the improved hydrophilicity of PLGA microfibrous meshes as a consequence of blending with PF-108. The surface hydrophilicity of the PF-108 blended PLGA microfiber meshes was further corroborated using x-ray photoelectron spectroscopy analysis wherein significant enrichment of PF-108 (25%–33%) on PLGA microfiber surfaces was demonstrated. These results confirmed the presence of PF-108 on the surface of the blended PLGA microfiber meshes as well as the extent to which it was present on the surface. However, the surface coverage of PF-108 on PLGA microfibers was partial, indicating that the PF-108 blended PLGA microfibers probably had a distribution of hydrophilic environments (PF-108) and hydrophobic environments (PLGA) on their surface (). This distribution of hydrophilic and hydrophobic environments on the surface of PLGA microfibers makes its surface moderately hydrophobic (as against highly hydrophobic for pure PLGA microfibers), which was hypothesized to be the reason for rendering the surface relatively more favorable for protein interaction.
Protein adsorption and release study
To understand the influence of improved surface hydrophilicity (moderate hydrophobicity) of blended PLGA microfibers on protein interaction, protein adsorption and release studies were performed as the first set of studies.
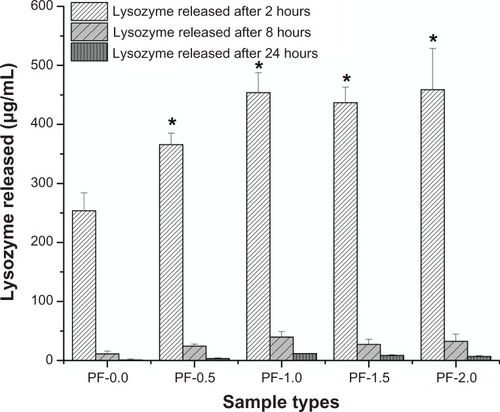
The release of adsorbed BSA and lysozyme from PF-108 blended and unblended PLGA meshes were quantified for three different time points, ie, at 2, 8, and 24 hours. and are plots of the amount of protein released (μg/mL) as a function of time for all the sample types (PF-0.0, PF-0.5, PF-1.0, PF-1.5, and PF-2.0). demonstrates that the amount of BSA released at 2 hours from all PF-108 (0.5%–2.0%) blended PLGA meshes was more than two times that of the BSA released from unblended PLGA meshes. However, no significant difference in amount of released BSA (55–65 μg) was observed amongst the blended samples at the 2-hour time point. In all samples (blended and unblended), approximately 95% of adsorbed BSA was released during the first 2 hours, and no significant release was observed at the 8-hour and 24-hour time points. Similar results were obtained when lysozyme was used as a model protein for adsorption studies (). Except for the PF-0.5 blended meshes, all other PF-108 blended PLGA meshes (PF-1.0, PF-1.5, and PF-2.0) showed close to two times the amount of lysozyme released (90% increase) as compared with the unblended PLGA microfiber meshes. Like BSA, lysozyme also showed a burst release (about 95% of total adsorbed lysozyme) during the first two hours followed by marginal release of lysozyme at the 8-hour and 24-hour time points. Interestingly, the amount of lysozyme adsorbed (as quantified by the release study) was significantly higher than the amount of BSA released for both unblended and blended PLGA microfiber meshes. For the unblended samples, the amount of protein released at the 2-hour time point was 26 μg/mL for BSA and 250 μg/mL for lysozyme, indicating a near 10-fold increase in the amount of released protein for lysozyme, whereas for the blended samples the released protein ranged from 55 to 65 μg/mL for BSA and from 350 to 450 μg/mL for lysozyme, indicating a 7–9-fold increase in the amount of released lysozyme. This indicates that the increase in amount of released lysozyme was irrespective of the presence or absence of PF-108. The possible reason for a higher amount of released lysozyme could be its relatively smaller size (14.5 kDa for lysozyme and 66 kDa for BSA), which probably enabled adsorption of more protein per unit area of the microfibrous surface.
Figure 2 Plot of bovine serum albumin released from PF-0.5 to PF-2.0 blended PLGA microfibrous meshes and pure PLGA microfibrous mesh (control) as a function of time (2, 8, and 24 hours).
Note: *P < 0.001 between unblended PLGA and PF-108 blended PLGA samples at the 2-hour time point.
Abbreviations: PF, Pluronic® F; PLGA, polylactide-co-glycolide; BSA, bovine serum albumin.
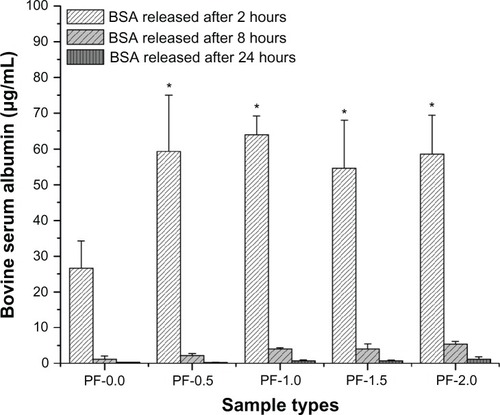
Figure 3 Plot of lysozyme released from PF-0.5 to PF-2.0 blended PLGA microfibrous meshes and pure PLGA microfibrous mesh (control) as a function of time (2, 8, and 24 hours).
Note: *P < 0.001 between unblended PLGA and PF-108 blended PLGA samples at the 2-hour time point.
Abbreviations: PF, Pluronic® F; PLGA, polylactide-co-glycolide.
Irrespective of the protein used, the PF-108 blended samples showed a significantly higher protein release as compared with the unblended PLGA samples. This could be attributed to the change in chemical composition and consequent surface hydrophilicity of the blended microfibers. PF-108 is a block copolymer of two different monomers, ie, ethylene glycol (EO) and propylene glycol (PO) and was chosen because it contains 82.2% of EO units and 17.8% of PO units, which makes it hydrophilic in nature. Previous literature has shown that when PF-108 was blended with a hydrophobic polymer (such as PLGA), conformation of PF-108 at the surface was such that the hydrophobic PO units associate with hydrophobic PLGA and the hydrophilic EO units protrude outward ().Citation36–Citation38 It has also been shown that when PF-108 is present on the surface in low concentrations, the EO units arrange in a mushroom shape that enables primary and secondary adsorption of proteins () whereas at higher PF-108 concentrations, the EO units arrange in a densely packed brush-shaped structure, which leads to reduced protein adsorption on its surface (ie, a nonfouling surface).Citation39 In a previous study, we have demonstrated that the percentage accumulation of PF-108 on PLGA microfiber surfaces did not exceed 33% (2.0% PF-108).Citation20 Therefore, because the PF-108 coverage on the microfiber surfaces was partial, it was speculated that the EO units would take on the mushroom conformation that allowed more proteins (primary on material surface and secondary on protein mushroom conformation) to be adsorbed on the blended microfiber surfaces. Further, both the proteins (BSA and lysozyme) possess a predominantly hydrophilic external surface that can facilitate the secondary adsorption of proteins on the mushroom conformation.
Figure 4 Schematic of PF-108 conformation in/on PLGA microfiber surface. (A) Structure of PF-108 depicting ethylene oxide and propylene oxide domains. (B) Conformation of PF-108 before exposure of water to PF-108 blended PLGA microfiber surface. (C) Conformation of PF-108 after exposure of water to PF-108 blended PLGA microfiber surface. The ethylene oxide component of PF-108 takes on a mushroom-shaped conformation, whereas the propylene oxide component of PF-108 remains embedded in the PLGA microfiber. (D) Noninteracting mushroom-shaped conformations of ethylene oxide on PLGA microfiber surface at lower concentrations of PF-108. (E) Brush-shaped conformations of ethylene oxide on PLGA microfiber surface at higher concentrations of PF-108.
Abbreviations: PF, Pluronic® F; PLGA, polylactide-co-glycolide; EO, ethylene oxide; PO, propylene oxide.
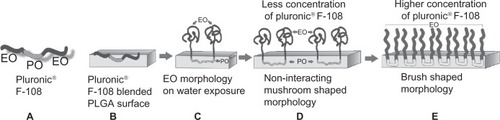
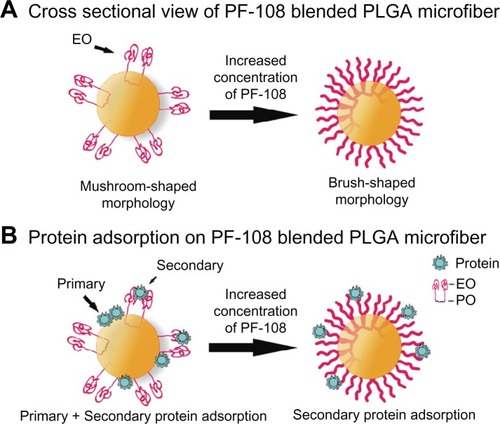
Figure 5 Schematic depicting the cross-sectional view of PF-108 conformation in/on PLGA microfiber surface. (A) Change in conformation of ethylene oxide units of PF-108 from mushroom-shaped to brush-shaped conformation with increase in surface density of PF-108 on PLGA microfiber surface. (B) Primary and secondary protein adsorption behavior on mushroom-shaped and brush-shaped ethylene oxide units.
Abbreviations: PF, Pluronic® F; PLGA, polylactide-co-glycolide; EO, ethylene oxide; PO, propylene oxide.
Taken together, the release studies ( and ) demonstrated that a change in surface composition (hydrophilicity) allowed for enhanced accessibility of water molecules, which eventually enabled more protein molecules to interact and adsorb on blended microfiber surfaces.
Secondary structure analysis of proteins
Protein adsorption on biomaterial surfaces is a complex process and can involve multiple noncovalent interactions, such as van der Waals, hydrophobic, and electrostatic interactions, as well as hydrogen bonding. These noncovalent interactions are primarily governed by the protein type and surface properties of the biomaterial. Depending on the surface chemistry of the biomaterial (hydrophilic/hydrophobic, charged/uncharged surfaces), proteins when adsorbed onto the biomaterial surfaces can undergo changes in conformation and/or orientation which in turn can influence its bioactivity.Citation40 Therefore, estimating the conformational change of adsorbed proteins would be desirable for designing a new biomaterial surface because the protein conformation has direct implications for biomaterial-cell interactions. Although PLGA-based biomaterial surfaces have been studied for their interactions with a variety of proteins,Citation30,Citation41,Citation42 the PF-108 blended PLGA microfiber meshes have not be studied for their interactions with proteins. Therefore, in this set of experiments, proteins were studied for change in their secondary structure as a result of their interaction with blended and unblended PLGA microfibrous meshes.
Two model proteins, BSA and lysozyme, that differed in properties, such as size, function, and secondary structure, were chosen in order to enable a better understanding of protein-fiber surface interactions. BSA is a 66 kDa abundantly available transporter protein, the crystal structure of which has not yet been determined by x-ray diffraction techniques. However, previous studies using circular dichroism spectroscopy and FTIR spectroscopy have reported the secondary structure of BSA in its powdered form.Citation30,Citation33 These studies showed that the α-helical content in the secondary structure of BSA ranged from 52% to 68%. Another strategy to arrive at the secondary structure of BSA would be to draw a parallel with the secondary structure of a sequentially (80% homology) and functionally similar protein, such as human serum albumin. Therefore, one can use the known secondary structure details of human serum albumin to extrapolate it for the estimation of the secondary structure of BSA.Citation43 In this study, we used the secondary structure information for BSA obtained using spectroscopic techniques (α-helical content 52%–68%) due to its significant overlap with the secondary structure information obtained from the human serum albumin extrapolation method (α-helical content 60%–73%).
The second model protein used was hen egg white lysozyme, a small globular protein having a molecular weight of 14.5 kDa. The secondary structure of lysozyme as obtained from the Protein Data BankCitation44 had an α-helical content of 34%–42% and a β-sheet content of 7%–12%.
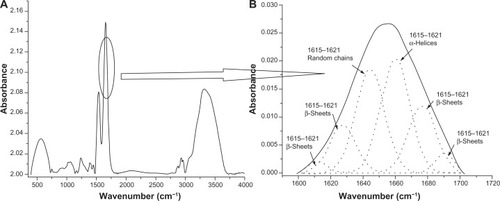
In this study, deconvolution of FTIR spectra was used for the determination of secondary structures of free powder, adsorbed, and released proteins.Citation33,Citation45 To affirm the use of a deconvolution procedure of FTIR spectra for secondary structure estimation, the secondary structure of lyophilized lysozyme powder as determined using the deconvolution technique was compared with the secondary structure of lysozyme obtained from the Protein Data Bank (the DSSP program was used to predict the secondary structure). More than 20 Protein Data Bank structures of lysozyme resolved by various techniques, including x-ray diffraction, and liquid and solid nuclear magnetic resonance spectroscopy, were selected to quantify the content of the secondary structure. The secondary structure content obtained from both methods, ie, Protein Data Bank and deconvolution, is listed in . Secondary structure was classified into three major categories, ie, α-helices, β-sheets, and random chains (which include loops and random chains). A comparison between the secondary structure content obtained from the Protein Data Bank and deconvolution demonstrated that the percentage of α-helices decreased from 34%–42% for experimentally determined secondary structures to about 31% for secondary structures determined by deconvolution (). Conversely, the β-sheet content increased from 7%–12% for experimentally determined secondary structures to approximately 20% for secondary structures determined by deconvolution (). A probable explanation for the observed differences may be the usage of lyophilized lysozyme powder for deconvolution. It has previously been reported that the lyophilization procedure can cause reversible changes in protein conformation and is associated with reduction in the α-helical content and increase in the β-sheet/random chain content.Citation46 Therefore, in the current study, reduction in α-helical content and increase in β-sheet content was speculated to be due to lyophilization of lysozyme powder. Since the secondary structure predictions made using the deconvolution procedure were found to be approximately accurate, use of the deconvolution technique for secondary structure determination was considered to be validated.
Table 1 Secondary structure of lysozyme content as determined by experimental and deconvolution techniques
Figure 6 Deconvolution spectra of lysozyme amid I peak (1600–1700 cm −1). (A) Complete Fourier transform infrared spectrum of lyophilized lysozyme powder. (B) Zoomed view of amid I peak (solid line in spectrum depicts the amid I region and the dotted lines depict deconvoluted Gaussian peaks of various secondary structures of lysozyme).
Conformation of protein structure can be of biological significance both in the adsorbed state and when released from a biomaterial surface. In the adsorbed state, proper orientation of proteins influences cell interactions (especially scaffolds in tissue engineering), whereas in the free/released state, proper conformation would enable the bioactive form of proteins. Therefore, in this study, BSA and lysozyme were characterized for their secondary structure in both the adsorbed and released states. Because both the proteins were α-helical proteins, a change in α-helical content would be a strong indicator of change in structural conformation, and protein function as a consequence. The estimated values for α-helical content for BSA and lysozyme both in adsorbed and released states are shown in . The secondary structure information of powdered (free state) BSA and lysozyme was used as a control. As is evident from , adsorbed BSA (on blended and unblended PLGA samples) showed an increase (2%–10%) in α-helical content when compared with powdered BSA. This indicated that the adsorbed state of BSA had a slightly higher α-helical content as compared with the free protein, irrespective of the material surface. Since the native structure of BSA has an α-helical content of 52%–68%, the observed α-helical content in adsorbed BSA has a relatively lesser deviation from the native structure as compared with the free (powder) protein. This improvement in α-helical content as compared with free protein was speculated to be due to surface-mediated structural stability. However, marginal differences in the α-helical content of adsorbed BSA were observed between the PF-108 blended and unblended surfaces, except for the PF-1.5 blended sample. This indicated, that irrespective of the material surface, the change in secondary structure of adsorbed BSA was not significantly different.
Table 2 Percentage α-helical content of adsorbed and released bovine serum albumin and lysozyme from PF-108 blended and unblended PLGA microfibers (percentage α-helical content of powdered bovine serum albumin and lysozyme were taken as controls)
Similar to the adsorbed state, the BSA released also showed an increase (3%–7%) in α-helical content as compared with free BSA. However, there was a small drop in the α-helical content for most of the samples from the adsorbed state to the released state. It is speculated that this reduction in α-helical content was probably due to the absence of the polymeric surface. Although there was a small reduction in α-helical content from the adsorbed state to the released state, the α-helical content in the released state remained higher than that of nonadsorbed (powder) BSA. This indicated that the released state had a relatively smaller deviation from the native state as compared with free BSA. Overall, a decreasing trend of α-helical content was observed for BSA from the native state (52%–68%)>adsorbed state (34%–42%)>released state (35%–39%)>powdered state (32%). It was also observed that there was a difference in α-helical content for the powdered state and the released state that in principle should have a similar α-helical content. This probably indicated that the changes in conformation that occurred during the process of adsorption were not fully reversed upon release (ie, some changes at the secondary structure were probably maintained).
Similar to BSA, the α-helical content of lysozyme was also estimated in the adsorbed and released state. There were no significant differences observed in the α-helical content of adsorbed lysozyme for PF-108 blended and nonblended meshes. Similarly, in comparison with free lysozyme, lysozyme adsorbed on PF-108 blended and unblended PLGA microfibrous meshes showed marginal differences in α-helical content. The results for the released lysozyme were similar to those observed for the adsorbed lysozyme. However, in both situations (adsorbed and released) the deviation in α-helical content as compared with the native structure obtained from the Protein Data Bank (34%–42% α-helix) was very small. In contrast, BSA showed ≥10% reduction in α-helical content. The possible reason for the relatively better structural stability of lysozyme could be its smaller size. It has been reported that an increase in protein concentration leads to a decrease in protein spreading and promoted reorganization of previously adsorbed protein molecules.Citation47 Similarly, in this study, it was observed that a higher concentration of lysozyme enabled higher densities of adsorbed lysozyme (), that probably leads to a smaller contact area per protein molecule and hence discourages spreading on the microfiber surface, whereas for BSA the large size of the protein probably enabled a higher contact area with the microfiber surface and as a consequence encouraged spreading. It has been reported previously that spreading of BSA on biomaterial surfaces discourages further adsorption of BSA molecules, limiting the possibility of reorganization/compaction of adsorbed BSA molecules in a time-dependent manner.Citation47 These previously reported studies support our observations of a marginal change in α-helical content of adsorbed BSA (), which was probably due to spreading of BSA and a relatively lesser amount of adsorbed BSA (), which was probably due to the spreading that discouraged further adsorption of BSA. Overall, the previous two studies ( and , ) demonstrated that although there was no significant change in the secondary structure of proteins when adsorbed on the blended and unblended PLGA microfibrous surfaces, the amount of adsorbed protein on the blended surfaces was approximately twice that of the unblended surfaces. This indicates that surface hydrophilization of PLGA microfibers via blending with PF-108 enhanced protein adsorption while maintaining the secondary structure of the adsorbed protein.
Lysozyme bioactivity assay
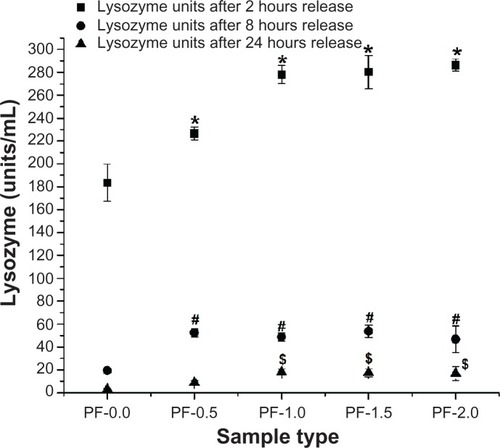
After confirming the ability of PF-108-modified PLGA microfiber surfaces to adsorb higher amounts of protein with minimal change in their secondary structure after adsorption, a bioactivity assay was performed in order to determine if the protein adsorbed on the modified surfaces was biologically active. For these studies, lysozyme adsorbed on PF-108-blended and unblended PLGA microfiber meshes was subjected to a release assay. The lysozyme released at variable time points (2, 8, and 24 hours) was used for a bacterial cell lysis-based bioactivity assay. Lysozyme released from unblended PLGA microfiber meshes was used as a control (to understand the effect of pure PLGA surface alone and for comparison with the PF-108 blended surface) in these experiments. is a plot of the bioactivity of lysozyme (units/mL) released from 0.5%–2.0% PF-108-blended and unblended PLGA microfiber meshes as a function of time. After the first two hours of release, the blended samples released 226–286 units of lysozyme, whereas the unblended PLGA samples released 183 units of lysozyme. This observation corroborates the results of the lysozyme release study () wherein a similar trend was observed. However, the extent of the differences observed between blended and unblended samples was greater for the release study than for the bioactivity study. Similar trends were observed at subsequent time points of 8 and 24 hours. However, the extent of the differences observed between blended and unblended samples decreased at subsequent time points, with the 2-hour time point showing the most prominent difference and the 24-hour time point showing a marginal difference. Further, when the units of lysozyme released at the 2-hour time point were converted to percentage bioactivity, it was observed that all samples (blended and unblended) showed more than 80%–85% bioactivity. It is speculated that the minimal changes in secondary structure () did not cause a significant change in percentage bioactivity of both adsorbed and released lysozyme. Therefore, this study demonstrates that the process of adsorption and release of lysozyme on PF-108 blended and unblended PLGA microfiber samples does not significantly compromise bioactivity.
Figure 7 Enzymatic activity of lysozyme (units/mL) released from 0.5%–2.0% PF-108 blended and unblended PLGA microfiber meshes.
Notes: *P < 0.001 (except PF-0.5, P < 0.01) between unblended PLGA and PF-108 blended PLGA samples at the 2-hour time point. #P < 0.001 (except PF-1.0 and PF-2.0, P < 0.01) between unblended PLGA and PF-108 blended PLGA samples at the 8-hour time point. §P < 0.01 between unblended PLGA and PF-108 blended PLGA samples at the 24-hour time point.
Abbreviations: PF, Pluronic® F; PLGA, polylactide-co-glycolide.
Conclusion
In our previous studies, we demonstrated that fabrication of electrospun PLGA microfibrous meshes by blending with small quantities of PF-108 (0.5%–2.0%) enabled a significant change in surface hydrophilicity while maintaining or improving the physical properties of native PLGA. Further, it was demonstrated that these hydrophilized PLGA microfibers preferentially interacted with water, leading to increased water absorption. Based on these findings, it was hypothesized that increased wettability should result in increased adsorption of protein from aqueous solution. The current study focused on trying to understand the influence of the presence/absence as well as the extent of surface hydrophilization (via blending with PF-108) of electrospun PLGA microfibrous meshes on protein (BSA and lysozyme) adsorption/release, secondary structure, and function. The BSA and lysozyme adsorption study demonstrated that, irrespective of type of protein, the PF-108 blended microfiber samples showed a significantly higher protein release as compared with the unblended PLGA microfiber samples. However, in comparison with BSA, lysozyme showed a 7–9-fold increase in release that was speculated to be due to its smaller size and hence greater adsorption. In order to understand the influence of change in surface properties of PLGA microfibers on secondary structure (conformation) of adsorbed protein, FTIR spectroscopy was used. Deconvolution analysis of amid I spectra demonstrated that irrespective of surface, fibrous meshes showed a small improvement in secondary structure (α-helical content) of adsorbed BSA as compared with BSA in the free powder state, whereas lysozyme did not show any significant changes in its secondary structure in the adsorbed or powder state. Further, the bioactivity assay of lysozyme released from adsorbed microfiber surfaces showed a bioactivity of 80%–85%. This demonstrated that the process of adsorption and release of lysozyme from blended PLGA microfiber meshes did not significantly affect the bioactivity of lysozyme. Overall, these studies demonstrated that PF-108 blended PLGA microfibrous meshes not only increased the amount of adsorbed protein but also maintained the structural and functional integrity of the adsorbed protein. Hence, the strategy of blending triblock copolymers such as PF-108 with PLGA for surface modification of electrospun PLGA microfiber meshes could be a viable strategy for improving protein interaction, adsorption, and downstream cell interaction in tissue engineering applications.
Acknowledgements
The authors would like to acknowledge the Department of Biotechnology, Government of India and the Indian Institute of Technology, Kanpur, for providing financial support for conducting this study. DSK would like to acknowledge the “Batch of 1970 Research Fellowship” and RV acknowledges the Council of Scientific and Industrial Research for his research fellowship.
Disclosure
The authors report no conflicts of interest in this work.
References
- ChandraRRustgiRBiodegradable polymersProg Polym Sci199823712731335
- NairLSLaurencinCTBiodegradable polymers as biomaterialsProg Polym Sci2007328–9762798
- KimBSMooneyDJDevelopment of biocompatible synthetic extracellular matrices for tissue engineeringTrends Biotechnol19981652242309621462
- GrafahrendDHeffelsKHMollerMKleeDGrollJElectrospun, biofunctionalized fibers as tailored in vitro substrates for keratinocyte cell cultureMacromol Biosci20101091022102720602418
- GrafahrendDHeffelsK-HBeerMVDegradable polyester scaffolds with controlled surface chemistry combining minimal protein adsorption with specific bioactivationNat Mater2010101677321151163
- VasitaRKattiDSNanofiber and their application in tissue engineeringInt J Nanomedicine200611153017722259
- ShinHJLeeCHChoIHElectrospun PLGA nanofiber scaffolds for articular cartilage reconstruction: mechanical stability, degradation and cellular responses under mechanical stimulation in vitroJ Biomater Sci Polym Ed2006171–210311916411602
- TohY-CNgSKhongYMCellular responses to a nanofibrous environmentNano Today2006133443
- WanYChenWYangJBeiJWangSBiodegradable poly(-lactide)-poly(ethylene glycol) multiblock copolymer: synthesis and evaluation of cell affinityBiomaterials200324132195220312699655
- LeeJHKhangGLeeJWLeeHBInteraction of different types of cells on polymer surfaces with wettability gradientJ Colloid Interface Sci199820523233309735195
- ArimaYIwataHEffects of surface functional groups on protein adsorption and subsequent cell adhesion using self-assembled monolayersJ Mater Chem2007173840794087
- ArimaYIwataHEffect of wettability and surface functional groups on protein adsorption and cell adhesion using well-defined mixed self-assembled monolayersBiomaterials200728203074308217428532
- LiebETessmarJHackerMPoly(D,L-lactic acid)-poly(ethylene glycol)-monomethyl ether diblock copolymers control adhesion and osteoblastic differentiation of marrow stromal cellsTissue Eng200391718412625956
- LeeJHKhangGSLeeJWLeeHBInteractions of proteins and cells on functional group gradient surfacesMacromol Symp1997118571576
- KarlssonMEkerothJElwingHCarlssonUReduction of irreversible protein adsorption on solid surfaces by protein engineering for increased stabilityJ Biol Chem200528027255582556415857836
- AllenLTTosettoMMillerISSurface-induced changes in protein adsorption and implications for cellular phenotypic responses to surface interactionBiomaterials200627163096310816460797
- McPhersonTKidaneASzleiferIParkKPrevention of protein adsorption by tethered poly(ethylene oxide) layers: experiments and single-chain mean-field analysisLangmuir1998141176186
- BhattaraiSRBhattaraiNViswanathamurthiPYiHKHwangPHKimHYHydrophilic nanofibrous structure of polylactide; fabrication and cell affinityJ Biomed Mater Res A200678224725716628710
- Vargha-ButlerEIKissELamCNCWettability of biodegradable surfacesColloid Polym Sci20012791211601168
- VasitaRManiGAgrawalCMKattiDSSurface hydrophilization of electrospun PLGA micro-/nano-fibers by blending with Pluronic® F-108Polymer20105137063714
- VasitaRShanmugamKKattiDSDegradation behavior of electrospun microfibers of blends of poly(lactide-co-glycolide) and Pluronic® F-108Polym Degrad Stab201095916051613
- TsungMJBurgessDPreparation and characterization of gelatin surface modified PLGA microspheresAAPS Pharm Sci2001321424
- ManningMCUse of infrared spectroscopy to monitor protein structure and stabilityExpert Rev Proteomics20052573174316209652
- KongJYuSFourier transform infrared spectroscopic analysis of protein secondary structuresActa Biochim Biophys Sin (Shanghai)200739854955917687489
- HarisPISevercanFFTIR spectroscopic characterization of protein structure in aqueous and non-aqueous mediaJ Mol Catal B Enzym199971–4207221
- CastilloEJKoenigJLAndersenJMLoJCharacterization of protein adsorption on soft contact lenses: I. Conformational changes of adsorbed human serum albuminBiomaterials1984563193256525391
- ChitturKKFTIR/ATR for protein adsorption to biomaterial surfacesBiomaterials1998194–53573699677150
- CastilloEJKoenigJLAndersonJMLoJProtein adsorption on hydrogels: II. Reversible and irreversible interactions between lysozyme and soft contact lens surfacesBiomaterials1985653383454052547
- LundqvistMSethsonIJonssonB-HProtein adsorption onto silica nanoparticles: conformational changes depend on the particles curvature and the protein stabilityLangmuir20042024106391064715544396
- FuKGriebenowKHsiehLKlibanovAMRobertLFTIR characterization of the secondary structure of proteins encapsulated within PLGA microspheresJ Control Release199958335736610099160
- ZhangJYanY-BProbing conformational changes of proteins by quantitative second-derivative infrared spectroscopyAnal Biochem20053401899815802134
- Baujard-LamotteLNoinvilleSGoubardFMarquePPautheEKinetics of conformational changes of fibronectin adsorbed onto model surfacesColloids Surf B Biointerfaces200863112913718249527
- RoachPFarrarDPerryCCInterpretation of protein adsorption: surface-induced conformational changesJ Am Chem Soc2005127228168817315926845
- GorinGWangSFPapapavlouLAssay of lysozyme by its lytic action on M. lysodeikticus cellsAnal Biochem19713911131275544583
- PerevedentsevaECaiPJChiuYCChengCLCharacterizing protein activities on the lysozyme and nanodiamond complex prepared for bio applicationsLangmuir20112731085109121192695
- ShiQYeSKristalynCSuYJiangZChenZProbing molecular-level surface structures of polyethersulfone/pluronic F127 blends using sum-frequency generation vibrational spectroscopyLangmuir200824157939794618616306
- VermettePMeagherLInteractions of phospholipid- and poly(ethylene glycol)-modified surfaces with biological systems: relation to physico-chemical properties and mechanismsColloids Surf B Biointerfaces2003282–3153198
- LiJ-TCaldwellKDRapoportNSurface properties of pluronic-coated polymeric colloidsLangmuir1994101244754482
- DamodaranVBFeeCJPopatKCPrediction of protein interaction behaviour with PEG-grafted matrices using x-ray photoelectron spectroscopyAppl Surf Sci20102561648944901
- ElwingHNilssonBSvenssonK-EAskendahlANilssonURLundströmIConformational changes of a model protein (complement factor 3) adsorbed on hydrophilic and hydrophobic solid surfacesJ Colloid Interface Sci19881251139145
- VasitaRKattiDSGrowth factor-delivery system for tissue engineering: a materials perspectiveExpert Rev Med Devices200631294716359251
- VasitaRShanmugamKKattiDSImproved biomaterials for tissue engineering applications: surface modification of polymersCurr Top Med Chem20088434135318393896
- YampolskayaGPTarasevichBNElenskiiAASecondary structure of globular proteins in adsorption layers at the solution-air interface by the data of fourier transform IR spectroscopyColloid J2005673385391
- BermanHMWestbrookJFengZThe Protein Data Bank. Nucleic Acids Res200028235242 Protein Data Bank identifiers for lysosyme: 3AQQ, 3A8Z, 3A96, 1IVM, 16XX, 1FOW, 1LYS, 1XFT, 1JA4; for bovine serum albumin: 3JRY, 2VUF, 2I30, 2BX8, 3JQZ, 2BXF, 1N5U, 1E78. Available from: www.pdb.org. Accessed December 6, 2011.
- RoachPFarrarDPerryCCSurface tailoring for controlled protein adsorption: effect of topography at the nanometer scale and chemistryJ Am Chem Soc20061283939394516551101
- GriebenowKKlibanovAMLyophilization-induced reversible changes in the secondary structure of proteinsProc Natl Acad Sci U S A1995922410969109767479920
- IshiguroRYokoyamaYMaedaHShimamuraAKameyamaKHiramatsuKModes of conformational changes of proteins adsorbed on a planar hydrophobic polymer surface reflecting their adsorption behaviorsJ Colloid Interface Sci200529019110116122545