
Abstract
Silica nanoparticles can be efficiently employed as carriers for therapeutic drugs in vitro. Here, we use zebrafish embryos as a model organism to see whether mesoporous silica nanoparticles (MSNPs) can be incorporated to deliver compounds in vivo. We injected 35–40 nL (10 mg/mL) of custom-synthesized, fluorescently-tagged 200 nm MSNPs into the left flank, behind the yolk sac extension, of 2-day-old zebrafish embryos. We tracked the distribution and translocation of the MSNPs using confocal laser scanning microscopy. Some of the particles remained localized at the injection site, whereas others entered the bloodstream and were carried around the body. Embryo development and survival were not significantly affected by MSNP injection. Acridine orange staining revealed that MSNP injections did not induce significant cell death. We also studied cellular immune responses by means of lysC::DsRED2 transgenic embryos. MSNP-injected embryos showed infiltration of the injection site with neutrophils, similar to controls injected with buffer only. In the same embryos, counterstaining with L-plastin antibody for leukocytes revealed the same amount of cellular infiltration of the injection site in embryos injected with MSNPs or with buffer only. Next, we used MSNPs to deliver two recombinant cytokines (macrophage colony-stimulating factor and receptor for necrosis factor ligand) to zebrafish embryos. These proteins are known to activate cells involved in bone remodeling, and this can be detected with the marker tartrate-resistant acid phosphatase. Coinjection of these proteins loaded onto MSNPs produced a significant increase in the number of tartrate-resistant acid phosphatase-positive cells after 2–3 days of injection. Our results show that MSNPs can be used to deliver bioactive compounds into zebrafish larvae without producing higher mortality or gross evidence of teratogenicity.
Acknowledgments
We would like to thank GEM Lamers for her great help and cooperation with confocal imaging; PJ Steenbergen, U Nehrdich, and DNJ de Witt for fish care and maintenance; and MAG de Bakker for expert technical assistance. The lyz::DsRED2 line was kindly provided by Dr P Crosier (University of Auckland, Auckland, New Zealand), and the L-plastin antibody was a gift from Dr A Huttenlocher (University of Wisconsin, Madison, WI). The authors gratefully acknowledge the support of the SmartMix Program of the Netherlands Ministry of Economic Affairs and the Netherlands Ministry of Education, Culture, and Science.
Disclosure
The authors report no conflicts of interest in this work.
Supplementary information
Silica nanoparticles as a compound delivery system in zebrafish embryos
Fluorescent labeling of bovine serum albumin and loading of mesoporous silica nanoparticles
To detect the release of protein from silica nanoparticles, bovine serum albumin (BSA), a protein of 66 kDa, was used instead of receptor for necrosis factor ligand (RANK-L) and macrophage colony-stimulating factor (M-CSF) human recombinant proteins. This is because it is commercially available in much larger quantities and at much lower cost than the cytokines used in this study. BSA (50.2 mg, 0.7 μmol) was dissolved in 20 mL of 0.1 M sodium bicarbonate solution, pH 9.0. A solution 0.1 mM of fluorescein-5(6) isothiocyanate (FITC) isomer 1 was prepared in dimethyl sulfoxide, and 5 mL of this solution was added in drops to the protein solution and stirred at room temperature for 2 hours, followed by 12 hours at 4°C. After this, 42 mg of ammonium chloride was added to the solution, and the mixture was stirred for another 2 hours at room temperature. The resulting FITC-labeled protein was then purified via dialysis using a dialysis membrane with a cut-off of 10,000 MW. After freeze drying, the labeled protein was recovered as an orange solid, yielding 82% (41.164 mg, 0.574 μmol) of final product. The isolated FITC-BSA was then characterized via ultraviolet-visible (UV-vis) absorption spectroscopy, and the labeling efficiency was determined to be 1.5 moles FITC per 1 mole of protein. The UV-vis absorbance spectra were measured with a UV-vis spectrophotometer (Perkin-Elmer Ltd, Beaconsfield, UK).
Analysis of zebrafish embryos
Mortality
The number of dead embryos was recorded every 24 hours for up to 3 days after injection.
Morphology
The live larvae were analyzed for malformations, namely edema of the pericardium and/or yolk sac, microphthalmia, and abnormal body curvature, every 24 hours. Furthermore, gross abnormalities of the chondral skeleton were assessed in 5-dayold zebrafish embryos fixed and Alcian blue-stained larvae.
Cell death
For necrosis assay the larvae from both the treatment and control groups 24 hours post injection were live stained with 5 mg/L acridine orange solution in egg water for 30 minutes in the dark. They were then assessed with confocal microscopy at an excitation wavelength of 488 nm to count the number of positive cells in the entire body of the living larva. The necrotic cells were counted from the confocal images after z stack was flattened to get a clear picture of all the cells through the thickness of the embryo.
Alcian blue staining
The larvae were fixed at 5 days post fertilization (dpf) in 4% paraformaldehyde in PBS at 4°C overnight, then rinsed in Milli-Q water 5 × 5 minutes and dehydrated in a graded series of ethanols (25%, 50%, 70%), rinsed in acid alcohol (1% concentrated hydrochloric acid in 70% ethanol) for 10 minutes, and placed in filtered Alcian blue solution (0.03% Alcian blue) in acid alcohol for 1 hour. They were then washed 2 × 30 minutes in distilled water, cleared in 70% glycerol, and stored until imaging. Twenty-five embryos each from the treatment and control groups were observed.
Morphometric analyses of cell death, neutrophil, leukocyte/macrophage, and tartrate-resistant acid phosphatase-positive cells
Acridine orange-stained cells were counted from confocal images of whole zebrafish embryos under anesthesia (MS222). Ten embryos each were used for morphometric analyses per group (ie, treatment and control). Similarly, tartrate-resistant acid phosphatase-positive cells were counted manually under a compound microscope. The cell count was done for seven embryos per group for both types of cells (lysozyme-positive neutrophils and L-plastin-positive leukocytes). For acridine orange and tartrate-resistant acid phosphatase, cells in the entire body of the embryo were counted. For immune cells, only the area around the injection site was counted.
Figure S1 Morphometric analysis of immune cells in lysC::DsRED2 transgenic embryos. (A) Number of neutrophils 2 days post-injection (dpi) of phosphate-buffered saline (PBS) (veh) and mesoporous silica nanoparticles (MSNPs). (B) L-plastin+ leukocytes 2 dpi of PBS (veh) and MSNPs.
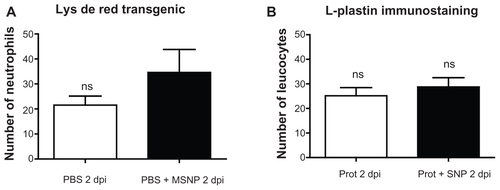
Figure S2 (A) Number of neutrophils 2 and 3 days post injection (dpi) with proteins (prot) or mesoporous silica nanoparticles (prot+MSNP). (B) Number of neutrophils 2 dpi and 3 dpi of phosphate-buffered saline (PBS) and protein. (C) Number of neutrophils 2 dpi and 3 dpi of MSNPs with or without proteins. (D) Number of leukocytes 2 dpi or 3 dpi of MSNP+PBS or proteins+MSNP. (E) Number of leukocytes 2 dpi or 3 dpi of protein or protein+MSNP. (F) Number of total leukocytes 2 dpi or 3 dpi of PBS or protein. Note that the protein means the macrophage colony-stimulating factor and receptor for necrosis factor ligand loaded into the nanoparticles, which in turn are suspended in PBS.
Note: *P < 0.1.
Abbreviation: ns, not significant.
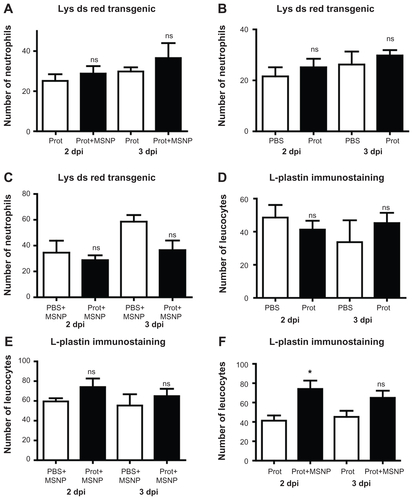
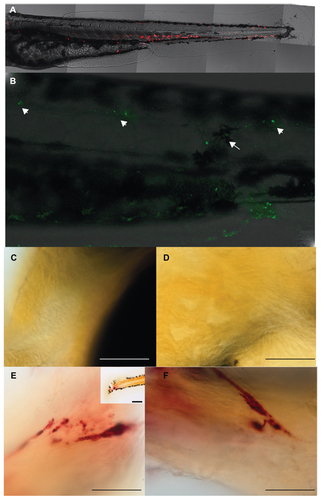
Figure S3 (A) Additional figures showing a control larva without any injection after 24 hours of injection. Neutrophils (red) are normally distributed in the hematopoietic tissue. No cells are found in the tissue of the somites. (B) Embryo showing cell death by acridine orange staining in the posterior region of the body injected with mesoporous silica nanoparticles (MSNPs) after 24 hours of injection. Note here that the arrow shows the MSNPs in the area of injection and arrowheads point toward lateral line organs. (C) Head region of a control larva after tartrate-resistant acid phosphatase (TRAcP) enzyme staining with no TRAcP stained cells. (D) Another view of head region of a control larva after TRAcP enzyme staining with no stained cells. (E) 5 dpf zebrafish larva after cytokine only injection (10 μg/mL M-CSF and 100 μg/mL RANK-L) without using MSNPs. Tartrate-resistant acid phosphatase enzyme staining reveals a highly increased TRAcP expression in the tail region (scale bar = 20 μm); inset shows the posterior region of the same larva at a low magnification (scale bar = 100 μm). (F) Another image of the same embryo (scale bar = 20 μm).
Supplementary movie 1 Two-days post-fertilization zebrafish embryo injected with fluorescent nanoparticles (green) in the left flank behind yolk sac extension showing the movement and distribution of mesoporous silica nanoparticles for the first 2.5 hours after injection. There was an interval of 10 minutes between each frame. Available from: http://youtu.be/mPsLIGAApUg.
Supplementary movie 2 A different, 2-days post-fertilization zebrafish embryo, injected with fluorescent nanoparticles (green) in the left flank behind yolk sac extension showing the movement and distribution of mesoporous silica nanoparticles later than 2.5 hours. The recording was done from 2.5 hours post injection to 5 hours post injection. There was an interval of 10 minutes between each frame. Available from: http://youtu.be/_6sY-110_Oc
Reference
- LyubchenkoYLGallAAShlyakhtenkoLSAtomic force microscopy imaging of double stranded DNA and RNAJ Biomol Struct Dyn1992105896061492926