Abstract
Interactions between blood platelets and nanoparticles have both pharmacological and toxicological significance and may lead to platelet activation and aggregation. Platelet aggregation is usually studied using light aggregometer that neither mimics the conditions found in human microvasculature nor detects microaggregates. A new method for the measurement of platelet microaggregation under flow conditions using a commercially available quartz crystal microbalance with dissipation (QCM-D) has recently been developed. The aim of the current study was to investigate if QCM-D could be used for the measurement of nanoparticle-platelet interactions. Silica, polystyrene, and gold nanoparticles were tested. The interactions were also studied using light aggregometry and flow cytometry, which measured surface abundance of platelet receptors. Platelet activation was imaged using phase contrast and scanning helium ion microscopy. QCM-D was able to measure nanoparticle-induced platelet microaggregation for all nanoparticles tested at concentrations that were undetectable by light aggregometry and flow cytometry. Microaggregates were measured by changes in frequency and dissipation, and the presence of platelets on the sensor surface was confirmed and imaged by phase contrast and scanning helium ion microscopy.
Introduction
Humans have been increasingly exposed to nanoparticles (NPs) throughout their evolutionary phases, particularly in the past century due to the industrial revolution. Interestingly, epidemiological studies have demonstrated an association between exposure to ambient NPs and increased cardiovascular morbidity and mortality.Citation1–Citation3 This is because NPs not only deposit in the respiratory tract but may also translocate to different organs in the body after penetrating the lung epithelium and entering the systemic circulation.Citation4 Once in blood, the ability of NPs to interact with platelets is critical as it may lead to platelet aggregation and thrombus formation.Citation5,Citation6 In addition, ultrafine NPs are able to translocate from the lungs into the blood stream and directly impact on the clotting system.Citation7
The growing use of nanotechnology in high-tech industries and medicine is likely to increase even further the exposure of humans to engineered NPs by different routes, leading to the translocation of nanomaterials to the vascular system.Citation8
Potential mechanisms responsible for adverse effects of NPs on the vascular system are under investigation. It was previously found that mixed carbon NPs and nanotubes are able to induce platelet aggregation in vitro and, in addition, accelerate the rate of vascular thrombosis in rat carotid artery.Citation6 Furthermore, it has been found that NPs can directly induce cytotoxic morphological changes in human umbilical vein endothelial cells, induction of proinflammatory responses, inhibition of cell growth, and reduction of endothelial nitric oxide synthase.Citation9 Therefore, the design of new nanomaterials biocompatible with the vascular system and platelet function is of particular importance.Citation10
Over the past five decades different methods have been used to study platelet aggregation. O’Brien first reported the use of strong hand lenses with powerful cross illumination to monitor platelet aggregation.Citation11 Later, Born developed a simple spectrophotometer device that recorded changes in light transmission in response to platelet aggregation induced by the addition of agonists to stirred platelets.Citation12 The new method, called light aggregometer, had an important repercussion for platelet research, and similar devices based on measurement of light scattering or electrical impedanceCitation13 are routinely used worldwide. However, these instruments are not sensitive enough to detect the initial aggregation process characterized by the formation of microaggregates.Citation14
A novel method to measure, in real time, ligand- and agonist-induced platelet microaggregation under low flow conditions using a quartz crystal microbalance with dissipation (QCM-D) has recently been developed.Citation15–Citation17
The objective of the present work was to investigate if QCM-D could be used for the measurement of NP-platelet interactions particularly under conditions where both light aggregometry and flow cytometry are not sensitive enough. Results show that QCM-D is a suitable and sensitive device for the detection of NP-induced platelet aggregation.
Material and methods
Reagents
All reagents were purchased from Sigma-Aldrich Corporation (Dublin, Ireland), unless otherwise indicated.
Silica, polystyrene, and gold NPs
Nonporous silica microspheres (10 nm and 50 nm size) and plain polystyrene microspheres (60 nm size) were purchased from Polysciences Europe GmbH (Eppelheim, Germany).
For the preparation of gold NPs, nearly spherical NPs were obtained by reducing gold chloride in a controlled fashion. A slightly modified method of the well-known and frequently used methods to synthesize spherical gold NPs include the Turkevich method and the related Frens method involving the reduction of gold chloride by sodium citrate to produce gold NPs in hot water.Citation18,Citation19 The Turkevich method was revisited recently by Kimling et al.Citation20 However, in the current study slight modifications were made to obtain well-defined monodisperse NPs with low or no aggregation by controlling the temperature around 90°C. Therefore, better NP dispersion was able to be reproduced than in boiling water. An aqueous solution of 1 mmol L−1 chloroauric acid trihydrate (100 mL) was heated to approximately 90°C with stirring. A 170 mmol L−1 sodium citrate aqueous solution (2.82 mL) was rapidly added to the solution with mixing. The color of the solution changed instantly from pale yellow to colorless, to dark blue after approximately 70 seconds, and then to deep red-burgundy after 2 minutes. Stirring and heating of the solution was maintained for 1 hour after the addition of sodium citrate. The heat was then removed and the solution was stirred upon cooling to room temperature.Citation21 The NPs obtained with this procedure had a diameter of around 18 nm and the number of NPs was estimated to be ~5.13 × 10¹⁵ L−1, assuming that all of the initial chloroauric acid was consumed in the process.
The size and zeta potential for all NPs tested was determined using a Zetasizer® Nano ZS (Malvern Instruments Ltd, Malvern, UK) at 37°C using a DTS 1060C clear disposable zeta cell (Malvern Instruments). Measurements were conducted in triplicate at a concentration of 100 μg mL−1 with phosphate buffer solution for silica and polystyrene NPs and at 5 μg mL−1 for gold NPs. The morphology and size of the NPs were confirmed by using an ORION® PLUS helium ion microscope (Carl Zeiss AG, Oberkochen, Germany) and a JEM-2100 transmission electron microscope (JEOL Ltd, Tokyo, Japan).
Blood collection and platelet isolation
Blood was collected from healthy volunteers who had not taken any drugs known to affect the function of platelets for at least 14 days prior to the study. Platelet-rich plasma (PRP) was prepared from blood, as previously described,Citation22 and diluted with phosphate buffer solution at final concentration of 250,000 platelets/μL−1. Platelet-poor plasma (PPP) was obtained by centrifugation of PRP at 15,000 rpm for 10 minutes at room temperature.
Platelet aggregation measured by QCM-D
The principle of analysis of QCM is based on the resonance frequency of a quartz crystal induced by applying an alternating electric field across the crystal. Deposition of mass on the quartz surface decreases the crystal’s oscillation frequency (negative frequency shift). For thin, rigid, and uniformly distributed layers, frequency is proportional to the mass and can be calculated using the Sauerbrey equation.Citation23 Changes in frequency as a result of platelet deposition on quartz crystals using QCM have been reported previously.Citation24–Citation26 However, when a soft or thick layer is bound to the crystal, there is also a high dissipation shift and in this case the mass can be underestimated by measuring only frequency. In fact, the combined information from changes in frequency and dissipation is superior to frequency measurements alone.Citation27,Citation28 Using a QCM-D, both parameters can be monitored simultaneously in real time. Therefore, the formation of thin films of biological materials such as proteins or cells can be characterized by measuring both frequency and dissipation.Citation29,Citation30
The Q-Sense® E4 QCM-D system (Q-Sense AB, Vastra Frolunda, Sweden) has four temperature and flow-controlled modules set up in parallel configuration. Samples are perfused using a peristaltic microflow system (ISM 935; Ismatec SA, Glattbrugg, Switzerland).
For the study of platelet aggregation, polystyrene-coated quartz crystals with a fundamental frequency of 4.95 MHz were used as sensors (Q-Sense) following coating with fibrinogen. For fibrinogen coating, sensors were placed in fibrinogen dissolved in phosphate buffer solution (100 μg mL−1) for 1 hour at room temperature. Afterwards, sensors were mounted in the flow chamber and PRP suspensions (250,000 platelets/μL−1) were perfused through the device at 37°C at a flow rate of 100 μL minute−1 in the presence of vehicle or silica NPs (100 μg mL−1 and 200 μg mL−1), polystyrene NPs (100 μg mL−1 and 200 μg mL−1), and gold NPs (5 μg mL−1). Gold NPs were shaken and silica and polystyrene NPs sonicated for 10 minutes prior to aggregation assay. Platelet aggregation was monitored for 30 minutes in real time by acquisition Q-Sense software (QSoft401) and measured as frequency and dissipation. To study whether or not NPs by themselves could influence in changes in frequency and dissipation, PPP was used as control. PPP was perfused at 100 μL minute−1 in the presence and absence of NPs and changes in frequency and dissipation were monitored for 30 minutes.
Phase contrast microscopy
The formation of platelet aggregates on the crystal surface was studied using an Axiovert 200M optical microscope (Carl Zeiss). PRP suspensions were perfused in the presence of vehicle or silica NPs on fibrinogen-coated polystyrene-coated quartz crystals for 30 minutes through the device. Crystals were then taken for phase contrast microscopy using a 20× objective. Photomicrographs were captured using a digital camera and AxioVision software (v 4.7; Carl Zeiss).
Helium ion microscopy
For helium ion microscope imaging, PRP suspensions were perfused through the device in the presence of vehicle or silica NPs on fibrinogen-coated polystyrene-coated quartz crystals for 30 minutes. Afterwards, samples were fixed using 3% glutaraldehyde for 30 minutes at 37°C. Samples were then dehydrated through ascending grades of ethanol (60% for 20 minutes, 80% for 20 minutes, 90% for 20 minutes, and finally 100% for 30 minutes repeated once). Samples were then coated with a thin gold film to reduce charging effect. A Carl Zeiss Orion Plus helium ion microscope was used to image the platelets due to its subnanometer resolution, efficient charge control, small beam damage, and high depth of field.Citation31 The helium ion microscope was operating at an acceleration voltage of 32 kV and a beam current of approximately 3.2 pA.
Transmission electron microscopy
Gold NPs were placed on carbon-coated copper grids (Quantifoil Micro Tools GmbH, Jena, Germany) and left to air dry. The samples were then viewed using a JEOL JEM-2100 transmission electron microscope operating at 200 kV. All the micrographs were recorded on a 1.35 K × 1.04 K × 12-bit ES500W Erlangshen CCD camera (Gatan, Inc, Pleasanton, CA). Transmission electron microscope images were analyzed using Image J software (National Institutes of Health, Bethesda, MD).
Platelet aggregation monitored by light aggregometry
The ability of NPs to induce platelet aggregation was measured using a four-channel Whole Blood Lumi- aggregometer (Chrono-Log Corporation, Havertown, PA) linked to Aggrolink data reduction system (810DR; Chrono-log).Citation6 NPs were sonicated for 10 minutes prior to aggregation assay. Platelet samples were incubated in the presence of vehicle or silica and polystyrene NPs at concentrations of 25, 50, 100, 150, and 200 μg mL−1 and their effects were recorded for 30 minutes. Additional experiments were performed with gold NPs at concentration of 5 μg mL−1. Collagen (5 μg mL−1)- induced platelet aggregation was used as positive control.
Flow cytometry
In order to analyze receptor expression on the surface of individual platelets and to minimize platelet activation caused by sample preparation procedures, no stirring or vortexing steps were used. The abundance of P-selectin on the surface of platelets in the presence of silica NPs (100 μg mL−1 and 200 μg mL−1), polystyrene NPs (200 μg mL−1), and gold NPs (5 μg mL−1) was measured by flow cytometry. Collagen (5 μg mL−1)-induced aggregation was used as positive control whereas resting platelets were used as negative control. When collagen-induced aggregation reached 50% maximal light transmission, samples were collected and incubated in the dark for 5 minutes at room temperature in the presence of saturating concentrations (10 μg mL−1) of P-selectin (CD62P-APC; BD Biosciences, Oxford, UK). Following incubation, samples were diluted in FACSFlow™ and analyzed within 5 minutes using a FACSArray™ bioanalyzer (BD Biosciences). Flow cytometry was performed on single stained platelet samples as previously described.Citation6 The instrument was set up to measure the size (forward scatter), granularity (side scatter), and cell fluorescence. A two-dimensional analysis gate of forward and side scatter was drawn in order to include single platelets and exclude platelet aggregates and microparticles. Antibody binding was measured by analyzing individual platelets for fluorescence. The mean fluorescence intensity was determined after correction for cell autofluorescence. For each sample, the fluorescence was analyzed using a logarithmic scale. Fluorescence histograms were obtained for 10,000 individual events. Data were analyzed using FACSArray software (v 1.0.3; BD Biosciences).
Statistics
For QCM-D, results are expressed as percentage of frequency and dissipation from the third overtone, where the maximal changes in frequency (negative shift) and dissipation (positive shift) at 30 minutes of perfusion for the control (250,000 platelets/μL−1) are considered as 100%. For light aggregometry, results are expressed as percentage of maximal aggregation (PPP transmission set at 100%). For flow cytometry, results are expressed as percentage of number of P-selectin copies (where the values for collagen are considered as 100%).
Data from at least three independent experiments were analyzed using GraphPad Prism (v 5.0; GraphPad Software, Inc, La Jolla, CA). All means are reported with standard deviation. Paired Student’s t-tests, one-way analyses of variance, and Tukey–Kramer post hoc multiple comparison test were performed, where appropriate. Statistical significance was considered when P < 0.05.
Results
NP characterization
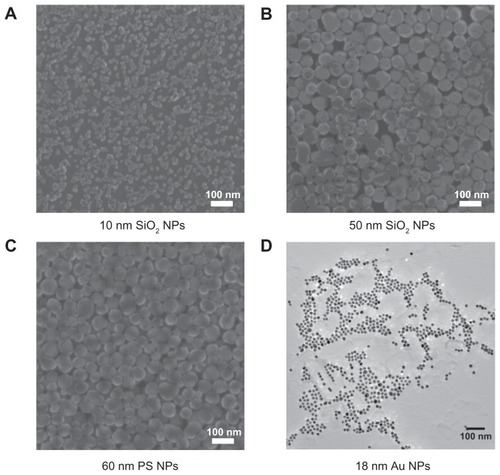
The median size and zeta potential measured by Malvern ZetaSizer for all NPs tested are listed in . Due to the discrepancies in size between zetasizer and manufacturer’s specifications (silica and polystyrene), NPs were also examined by helium ion microscope. The size of gold NPs was measured using transmission electron microscope. The micrographs showed spherical NPs (). The measured sizes (n = 9) of 50-nm silica NPs and 60-nm polystyrene NPs were in compliance with the manufacturer’s specifications (53.67 ± 13.14 and 57.67 ± 9.77 nm, respectively). The 10-nm silica NPs showed a size of 16.56 ± 4.77 nm and some tendency to agglomeration. The gold NPs showed a size of 16.5 ± 2 nm.
Table 1 Characterization of silica, polystyrene, and gold nanoparticles
Figure 1 Helium scanning micrographs of (A) 10-nm silica nanoparticles, (B) 50-nm silica nanoparticles, and (C) 60-nm polystyrene nanoparticles and transmission electron micrographs of (D) 18-nm gold nanoparticles.
Abbreviations: Au NPs, gold nanoparticles; PS NPs, polystyrene nanoparticles; SiO2 NPs, silica nanoparticles.
Effects of NPs on platelet aggregation as measured by QCM-D and microscopy
The perfusion of physiological concentrations of platelets (250,000 platelets/μL−1) on polystyrene-coated quartz crystals induced a decrease in frequency and an increase in dissipation indicating the deposition of platelet aggregates on the sensor surface (). Incubation of platelets with 50-nm silica NPs at concentrations up to 200 μg mL−1 significantly induced changes in frequency and in dissipation (). In addition, as compared to controls 10-nm silica NPs (100 μg mL−1) also increased dissipation (). These effects were confirmed by phase contrast microscopy () and helium ion microscopy which showed the presence of bigger platelet aggregates on the surface of the crystals after the perfusion of PRP in the presence of NPs (). Furthermore, as shown in , incubation of platelets with 60-nm polystyrene NPs at concentrations up to 200 μg mL−1 also induced significant changes in frequency and in dissipation. In addition, incubation of platelets with 18-nm gold NPs at 5 μg mL−1 also induced a significant increase in dissipation as shown in .
Figure 2 Effects of silica nanoparticles on platelet aggregation using quartz crystal microbalance with dissipation. Perfusion of fibrinogen-coated polystyrene-coated quartz crystals with platelet-rich plasma in the presence of silica nanoparticles leads to platelet aggregation. (A) Representative traces from the third overtone recorded by the device showing the effects of platelet-rich plasma in the presence or absence of silica nanoparticles on frequency (blue line, left axis) and dissipation (red line, right axis). (B) Representative micrographs of the surface of fibrinogen-coated polystyrene-coated quartz crystals as viewed by phase contrast microscopy showing increased accumulation of platelet aggregates following perfusion of platelet-rich plasma in the presence of silica nanoparticles.
Abbreviations: min, minutes; PRP, plasma-rich protein; sec, seconds.
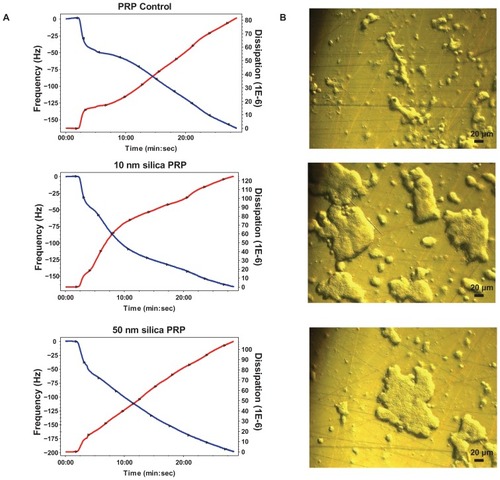
Figure 3 Quantitative analysis of the effects of silica nanoparticles on frequency and energy dissipation (from the third overtone), where the maximal changes in frequency (negative shift) and dissipation (positive shift) for the control are considered as 100%. (A) Incubation of platelets with 50-nm silica nanoparticles at concentrations up to 200 μg mL−1 significantly induced changes in frequency and dissipation. (B) Incubation of platelets with 10-nm silica nanoparticles (100 μg mL−1) significantly induced changes in dissipation.
Notes: Data are expressed as mean ± standard deviation. *P < 0.05; **P < 0.01; ***P < 0.001.
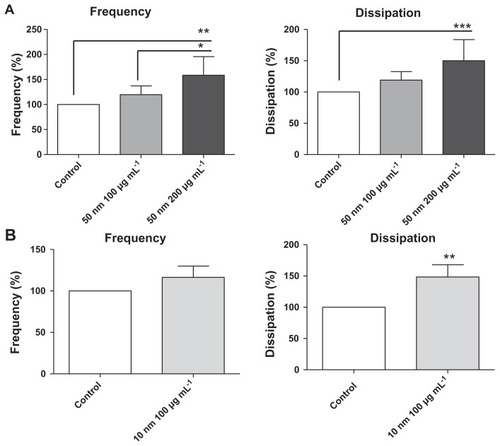
Figure 4 Representative micrographs of the surface of fibrinogen-coated polystyrene-coated quartz crystals as viewed by helium ion microscopy after the perfusion of platelet-rich plasma (A) and platelet-rich plasma in the presence of 10-nm silica nanoparticles (B) and 50-nm silica nanoparticles (C). Increased accumulation of platelet aggregates and bigger aggregates induced by the perfusion of platelet-rich plasma in the presence of silica nanoparticles is shown.
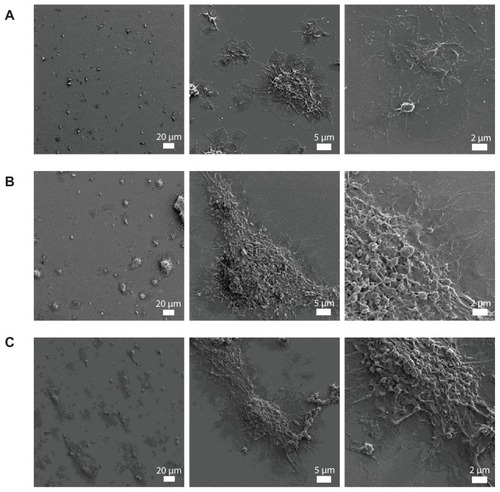
Figure 5 Effects of polystyrene nanoparticles on platelet aggregation using quartz crystal microbalance with dissipation. Perfusion of fibrinogen-coated polystyrene-coated quartz crystals with platelet-rich plasma in the presence of polystyrene nanoparticles leads to platelet aggregation. (A) Representative traces from the third overtone recorded by the device showing the effects of platelet-rich plasma in the presence or absence of polystyrene nanoparticles on frequency (blue line, left axis) and dissipation (red line, right axis). (B) Quantitative analysis of the effects of polystyrene nanoparticles on frequency and dissipation. Incubation of platelets with 60-nm polystyrene nanoparticles at concentrations up to 200 μg mL−1 significantly induced changes in frequency and dissipation.
Notes: Data are expressed as mean ± standard deviation. *P < 0.05.
Abbreviations: min, minutes; PRP, plasma-rich protein; sec, seconds.
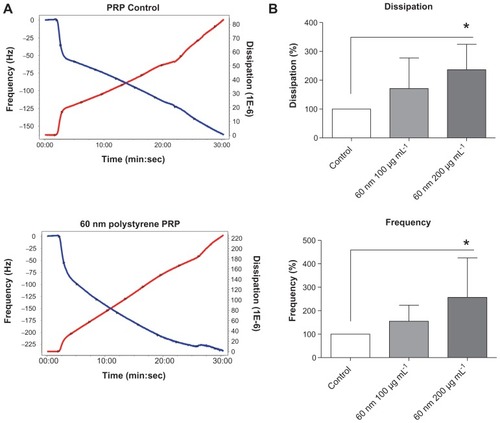
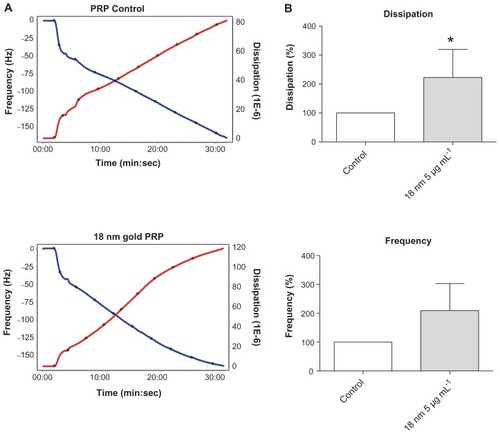
Figure 6 Effects of gold nanoparticles on platelet aggregation using quartz crystal microbalance with dissipation. Perfusion of fibrinogen-coated polystyrene-coated quartz crystals with platelet-rich plasma in the presence of gold nanoparticles leads to platelet aggregation. (A) Representative traces from the third overtone recorded by the device showing the effects of platelet-rich plasma in the presence or absence of gold nanoparticles on frequency (blue line, left axis) and dissipation (red line, right axis). (B) Quantitative analysis of the effects of gold nanoparticles on frequency and dissipation.
Notes: Data are expressed as mean ± standard deviation. *P < 0.05.
Abbreviations: min, minutes; PRP, plasma-rich protein; sec, seconds.
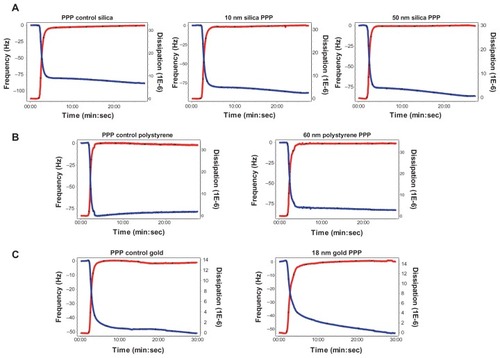
In order to know whether or not NPs were able to induce changes in frequency and in dissipation on their own, PPP in the absence and presence of silica, polystyrene, and gold NPs were perfused through the crystals. No significant changes were found in frequency and dissipation when PPP was incubated with NPs ().
Figure 7 Effects of silica, polystyrene, and gold nanoparticles on platelet-poor plasma using quartz crystal microbalance with dissipation. Perfusion of fibrinogen-coated polystyrene-coated quartz crystals with platelet-poor plasma in the presence of silica, polystyrene, and gold nanoparticles did not induce significant changes in frequency and dissipation. Representative traces from the third overtone recorded by the device showing the effects of platelet-poor plasma in the presence or absence of (A) silica nanoparticles, (B) polystyrene nanoparticles, and (C) gold nanoparticles on frequency (blue line, left axis) and dissipation (red line, right axis).
Abbreviation: min, minutes; PPP, platelet-poor plasma; sec, seconds.
Effects of NPs on platelet aggregation as measured by light aggregometry
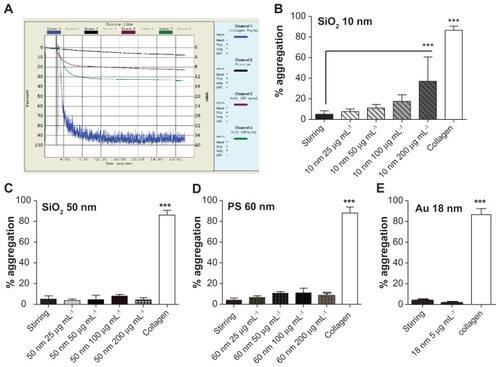
The 10-nm silica NPs induced platelet aggregation at 200 μg mL−1, but not at lower concentrations (25, 50, and 100 μg mL−1) (). Incubation of PRP with silica NPs (50 nm), polystyrene NPs (60 nm) at concentrations up to 200 μg mL−1 and gold NPs (18 nm) at 5 μg mL−1 did not induce platelet aggregation (). As expected, incubation of platelets with collagen (5 μg mL−1) resulted in platelet aggregation ().
Figure 8 Effects of silica, polystyrene, and gold nanoparticles on platelet aggregation using light aggregometer. (A) Representative traces from aggregometry studies in platelet-rich plasma in the presence or absence of 10-nm silica nanoparticles. Collagen (blue line) was used as a positive control; stirring platelets in the absence of nanoparticles (black line) were used as negative control. Only 200 μg mL−1 (green line) induced significant platelet aggregation. Quantitative analysis of (B) 10-nm silica nanoparticles with all concentrations tested, (C) 50-nm silica nanoparticles with all concentrations tested, (D) 60-nm polystyrene nanoparticles with all concentrations tested, and (E) gold nanoparticles.
Notes: Data expressed as mean ± standard deviation. ***P < 0.001 versus stirring.
Abbreviations: Au, gold; min, minutes; PS, polystyrene; sec, seconds; SiO2, silica.
Effects of NPs on P-selectin abundance
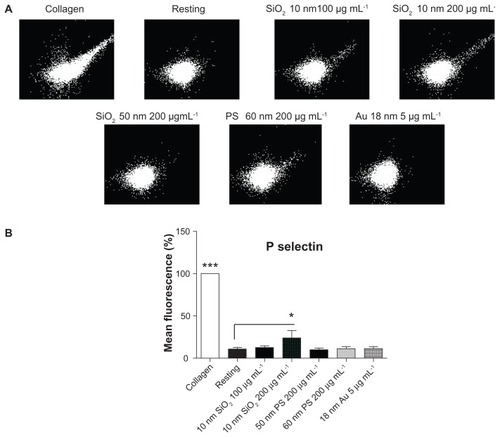
Flow cytometry was used to study the effects of silica, polystyrene, and gold NPs on the abundance of P-selectin. Incubation of resting platelets with 10-nm silica NPs at 200 μg mL−1, but not at lower concentrations, induced a significant increase in the number of P-selectin copies on platelet surface. However, incubation of PRP with silica NPs (50 nm), polystyrene NPs (60 nm) up to 200 μg mL−1, and gold NPs (18 nm) at 5 μg mL−1 did not change the expression of P-selectin on the platelet surface. As expected, incubation of platelets with collagen (5 μg mL−1) resulted in significant upregulation of P-selectin in platelets ().
Figure 9 Effects of silica, polystyrene, and gold nanoparticles on platelet receptors. (A) Representative flow cytometry recordings showing analysis of P-selectin on platelets in the presence and absence (resting) of 10-nm and 50-nm silica and polystyrene nanoparticles (up to 200 μg mL−1) and 18-nm gold nanoparticles (5 μg mL−1). Collagen (5 μg mL−1) was used as positive control. (B) Quantitative analysis of the effects of silica, polystyrene, and gold nanoparticles on P-selectin.
Notes: Data expressed as mean ± standard deviation. *P < 0.05; ***P < 0.001 versus resting.
Abbreviations: Au, gold; PS, polystyrene; SiO2, silica.
Discussion
There is increasing evidence that exposure of humans to NPs could lead to pharmacological and toxicological effects in the cardiovascular system.Citation1,Citation5,Citation7 It has been found that inhaled NPs may cause systemic inflammation and oxidative stress, which mediate endothelial dysfunction and atherosclerosis.Citation4 In addition, NPs may interact in the bloodstream with platelets leading to platelet activation, aggregation, and vascular thrombosis.Citation6,Citation32 Therefore, it is necessary to ensure that engineered NPs are blood compatible before their use in humans or in human environment.
To date, most data on biology, physiology, and pharmacology of platelet aggregation has been obtained by studying this phenomenon using light aggregometer that stands as the “traditional gold standard” for the measurement of platelet aggregation.Citation33 However, the use of light aggregometer to detect and measure NP-induced platelet aggregation is limited. Indeed, the instrument is not sensitive enough to detect microaggregates; it operates only in no-flow mode and therefore does not mimic flow-mediated aggregation events encountered in the microvasculature.Citation14,Citation34 A new method for the characterization of platelet microaggregation at nanoscale under flow conditions has recently been developed using QCM-D technology.Citation15–Citation17 Using this device, the aim was to investigate the proaggregatory effects of three different NPs and compare the data obtained from QCM-D experiments to results generated by standard methods that measure platelet activation with a higher (flow cytometry) and lower (light aggregometer) sensitivity.
Silica and polystyrene NPs were selected for these experiments as they are largely used in different technological and pharmaceutical applications.Citation35,Citation36 Silica and polystyrene NPs of different sizes and concentrations were used to study their interactions with human platelets. In addition, further studies were performed with gold NPs as they are increasingly used in biotechnology.Citation37 In order to corroborate NP characteristics, their size, morphology, and zeta potential were evaluated prior to pharmacological studies. When evaluating toxicological effects of NPs, it would be desirable to disperse NPs in aqueous solutions as agglomeration could influence toxicological studies by affecting cellular uptake or biodistribution of NPs.Citation38 A good dispersion of all NPs with sizes consistent with singlet NP was found. Silica and polystyrene NPs did not diverge from the manufacturer’s specifications.
It was previously found that engineered carbon multi-walled and single-walled nanotubes and mixed carbon NPs were able to induce platelet activation and aggregation in washed platelets in vitro.Citation6 However, PRP was used in this study as it has been suggested that proteins coating the surface of NPs lead to the formation of a “protein corona” that can change the biological properties of the NPsCitation39 and, therefore, might modify the effects of NPs on platelets. Consequently, it would be desirable to test the blood compatibility of different NPs in the presence of plasma proteins. In a study of the interactions between polystyrene NPs (different sizes and charges) and human plasma proteins, Lundqvist et alCitation39 showed that, even though many of the major highly abundant proteins in the corona are independent of size and surface charge, a whole range of different proteins coat the surface of polystyrene NPs.
The ability of single-walled nanotubes to induce platelet aggregation in PRP has been previously reported in a study by Bihari et al.Citation40 In the present experiments, only the smallest NPs tested (10 nm silica) at a concentration of 200 μg mL−1 were able to induce platelet aggregation in PRP as measured by aggregometry. This could be explained by the fact that the smaller the particle, the more surface area they have per unit mass; therefore any intrinsic toxicity of the particle surface would be enhanced.Citation41 In fact, the rest of the NPs tested were not able to induce platelet aggregation as measured by aggregometry. However, in control experiments, incubation of platelets with collagen resulted in platelet aggregation, showing that platelets – that did not aggregate in response to silica, polystyrene, or gold NPs – reacted as expected to the presence of a physiological stimulant. These results correlated well with the abundance of P-selectin on platelet surface as measured by flow cytometry. Platelet activation is associated with the surface abundance of receptors that play an important role in adhesion, aggregation, and platelet-leukocyte aggregation. P-selectin is mainly stored in platelet alpha-granules and upon platelet activation is translocated to the platelet surface, mediating leukocyte rolling and the formation of platelet–leukocyte aggregates.Citation42 P-selectin is, in fact, one of the most sensitive markers of platelet activation; therefore, any changes in the abundance of this receptor induced by NPs could potentially indicate undesirable effects on human platelets. In fact, P-selectin has been previously used as a marker of platelet activation in engineered NP research.Citation6 Indeed, the present results are in agreement with Bilhari et al,Citation40 who demonstrated P-selectin translocation to the platelet surface after incubation of whole blood with single-walled nanotubes.
When the interactions between silica, polystyrene, and gold NPs with human platelets were studied under flow conditions by QCM-D, it was found that the perfusion of fibrinogen-coated polystyrene-coated quartz crystals with PRP led, as monitored in real time by the device, to accumulation of platelet mass on the sensor surface as shown by changes in frequency and dissipation and confirmed by phase contrast microscopy and helium ion microscopy. Although changes in frequency and dissipation reflect the deposition of adhering platelets and small aggregates on crystals, the deposition of bigger aggregates is more accurately reflected by changes in dissipation.Citation15,Citation16 Interestingly, QCM-D was not only able to detect platelet aggregation induced by 10-nm silica NPs at lower concentration in contrast to aggregometry and flow cytometry, but also to detect NP-induced platelet aggregation when PRP was incubated with 50-nm silica, 60-nm polystyrene, and 18-nm gold NPs. As QMC-D is a very sensitive device and can detect nanograms of mass, it was studied whether or not NPs on their own or via interactions with plasma proteins could be responsible for changes in frequency and dissipation. As shown in PPP studies, no NPs at concentrations used were able to significantly induce changes in frequency and dissipation as compared to NP-free PPP.
Conclusion
In summary, it has been demonstrated here for the first time that QMC-D is a useful and sensitive tool to study NP-induced platelet aggregation. Thus, this device should be considered when testing blood compatibility of new engineered NPs.
Acknowledgments
This work has been supported by Science Foundation Ireland (SFI) PI grant to MWR (05/FE1/B862), SFI-RFP grant to CM (RFP/BMT2781), and SFI grant on the BioNanoInteract Ireland project. CM is SFI Stokes Lecturer. MJSM is Ussher Lecturer in Nanopharmaceutical Drug Discovery, Trinity College Dublin. The authors are grateful to Dr Lidia Tajber and Ms Anita Umerska for their help in the characterization of the nanoparticles and useful discussions.
Disclosure
The authors report no conflicts of interest in this work.
References
- DonaldsonKMillsNMacNeeWRobinsonSNewbyDRole of inflammation in cardiopulmonary health effects of PMToxicol Appl Pharmacol2005207Suppl 2S483488
- PetersAPopeCA3rdCardiopulmonary mortality and air pollutionLancet200236093411184118512401239
- PopeCA3rdParticulate air pollution, C-reactive protein, and cardiac riskEur Heart J200122141149115011440485
- DonaldsonKTranLJimenezLACombustion-derived nanoparticles: a review of their toxicology following inhalation exposurePart Fibre Toxicol200521016242040
- NemmarANemeryBHoetPHVan RooijenNHoylaertsMFSilica particles enhance peripheral thrombosis: key role of lung macrophage-neutrophil cross-talkAm J Respir Crit Care Med2005171887287915657461
- RadomskiAJuraszPAlonso-EscolanoDNanoparticle-induced platelet aggregation and vascular thrombosisBr J Pharmacol2005146688289316158070
- NemmarAHoetPHVanquickenborneBPassage of inhaled particles into the blood circulation in humansCirculation2002105441141411815420
- MedinaCSantos-MartinezMJRadomskiACorriganOIRadomskiMWNanoparticles: pharmacological and toxicological significanceBr J Pharmacol2007150555255817245366
- YamawakiHIwaiNMechanisms underlying nano-sized air-pollution-mediated progression of atherosclerosis: carbon black causes cytotoxic injury/inflammation and inhibits cell growth in vascular endothelial cellsCirc J200670112914016377937
- LiXRadomskiACorriganOIPlatelet compatibility of PLGA, chitosan and PLGA-chitosan nanoparticlesNanomedicine (Lond)20094773574619839810
- O’BrienJRThe adhesiveness of native platelets and its preventionJ Clin Pathol19611414014913730014
- BornGVAggregation of blood platelets by adenosine diphosphate and its reversalNature196219492792913871375
- CardinalDCFlowerRJThe electronic aggregometer: a novel device for assessing platelet behavior in bloodJ Pharmacol Methods1980321351587392654
- PedvisLGWongTFrojmovicMMDifferential inhibition of the platelet activation sequence: shape change, micro- and macro- aggregation, by a stable prostacyclin analogue (Iloprost)Thromb Haemost19885923233282455359
- Santos-MartinezMJA novel method for the measurement of flow-induced platelet activation at nanoscale resolution level [PhD Thesis]DublinTrinity College Dublin2009
- Santos-MartinezMJMedinaCPrina-MelloAA nanoscale resolution assay of flow-induced platelet microaggregationKardiochir Torakochi201074365375
- Santos-MartinezMJPrina-MelloAMedinaCRadomskiMWAnalysis of platelet function: role of microfluidics and nanodevicesAnalyst2011136245120512622029043
- TurkevichJStevensonPCHillierJA study of the nucleation and growth process in the synthesis of colloidal goldDiscuss Faraday Soc1951115575
- FrensGControlled nucleation for regulation of the particle size in monodisperse gold suspensionsNature Phys Sci19732411052022
- KimlingJMaierMOkenveBKotaidisVBallotHPlechATurkevich method for gold nanoparticle synthesis revisitedJ Phys Chem B200611032157001570716898714
- RahmeKVicendoPAyelaCA simple protocol to stabilize gold nanoparticles using amphiphilic block copolymers: stability studies and viable cellular uptakeChemistry20091542111511115919768714
- RadomskiMMoncadaSAn improved method for washing of human platelets with prostacyclinThromb Res19833043833896351341
- SauerbreyGThe use of oscillating crystals to weigh thin layers as a microbalanceZ Phys19591552206222 German
- KawakamiKHaradaYSakasitaMNagaiHHandaMIkedaYA new method for continuous measurement of platelet adhesion under flow conditionsASAIO J1993393M5585608268598
- MatsudaTKishidaAEbatoHOkahataYNovel instrumentation monitoring in situ platelet adhesivity with a quartz crystal microbalanceASAIO J1992383M1711731457841
- SinnSMüllerLDrechselHPlatelet aggregation monitoring with a newly developed quartz crystal microbalance system as an alternative to optical platelet aggregometryAnalyst2010135112930293820877907
- FredrikssonCKihlmanSRodahlMKasemoBThe piezoelectric quartz crystal mass and dissipation sensor: a means of studying cell adhesionLangmuir1998142248251
- HöökFRodahlMBrzezinskiPKasemoBEnergy dissipation kinetics for protein and antibody-antigen adsorption under shear oscillation on a quartz crystal microbalanceLangmuir1998144729734
- MarxKAQuartz crystal microbalance: a useful tool for studying thin polymer films and complex biomolecular systems at the solution-surface interfaceBiomacromolecules2003451099112012959572
- DixonMCQuartz crystal microbalance with dissipation monitoring: enabling real-time characterization of biological materials and their interactionsJ Biomol Tech200819315115819137101
- BazouDBehanGReidCBolandJJZhangHZImaging of human colon cancer cells using He-Ion scanning microscopyJ Microsc2011242329029421118254
- MiyamotoMSasakawaSOzawaTKawaguchiHOhtsukaYMechanisms of blood coagulation induced by latex particles and the roles of blood cellsBiomaterials19901163853882207226
- MichelsonADMethods for the measurement of platelet functionAm J Cardiol20091033 Suppl20A26A
- HarrisonPFrelingerAL3rdFurmanMIMichelsonADMeasuring antiplatelet drug effects in the laboratoryThromb Res2007120332333617239428
- Food Safety Authority of IrelandThe relevance for food safety of application of nanotechnology in the food and feed industries2008 Available from: http://www.fsai.ie/WorkArea/DownloadAsset.aspx?id=7858Accessed August 5, 2011
- RIVM Dutch National Institute for Public Health and the EnvironmentNanotechnology in perspectiveRisks to man and the environment2009 Available from: http://www.rivm.nl/bibliotheek/rapporten/601785003.htmlAccessed August 5, 2011
- YehYCCreranBRotelloVMGold nanoparticles: preparation, properties, and applications in bionanotechnologyNanoscale2011 [Epub ahead of print.]
- ZookJMMaccuspieRILocascioLEHalterMDElliottJTStable nanoparticle aggregates/agglomerates of different sizes and the effect of their size on hemolytic cytotoxicityNanotoxicology2011551753021142841
- LundqvistMStiglerJEliaGLynchICedervallTDawsonKANanoparticle size and surface properties determine the protein corona with possible implications for biological impactsProc Natl Acad Sci U S A200810538142651427018809927
- BihariPHolzerMPraetnerMSingle-walled carbon nanotubes activate platelets and accelerate thrombus formation in the microcirculationToxicology20102692–314815419698757
- DonaldsonKAitkenRTranLCarbon nanotubes: a review of their properties in relation to pulmonary toxicology and workplace safetyToxicol Sci200692152216484287
- AndrewsRKBerndtMCPlatelet physiology and thrombosisThromb Res20041145–644745315507277