Abstract
Background
Quercetin has been shown to induce apoptosis in a number of cancer cell lines, but a quercetin-loaded nanoliposomal formulation with enhanced antitumor activity in C6 glioma cells and its effect on cancer cell death has not been well studied. The aim of this study was to examine if quercetin-loaded liposomes (QUE-NL) has enhanced cytotoxic effects and if such effects involve type III programmed cell death in C6 glioma cells.
Methods
C6 glioma cells were treated with QUE-NL and assayed for cell survival, apoptosis, and necrosis. Levels of reactive oxygen species production and loss of mitochondrial membrane potential (ΔΨm) were also determined by flow cytometry assay to assess the effects of QUE-NL. ATP levels and lactate dehydrogenase activity were measured, and Western blotting was used to assay cytochrome C release and caspase expression.
Results
QUE-NL induced type III (necrotic) programmed cell death in C6 glioma cells in a dose-dependent and time-dependent manner. High concentrations of QUE-NL induced cell necrosis, which is distinct from apoptosis and autophagy, whereas liposomes administered alone induced neither significant apoptosis nor necrosis in C6 glioma cells. QUE-NL-induced ΔΨm loss and cytochrome C release had no effect on caspase activation, but decreased ATP levels and increased lactate dehydrogenase activity indicated that QUE-NL stimulated necrotic cell death.
Conclusion
C6 glioma cells treated with QUE-NL showed a cellular pattern associated with necrosis without apoptosis and was independent of caspase activity. Nonapoptotic cell death induced by high concentrations of QUE-NL for controlling caspase-independent type III programmed cell death may provide the basis for novel therapeutic approaches to overcome avoidance of apoptosis by malignant cells.
Introduction
Programmed cell death can be divided into three different morphological and biochemical categories, ie, type I, type II, and type III.Citation1,Citation2 Type I programmed cell death consists of classical apoptotic cell death, characterized by cellular shrinkage, chromatin condensation, and DNA degradation. Apoptotic programmed cell death is a highly regulated process associated with several molecular events involving receptors, proapoptotic/antiapoptotic proteins, and signaling pathways mediated by caspases and/or the mitochondrial apoptogenic protein cytochrome c, Omi/HtrA2, or Smac/DIABLO3, leading to DNA fragmentation and eventually cell death.Citation3 Type II (autophagic) programmed cell death is characterized by engulfment of cellular organelles such as mitochondria and endoplasmic reticulum by cytoplasmic vesicles, and seems to involve lysosomal cathepsins.Citation2,Citation4
Type III (necrosis-like) programmed cell death is defined exclusively by cytoplasmic features.Citation1,Citation4 Unfortunately, the pathways implicated in this last type of programmed cell death are poorly understood. In any case, type III programmed cell death seems to operate in a caspase-independent manner.Citation3 Furthermore, necrosis is usually triggered by pathophysiological conditions, such as inflammation, infection, or ischemia.Citation5 Nonapoptotic machinery or necrotic cell death may be useful in cancer therapy, and this previously unknown mechanism controlling caspase-independent type III programmed cell death may provide the basis for novel therapeutic approaches to overcome apoptotic avoidance in malignant cells.
Gliomas are the most frequent primary tumors occurring in the central nervous system, patients with malignant glioma have a very poor prognosis, and cure rates are not satisfactory.Citation6 Unfortunately, during progression towards drug-resistant disease, the apoptotic machinery, consisting of antiapoptotic and proapoptotic proteins, is not balanced and often favors cell survival following cytotoxic insult. In such a scenario, agents that initiate nonapoptotic cell death may easily overcome inherent deficiencies in the apoptotic machinery of cancer cells. Currently, investigators are focused on new agents and novel targets for treatment of glioma.
Quercetin has a wide range of biological activity, including inhibition of mutant p53 expression,Citation7 and it enhances apoptosis mediated by death receptors in glioma cells.Citation8 Quercetin-mediated apoptosis may result from induction of stress proteins, including the heat shock proteins, disruption of microtubules, mitochondrial release of cytochrome c, and activation of caspases.Citation9–Citation11 These activities of quercetin make it a promising candidate for treatment and prevention of various cancers. However, insolubility of quercetin in water results in poor absorption, low bioavailability, and inability to cross the blood–brain barrier, thereby limiting its potential clinical application in the treatment of cancer. Furthermore, the solvent used, eg, dimethylsulfoxide, may cause hemolysis and liver and kidney damage. Therefore, development of novel preparations that enhance the solubility of quercetin and improve its bioactivity in inhibiting tumor growth is of great importance. The research objective in this study was to prepare quercetin nanoliposomes (QUE-NL) using the emulsification-evaporation and low temperature curing method. In the present study, we show that high QUE-NL concentrations can induce a type of cell death which is distinct from apoptosis and autophagy, induces necrotic but not apoptotic cell death, and is associated with loss of the mitochondrial membrane potential (ΔΨm) and induction of reactive oxygen species. Because most current anticancer drugs signal through the mitochondria, we speculated that QUE-NL might be an alternative target for induction of tumor cell death. In this report, we demonstrate that QUE-NL-induced necrotic cell death was partially reversible by pretreatment with N-acetylcysteine, an antioxidant. Understanding the mechanisms linking the oxidative-induced necrosis response in cell death pathways could suggest new therapeutic strategies for treatment of oxidative stress-associated diseases. In this work, we investigated the mechanisms that govern the reciprocal regulation of necrosis and death pathways in C6 glioma cells. There are no reports addressing the effects of QUE-NL on necrosis in C6 glioma cells, so the aim of this study was to determine if QUE-NL was cytotoxic to C6 glioma cells and to assess the role of QUE-NL-induced necrosis in cell death.
Materials and methods
Chemicals and reagents
Propidium iodide and N-acetylcysteine were obtained from Sigma Chemical Co (St Louis, MO). DCFH-DA, DiOC6(3), and Indo 1/AM were purchased from Molecular Probes (BestBio Biotechnologies, Shanghai, China). Roswell Park Memorial Institute (RPMI) 1640 medium, penicillin-streptomycin, trypsin-ethylenediamine tetra-acetic acid, fetal bovine serum, and L-glutamine were obtained from Gibco (Invitrogen, Carlsbad, CA). A mitochondrial membrane potential assay kit with JC-1 was obtained from BestBio Biotechnologies, along with a caspase-3 activity assay kit, an ATP detection kit, and a lactate dehydrogenase cytotoxicity assay kit. Cytochrome c, caspase-3 and caspase-9 antibodies were obtained from Santa Cruz Biotechnology (Santa Cruz, CA).
Preparation of QUE-NL
QUE-NLs were prepared using the emulsification-evaporation and low temperature curing method.Citation12 The aqueous phase comprised Poloxamer 188, PEG2000-DPSE, and Tween 80 (1:1:1, w/w/v) dissolved in pure water and maintained in a water bath at 75°C. The oil phase was composed mainly of glyceryl behenate, soy lecithin, and cholesterol (1:2:1, w/w/w); the glyceryl behenate and cholesterol were melted in a water bath at 80°C. Quercetin 1% (w/v) and soy lecithin were dissolved in an ethanol-acetone mixed solvent (1:1, v/v) to obtain a weight ratio of lecithin to quercetin of 10:1. Quercetin and soy lecithin were then dissolved in the oil phase, and then the oil phase of the aforementioned mixed solvent was injected into the aqueous phase through plastic needle tubing (internal diameter 0.45 μm, injection rate 2 mL/minute) under mechanical agitation at 1000 rpm. After stirring for 2 hours, the liposome suspension was cured at a low temperature of −4°C. The QUE-NL system was obtained after the resulting suspension was filtered through a filter membrane (0.2 μm) to remove the nonincorporated drug. Liposomes containing no quercetin were also prepared in the same manner as described above. Before use in this experiment, QUE-NL were well distributed in RPMI 1640 medium containing 10% (v/v) heat-activated fetal bovine serum, using ultrasound in order to obtain a QUE-NL suspension.
Characteristics of QUE-NL
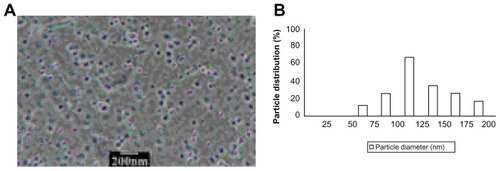
To observe the particle size and morphology of the QUE-NL (), the sample was dispersed in deionized water and measured using a JEM-2100 transmission electron microscope (JEOL, Tokyo, Japan).
Figure 1 Particle average size and size distribution of quercetin nanoliposomes. Image (A) and mean size (B) of quercetin nanoliposomes.
Cell culture and treatment
The C6 glioma cells were purchased from the American Tissue Culture Collection (Rockville, MD). The cells were cultured at 37°C with 5% CO2 in a humidified atmosphere using RPMI 1640 supplemented with 10% fetal bovine serum, penicillin 100 U/mL, and streptomycin 100 U/mL. Cultured C6 glioma cells were treated in vitro with the indicated amounts of QUE-NL for up to 12 hours. Different concentrations of QUE-NL or quercetin (QUE) and N-acetylcysteine (NAC) were added to the cells, respectively, with 1% dimethyl sulfoxide (DMSO) blank nanoliposomes as the control.
Morphological changes and viability
Different concentrations (0, 50, 100, 200 and 400 μM) of QUE-NL or quercetin alone were added to the cells, with 1% dimethylsulfoxide as a solvent control. Cells were grown and incubated for specified time periods (12, 24, 36, and 48 hours). Electron microscopy and morphometric analysis were performed as described previously. Cells were fixed for 30 minutes with ice-cold 3% glutaraldehyde in 0.1 M cacodylate buffer, embedded in Epon, and processed for transmission electron microscopy by standard procedures. Representative areas were chosen for ultrathin sectioning and examined by transmission electron microscopy at 400× magnification.
Analysis of cell death
Cells were incubated with different concentrations (0, 50, 100, 200, and 400 μM) of QUE-NL or quercetin for 12 hours. Cells were then trypsinized and harvested by centrifugation before incubation with Annexin V and propidium iodide for 15 minutes at room temperature. Necrosis was examined and rates were analyzed by flow cytometry using an Annexin V-FITC/propidium iodide kit (BestBio Biotechnologies). Annexin V binds to necrotic and apoptotic cells in which phosphatidylserine is exposed on the cell surface and the percentage of necrotic cells is determined.Citation13
Reactive oxygen species and ΔΨm
Cells were incubated with different concentrations (0, 50, 100, 200, and 400 μM) of QUE-NL or quercetin for 12 hours, and changes in reactive oxygen species production and ΔΨm were measured. In addition, cells were also pretreated with or without the antioxidant N-acetylcysteine 3 hours prior to treatment with 200 μM QUE-NL or quercetin to examine the effects on reactive oxygen species. Cells were harvested, washed twice in phosphate-buffered saline, and then resuspended in 500 μL of DCFH-DA 10 μM for measurement of reactive oxygen species levels and DiOC6(3) 4 μmol/L for measurement of ΔΨm in a dark room for 30 minutes at 37°C, and then assayed by flow cytometry as previously described.Citation13–Citation15
Caspase-3 and caspase-9 activity
Cells were treated with QUE-NL or quercetin (200, 400 μM) or dimethylsulfoxide alone for 12 hours. Caspase-3 and caspase-9 activity and cell viability were determined using a caspase-3,9 activity assay kit (10 μM), and then analyzed by flow cytometry.Citation16
ATP and lactate dehydrogenase levels
Cells were seeded in 100 μL phenol red-free medium with a serial concentration of QUE-NL or quercetin (200 μM) for 6 hours onto 96-well white microplates, and the intracellular ATP content level was measured using a Luminescence ATP detection assay kit as described elsewhere.Citation17 The resulting luminescence was monitored using a luminometer (SynergyTM HT multimode microplate reader, Bio-Tek, Winooski, VT). Necrotic cell death was estimated by determining the amount of lactate dehydrogenase released into the culture medium after 12 hours of incubation with QUE-NL or quercetin (200 μM), with dimethylsulfoxide as the solvent control. The amount of lactate dehydrogenase released into the phenol red-free medium was determined using a lactate dehydrogenase assay kit and procedures described by the manufacturer.Citation18
Assay for cytochrome c, caspase-3, and caspase-9
For protein analysis, the cells were harvested 12 hours following the different treatments as described above, washed with cold phosphate-buffered saline, and then incubated in ice-cold RIPA buffer. Cell lysates were sonicated for 30 seconds on ice and then lysed at 4°C for 60 minutes. The cell lysates were centrifuged for 30 minutes at 4°C and 12,000 g. Protein concentrations in the supernatants were determined using bicinchoninic acid reagent. Total protein was separated by denaturing 8%–12% sodium dodecyl sulfate-polyacrylamide gel electrophoresis, and resolved and electrotransferred by semi-dry blotting (Bio-Rad Laboratories, Hercules, CA) onto a nitrocellulose membrane. Membranes were incubated with antibodies to caspase-3, caspase-9, and β-actin (Santa Cruz Biotechnology).
Results
Characteristics of QUE-NL
The morphology of QUE-NL was observed under transmission electron microscopy. As shown in , the optimized nanoliposomes were spherical. The range of particle size of the drug-loaded nanoliposomes was 62.3 nm–191.5 nm. The average diameter of the nanoliposomes was 116.7 nm.
Effects of QUE-NL on cell morphology and viability
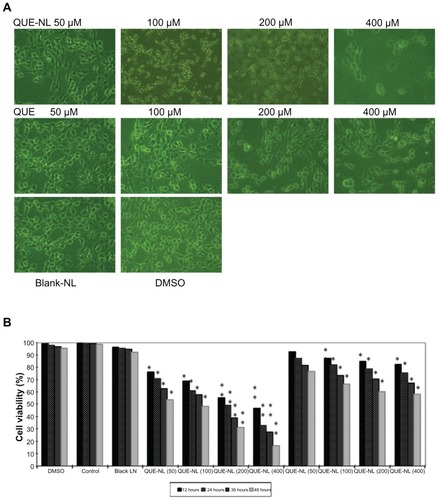
QUE-NL induced morphological changes and cell death as shown in . The results demonstrated that QUE-NL caused necrotic morphological changes and decreased the percentage of viable cells, and that these effects were dose-dependent and time-dependent, while the experimental group treated with liposomes alone showed neither apoptosis nor necrosis in C6 glioma cells (). Dimethylsulfoxide 1% had no significant effect on cell viability in C6 glioma cells ().
Figure 2 Effects of QUE-NL on cell morphology and percentage of viable C6 glioma cells. (A) Cells were examined and photographed by phase-contrast microscopy (200×) for percentage of viable cells. (B) Cells were cultured with various concentrations of QUE-NL for 12, 24, 36, and 48 hours.
Notes: Each point is mean ± standard deviation of three experiments. *P < 0.05; **P < 0.01; ***P < 0.001, significantly different from the control.
Abbreviations: QUE, quercetin; QUE-NL, nanoliposomes; DMSO, dimethylsulfoxide.
Effects of QUE-NL on necrotic cell death
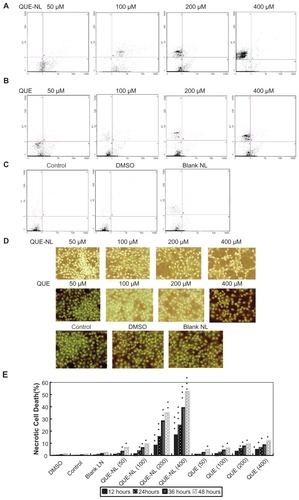
QUE-NL induced significant cell apoptosis at concentrations of 0, 50, and 100 μM when incubated for 12 hours. However, cells exposed to higher concentrations (200 and 400 μM) for 12 hours showed cell death. Annexin V/propidium iodide assay examination indicated that cell death was due to necrosis ( and B) because an apoptosis population was not observed. These data are comparable with data in showing that QUE-NL decreased the percentage of viable cells and induced necrotic morphological changes.
Figure 3 Apoptosis and necrosis in C6 glioma cells induced by QUE-NL. Cells were treated with the indicated concentration of nanoliposome of quercetin (QUE-NL) for 12 hours. (A) QUE-NL induces dose-dependent apoptosis and necrosis in C6 glioma cells. Cells were stained with Annexin V-FITC and analyzed by flow cytometry. (B) C6 glioma cells were treated with QUE for 12 hours. Cells were stained with Annexin V-FITC and analyzed by flow cytometry. (C) Control cells, including blank, DMSO, blank nanoliposome. (D) C6 glioma cells were stained with hematoxylin to detect the necrosis and cell apoptotic chromatin condensation. More than one field in each group were observed by fluorescence microscopy (400×), and representative images are shown. (E) Dose-dependent apoptosis and necrosis of C6 glioma cells by hematoxylin.
Notes: Representative measurements of at least three independent experiments are shown. The values of cell death (apoptosis and necrosis) reported represent the mean ± standard deviation of three separate experiments. *P < 0.05; **P < 0.01; ***P < 0.001 compared with control cells.
Abbreviations: DMSO, dimethylsulfoxide; NAC, N-acetylcysteine; QUE, quercetin; QUE-NL, nanoliposomes. Area of D2 means the normal mitochondrial membrane potential of C6 glioma cells, Area of D4 means the decreased mitochondrial membrane potential normal of C6 glioma cells.
Effects of QUE-NL on reactive oxygen species production and ΔΨm
To evaluate necrosis of reactive oxygen species induced by QUE-NL, C6 glioma cells were treated with N-acetylcysteine, which reduced reactive oxygen species effectively. Treatment efficacy was estimated by flow cytometry analysis. As shown in and C, reactive oxygen species activity significantly increased in C6 glioma cells treated with QUE-NL alone (). N-acetylcysteine in combination with QUE-NL decreased reactive oxygen species levels ().
Figure 4 Necrosis of C6 glioma cells is involved in mediating ROS accumulation induced by QUE-NL. C6 glioma cells were treated with the indicated concentration of NL of quercetin (QUE-NL) for 12 hours in the presence or absence of NAC. Cells were loaded with DCFH-DA for 30 minutes. (A) ROS in C6 glioma cells treated with QUE-NL alone was estimated by flow cytometry analysis. (B) ROS in C6 glioma cells treated with NAC in combination with QUE-NL was estimated by flow cytometer analysis. (C and D) The DCF fluorescence was visualized using fluorescence microscope. (E) Cell death was measured as the percentage of propidium iodide-positive cells using flow cytometry. Significantly different from control, *P < 0.01. (F) Levels of ROS were measured using flow cytometry as described in the Methods section. Significantly different from control, *P < 0.01. (G) QUE-NL-induced mitochondrial membrane potential and mitochondrial dynamics regulated by QUE-NL. The mitochondrial membrane potential of cells was determined by retention of DiOC6(3) 40 μM added during the last 30 minutes of treatment. The amount of retained DiOC6(3) was measured by flow cytometry. (H) C6 glioma cells were respectively treated with the indicated concentrations of 200 μmol/L QUE-NL in the absence or presence of 200 μmol/L N-acetylcysteine for 12 hours. (I) C6 glioma cells were respectively treated with 200 μmol/L N-acetylcysteine alone for 12 hours. (J) QUE-NL-induced loss of mitochondrial membrane potential is inhibited with N-acetylcysteine. The alteration of mitochondrial membrane potential was analyzed by flow cytometer. The values reported represent the mean ± standard deviation of three separate experiments. *P < 0.01 compared with control cells. (K) ROS and ΔΨm levels in the presence or absence of QUE-NL treatment in C6 glioma cells for 12 hours by flow cytometric analysis; the cells were exposed to QUE-NL (200, 400 μM) for various intervals of time. The zero concentration was defined as the untreated control. The percentage of cells in ROS production and loss of ΔΨm were stained by specific dyes and determined by flow cytometry as described in the Methods section.
Notes: Values are means ± standard deviation (n = 3). Groups not sharing a same letter are significantly different to 0 hours by Student’s t-test (*P < 0.05; **P < 0.01 and ***P < 0.001).
Abbreviations: NAC, N-acetylcysteine; ROS, reactive oxygen species; QUE, quercetin; QUE-NL, nanoliposomes.
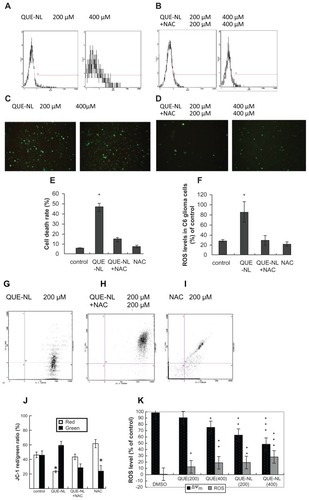
To determine whether the mitochondrial pathway is involved in induction of cell necrosis by QUE-NL, we examined changes in ΔΨm and release of proapoptotic molecules from the mitochondria in response to treatment with QUE-NL. As shown in , QUE-NL induced significant dissipation of ΔΨm, indicating that QUE-NL-induced cell death is accompanied by mitochondrial dysfunction. Moreover, N-acetylcysteine markedly inhibited QUE-NL-induced ΔΨm. QUE-NL increased reactive oxygen species production and reduced ΔΨm as shown in . N-acetylcysteine decreased QUE-NL-induced reactive oxygen species production () and the percentage of cell death was decreased by 28.6% in the presence of N-acetylcysteine 0.2 mM ().
Caspase-3 and caspase-9 activity and cytochrome c protein levels
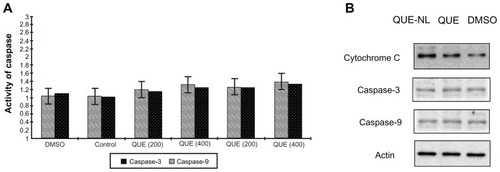
It can be seen in that QUE-NL had no effect on protein levels of caspase-3 and caspase-9 but promoted levels of cytochrome c. These results are in agreement with other reports.Citation19 Even though cytochrome c is released from mitochondria in necrotic cells, due to the decrease in total cytochrome c, it cannot interact with caspase-3 and caspase-9 to form apoptosomes; thus, the caspase cascade could not be activated for apoptotic occurrences.
Figure 5 QUE-NL induced necrosis is associated with loss of mitochondrial membrane potential and the changes of ROS and cytochrome C release and caspase activation. (A) QUE-NL did not stimulate caspase-3 or caspase-9 activity compared with control cells. (B) QUE-NL-induced decrease of cytochrome C release and c QUE-NL did not promote the expression of caspase-3 or caspase-9 protein. The alteration of cytochrome C, caspase-3, caspase-9, and actin was analyzed by Western blotting.
Abbreviations: DMSO, dimethylsulfoxide; ROS, reactive oxygen species; QUE, quercetin; QUE-NL, nanoliposomes.
ATP levels, lactate dehydrogenase activity, and cell survival
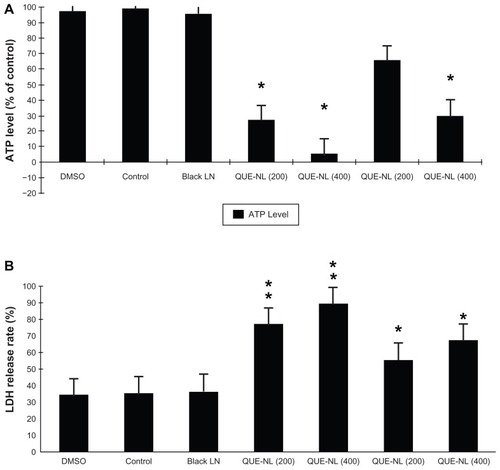
QUE-NL decreased ATP levels () by around 76%–94% (P < 0.01 and P < 0.001) but promoted lactate dehydrogenase activity () by about 40%–53% (P < 0.05 and P < 0.01). The percentage of viable cells was treated with QUE-NL or quercetin ().
Figure 6 QUE-NL affected the levels of ATP and LDH release rate in C6 glioma cells. ATP detection assay and LDH activity-based cytotoxicity assays of C6 glioma cells treated with QUE-NL or QUE.
Notes: n = 3, mean ± standard deviation. **P < 0.01 versus control group; *P < 0.05 versus control group.
Abbreviations: LDH, lactate dehydrogenase; QUE, quercetin; QUE-NL, nanoliposomes.
Discussion
It is well documented that cell death can be divided into apoptosis and necrosis.Citation20 Most chemotherapy drugs induce apoptosis, but some drugs can cause necrosis.Citation21 Necrosis is an irreversible inflammatory form of cell death, and it is also known that therapy-induced necrotic cell death initiates an immune response to tumor cells. However, whether or not the inflammation is associated with necrosis is still unclear, but therapeutic agents that target regulators of necrotic cell death are already in early-phase clinical trials.Citation22
Several studies have also shown that certain types of cell death share both apoptotic and necrotic mechanisms in a process newly termed “necrapoptosis”.Citation23,Citation24 QUE-NL induces morphological necrotic changes in cells and decreases cell viability in a dose-dependent and time- dependent manner. These studies have also shown the existence of several common points in the necrotic and apoptotic pathway, indicating that the signaling cross point is modulated. Therefore, the mode of cell death can be switched from apoptosis to programmed necrosis and vice versa, which further supports the idea that necrosis is programmed and controllable.
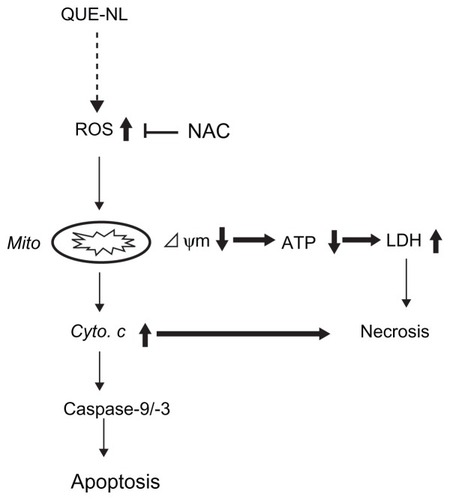
QUE-NL can induce cell death which may not involve apoptosis. Therefore, we investigated the induction of cell death in C6 glioma cells after exposure to QUE-NL. The results of this study indicate that QUE-NL induced necrotic cell death not only by decreasing the ΔΨm, but also by promoting reactive oxygen species. QUE-NL-induced changes in ΔΨm and cytochrome C release had no effects on caspase activation, but a reduction in ATP levels and increased lactate dehydrogenase activity indicates that QUE-NL stimulated necrotic cell death ().
Figure 7 Diagram of mechanisms underlying the synergy between QUE-NL induced necrosis.
Abbreviations: LDH, lactate dehydrogenase; NAC, N-acetylcysteine; ROS, reactive oxygen species; QUE, quercetin; QUE-NL, nanoliposomes; ATP, adenosine triphosphate.
Quercetin is usually considered to be an excellent free radical scavenging antioxidant because of the high number of hydroxyl groups and conjugated orbitals via which quercetin can donate electrons or hydrogen ions, as well as scavenge H2O2 and superoxide anions.Citation25 This is possible because QUE has both antioxidant and pro-oxidant properties. In the presence of a low glutathione content, oxidized quercetin reacts with protein thiols, exerting a toxic effect on cells.Citation26,Citation27 Similarly, longer exposure to quercetin along with a high quercetin concentration causes a reduction in glutathione content, suggesting the inability of quercetin to decrease reactive oxygen species for that period. As a consequence, the pro-oxidant effect of quercetin could prevail over the antioxidant effect and result in cell death by damaging cellular compartments.28,Citation29
In this study, QUE-NL induced nonapoptotic cell death (necrosis) rather than apoptosis. In addition, caspase-3 activation did not differ between the control and QUE-NL-treated groups. Caspase-3 activation is an important contributor to apoptosis.Citation30–Citation32 QUE-NL did not alter the levels of proteins associated with apoptosis. Furthermore, reactive oxygen species production can cause cell death, including involvement of necrosis.Citation33,Citation34 QUE-NL increased reactive oxygen species levels and decreased ΔΨm levels. QUE-NL-induced reactive oxygen species generation was reduced after pretreatment with N-acetylcysteine which increased the percentage of viable cells, suggesting that QUE-NL-induced necrotic cell death is associated with production of reactive oxygen species.
Summary
All these results indicate that QUE-NL may have enhanced quercetin solubility, with improved bioactivity for inhibiting tumors, and its anticancer effect may be the result of long exposure to C6 glioma cells along with a high quercetin concentration causing a reduction in glutathione content and quercetin to accumulate a high reactive oxygen species level for that period. Thus, the pro-oxidant effect of quercetin could prevail over the antioxidant effect and result in cell death. Cell death due to necrosis is associated with decreases in ΔΨmCitation35,Citation36 and ATP levels,Citation37 and we observed that QUE-NL did indeed reduce ΔΨm and ATP levels. It has been shown that necrotic cell death involved the release of lactate dehydrogenase.Citation38 In the present study, QUE-NL increased lactate dehydrogenase levels. Our findings are in agreement with other reportsCitation37 showing production of reactive oxygen species, loss of ΔΨm, and ATP depletion in cancer cells, and that those cells undergo type III (necrotic) programmed cell death. In summary, QUE-NL is shown to be a new agent for targeted glioma treatment because it induces necrotic cell death, so may have an application as a new anticancer drug candidate.
Acknowledgments
We thank RM Li for the cell lines and Hubei Provincial Key Laboratory for the embryonic stem cells used in our experiments, ZQ Liu and JB Feng for assisting with the flow cytometry, and DS Li for discussions regarding the chemical aspects of this work. This research was supported by funding from the Hubei Provincial Education Department and Pharmacy of Department at Taihe Hospital.
Disclosure
The authors declare no conflicts of interest in this work.
References
- ClarkePGDevelopmental cell death: morphological diversity and multiple mechanismsAnat Embryol (Berl)19901811952132186664
- GozuacikDKimchiAAutophagy as a cell death and tumor suppressor mechanismOncogene2004232891290615077152
- ArendsMJWyllieAHApoptosis: mechanisms and roles in pathologyInt Rev Exp Pathol1991322232541677933
- JaattelaMTschoppJCaspase-independent cell death in T lymphocytesNat Immunol2003441642312719731
- OkadaHMakTWPathways of apoptotic and non-apoptotic death in tumour cellsNat Rev Cancer2004459260315286739
- CastroMGCowenRWilliamsonIKCurrent and future strategies for the treatment of malignant brain tumorsPharmacol Ther2003987110812667889
- XavierCPLimaCFRohdeMPereira-WilsonCQuercetin enhances 5-fluorouracil-induced apoptosis in MSI colorectal cancer cells through p53 modulationCancer Chemother Pharmacol2011681449145721479885
- SiegelinMDReussDEHabelARamiAvon DeimlingAQuercetin promotes degradation of surviving and thereby enhances death-receptor-mediated apoptosis in glioma cellsNeuro Oncol20096123129
- OngCSTranENguyenTTQuercetin-induced growth inhibition and cell death in nasopharyngeal carcinoma cells are associated with increase in Bad and hypophosphorylated retinoblastoma expressionsOncol Rep20041172773314767529
- GuptaKPandaDPerturbation of microtubule polymerization by quercetin through tubulin binding: a novel mechanism of its antiproliferative activityBiochemistry200241130291303812390030
- WangIKLin-ShiauSYLinJKInduction of apoptosis by apigenin and related flavonoids through cytochrome c release and activation of caspase-9 and caspase-3 in leukaemia HL-60 cellsEur J Cancer1999351517152510673981
- YuanZPChenLJFanLYLiposomal quercetin efficiently suppresses growth of solid tumors in murine modelsClin Cancer Res2006123193319916707620
- LiLHanWGuYHonokiol induces a necrotic cell death through the mitochondrial permeability transition poreCancer Res2007674894490317510419
- LeeJHLiYCIpSWThe role of Ca2+ in baicalein-induced apoptosis in human breast MDA-MB-231 cancer cells through mitochondria- and caspase-3-dependent pathwayAnticancer Res2008281701171118630529
- LinCCYangJSChenJTBerberine induces apoptosis in human HSC-3 oral cancer cells via simultaneous activation of the death receptor-mediated and mitochondrial pathwayAnticancer Res2007273371337817970083
- LuHFHsuehSCHoYTROS mediates baicalin-induced apoptosis in human promyelocytic leukemia HL-60 cells through the expression of the Gadd153 and mitochondrial dependent pathwayAnticancer Res20072711712517352223
- HuanSKLeeHHLiuDZWuCCWangCCCantharidin-induced cytotoxicity and cyclooxygenase 2 expression in human bladder carcinoma cell lineToxicology200622313614316697099
- LiuTZChenCYYiinSJMolecular mechanism of cell cycle blockage of hepatoma SK-Hep-1 cells by Epimedin C through suppression of mitogen-activated protein kinase activation and increased expression of CDK inhibitors p21(Cip1) and p27(Kip1)Food Chem Toxicol20064422723516112786
- DodoKKatohMShimizuTTakahashiMSodeokaMInhibition of hydrogen peroxide-induced necrotic cell death with 3-amino-2-indolyl-maleimide derivativesBioorg Med Chem Lett2005153114311815878276
- DiveCGregoryCDPhippsDJAnalysis and discrimination of necrosis and apoptosis (programmed cell death) by multiparameter flow cytometryBiochim Biophys Acta199211332752851737061
- MiyoshiNWatanabeEOsawaTATP depletion alters the mode of cell death induced by benzyl isothiocyanateBiochim Biophys Acta2008178256657318675902
- AmaravadiRKThompsonCBThe roles of therapy-induced autophagy and necrosis in cancer treatmentClin Cancer Res2007137271727918094407
- LimSCChoiJEKimCHEthyl pyruvate induces necrosis-to-apoptosis switch and inhibits high mobility group box protein 1 release in A549 lung adenocarcinoma cellsInt J Mol Med20072018719217611636
- LemastersJJVNecrapoptosis and the mitochondrial permeability transition: shared pathways to necrosis and apoptosisAm J Physiol1999276G169886971
- HeijnenCGHaenenGRvan AckerFAvan der VijghWJBastAFlavonoids as peroxynitrite scavengers: the role of the hydroxyl groupsToxicol in Vitro2001153611259863
- BootsAWBalkJMBastAHaenenGRThe reversibility of the glutathionyl-quercetin adduct spreads oxidized quercetin-induced toxicityBiochem Biophys Res Commun200533892392916246300
- BootsAWLiHSchinsRPThe quercetin paradoxToxicol Appl Pharmacol2007222899617537471
- FerraresiRTroianoLRoatEEssential requirement of reduced glutathione (GSH) for the anti-oxidant effect of the flavonoid quercetinFree Radic Res2005391249125816298752
- KimGNJangHDProtective mechanism of quercetin and rutin using glutathione metabolism on HO induced oxidative stress in HepG2 cellsAnn N Y Acad Sci2009117153053719723100
- JuanMEWenzelUDanielHPlanasJMErythrodiol, a natural triterpenoid from olives, has antiproliferative and apoptotic activity in HT-29 human adenocarcinoma cellsMol Nutr Food Res20085259559918384095
- OhJIChunKHJooSHOhYTLeeSKCaspase-3-dependent protein kinase C delta activity is required for the progression of Ginsenoside-Rh2-induced apoptosis in SK-HEP-1 cellsCancer Lett200523022823816297709
- YuSWWangHPoitrasMFMediation of poly(ADP-ribose) polymerase-1-dependent cell death by apoptosis-inducing factorScience200229725926312114629
- WaringPRedox active calcium ion channels and cell deathArch Biochem Biophys2005434334215629106
- LemastersJJQianTHeLRole of mitochondrial inner membrane permeabilization in necrotic cell death, apoptosis, and autophagyAntioxid Redox Signal2002476978112470504
- BaigiMGBraultLNeguesqueAApoptosis/necrosis switch in two different cancer cell lines: influence of benzoquinone- and hydrogen peroxide-induced oxidative stress intensity, and glutathioneToxicol In Vitro2008221547155418619529
- LeistMSingleBCastoldiAFKuhnleSNicoteraPIntracellular adenosine triphosphate (ATP) concentration: a switch in the decision between apoptosis and necrosisJ Exp Med1997185148114869126928
- NishikawaKSatohHHiraiAAlpha-tocopheryloxybutyric acid enhances necrotic cell death in breast cancer cells treated with chemotherapy agentCancer Lett2003201515614580686