Abstract
In this paper, a sensitive chronocoulometric deoxyribonucleic acid (DNA) biosensor based on a nanostructure gold electrode was fabricated for detection of the femtomolar level survivin gene which was correlated with osteosarcoma by using hexaamine-ruthenium III complexes, [Ru(NH3)6]3+, as the electrochemical indicator. The effect of different frequencies on the real surface area of the nanostructure gold electrode obtained by repetitive square-wave oxidation reduction cycle was investigated. At the optimal frequency of 8000 Hz, the real surface of the developed nanostructure gold electrode was about 42.5 times compared with that of the bare planar gold electrode. The capture probe DNA was immobilized on the nanostructure gold electrode and hybridized with target DNA. Electrochemical signals of hexaamine-ruthenium III bound to the anionic phosphate of DNA strands via electrostatic interactions were measured by chronocoulometry before and after hybridization. The increase of the charges of hexaamine-ruthenium III was observed upon hybridization of the probe with target DNA. Results indicate that this DNA biosensor could detect the femtomole (fM) concentration of the DNA target quantitatively in the range of 50 fM to 250 fM; the detection limit of this DNA biosensor was 5.6 fM (signal to noise = 3). This new biosensor exhibits excellent sensitivity and selectivity and has been used for an assay of polymerase chain reaction (PCR) with a satisfactory result.
Introduction
Osteosarcoma is the most common malignant bone tumor and occurs most frequently during adolescence. Current treatment protocols for osteosarcoma include radical surgery and neoadjuvant chemotherapy, which has increased survival rates from 20% to 75%.Citation1 Clinically, prognosis is determined postoperatively by response to chemotherapy, tumor size, and wide surgical margin, which in the past has been the only useful prognostic parameter. In recent years, some studies have demonstrated that survivin is correlated with osteosarcoma and could be used as a molecular marker for prognosis of osteosarcoma.Citation2,Citation3
Survivin is a member of the inhibitor of apoptosis protein (IAP) family. It is characterized by the presence of a single baculoviral inhibitor of apoptosis protein repeat and lacks a carboxyl terminal “really interesting new gene” finger domain in its protein structure.Citation4–Citation6 The survivin protein functions to inhibit caspase activation, thereby leading to negative regulation to apoptosis or programmed cell death.Citation7 It is considered to be an important factor that provides potent resistance against chemotherapeutic drugs.Citation8 Several studies have demonstrated resistance of survivin-expressing cells to anticancer drug-induced apoptosis.Citation9,Citation10 Moreover, the survivin protein is expressed highly in fetal tissue and most human tumors such as gastric cancer, breast cancer, lung cancer, colorectal cancer, pancreatic cancer, urinary bladder cancer, soft tissue cancer, neuroblastoma, and osteosarcoma, but is completely absent in normal differentiated cells.Citation11 Therefore, survivin could be used as an ideal biomarker for cancer prognosis and may also offer therapeutic alternatives for cancer treatment. Citation12,Citation13 In recent years, monitoring methods of survivin gene include chromosome analysis,Citation14 fluorescence in situ hybridization,Citation15 flow cytometry,Citation16 and real-time quantitative reverse transcription polymerase chain reaction (PCR).Citation17 But there are some limitations to these methods, such as time consuming, poor precision, and expensiveness. Therefore, it is very important to develop a new effective method to detect the survivin gene.
Electrochemical biosensor, as a monitoring technique, is widely considered to be promising for diagnosis of genetic diseases and other biological analyses due to its rapid and sensitive response as well as simple and convenient operation.Citation18–Citation21 Recent developments in nanomaterials and nanotechnologies have greatly improved the sensitivity and selectivity of electrochemical biosensors.Citation22,Citation23 Chang et al fabricated an ultrasensitive electrochemical nucleic acid biosensor using the conducting polyaniline nanotube array as the signal enhancement element, and could readily detect the target oligonucleotide at a concentration as low as 1.0 femtomole (fM).Citation24 Zhang et al developed a chronocoulometric deoxyribonucleic acid (DNA) biosensor based on nanoparticle-mediated amplification and nanoscale control of DNA assembly at electrodes.Citation25 This DNA sensor could detect as low as femtomolar DNA targets and exhibited excellent selectivity against even a single-base mismatch. The introduction of nanomaterial could efficiently increase the electrode surface area and enlarge the DNA immobilization amount. On the other hand, some dependent reagents in the preparation of nanomaterial produced a negative impact on the fabricated biosensor.Citation26,Citation27 Moreover, particle aggregation often existed in gold nanoparticles.
To overcome the drawbacks mentioned above, high surface area nanostructure gold (NSG) has recently attracted increasing attention due to its fascinating properties, such as superior conductivity, large surface area, high stability, and biocompatibility. Several methods, such as electrochemical deposition,Citation28,Citation29 electrochemical erosion,Citation30 electrochemical oxidation/chemical reduction processes,Citation31 chemical dealloying of alloys,Citation32–Citation34 electrochemical alloying/dealloying,Citation35–Citation37 and template synthesis,Citation38–Citation40 were reported to be used to prepare nanostructure materials. However, the catalytic activities of NSG electrodes prepared by electrochemical erosion and electrochemical oxidation/chemical reduction are low. The chemical dealloying of alloys method requires complicated advance processes to prepare the gold alloys. The preparation process of the template synthesis method is too complicated. Finally, direct electrode position from chloroauric acid solution is a rapid and easy way to obtain gold nanofilm, but the prepared gold nanofilm is incompact with a comparatively small quantity of nanoparticles.
A straightforward, rapid and “green” approach for the fabrication of nanostructure material was proposed by the repetitive square-wave oxidation reduction cycle (SWORC). Bilmes et al prepared roughened platinum by using repetitive SWORC, which was used for the enhancement of surface-enhanced Raman scattering.Citation41 Gamero et al developed a biosensor for the detection of lactate using a nanostructured rough gold surface prepared with repetitive SWORC as transducer. Citation42 Recently, the authors fabricated an electrochemical DNA biosensor based on this NSG electrode for detection of promyelocytic leukemia/retinoic acid receptor α fusion gene by using methylene blue as electroactive indicator.Citation43
In this work, a chronocoulometric DNA based on an NSG electrode was fabricated for detection of the survivin gene which was correlated with osteosarcoma. The captured DNA was self-assembled onto a NSG electrode surface via a gold–sulfur bond, and then hybridized with target DNA. Cyclic voltammetry and chronocoulometry was employed to monitor variation before and after hybridization by using hexaamine-ruthenium III complexes, [Ru(NH3)6]3+ (RuHex), as an electroactive indicator. RuHex, as an electroactive signaling molecule, binds to the anionic phosphate of DNA strands through electrostatic interaction and is free of any duplex intercalation.Citation44 As a result, the redox charge of RuHex is a direct function of the amounts of DNA strands localized at electrode surfaces.Citation44 This new method is able to detect 5.6 fM synthetic target DNA and demonstrates its excellent differentiation ability for single-base mismatch and complementary (double-stranded DNA; dsDNA) after hybridization.
Material and methods
Chemicals and materials
Ethylenediaminetetraacetic acid, mercaptohexanol (MCH), and RuHex were purchased from Sigma-Aldrich Corporation (St Louis, MO). Tris(2-carboxyethyl)phosphine hydrochloride was purchased from Shanghai Sangon Biological Engineering Technology and Services Co, Ltd (Shanghai, China). Potassium ferricyanide and potassium ferrocyanide obtained from Sinopharm Chemical Reagent Co, Ltd (Shanghai, China). All other chemicals were of analytical grade and used without further purification.
All synthetic oligonucleotides designed according to survivin messenger ribonucleic acid were purchased from Takara Biotechnology Co, Ltd (Dalian, China). Their base sequences were as follows: immobilized probe (22-base sequence S1) 5′-hydrosulfuryl (HS)-TTG GAG GGC TGC GCC TGC ACC C-3′; target DNA (22-base sequence S2) 5′-GGG TGC AGG CGC AGC CCT CCA A-3′; single-mismatched DNA (22-base sequence S3) 5′-GGG TGC AGC CGC AGC CCT CCA A-3′; noncomplementary DNA (22-base sequence S4) 5′-CGG GGA GGC AGC CAT TGA GAC C-3′. Stock solutions of RuHex (1.0 mM) were prepared with deionized water. The buffer solutions employed in this study were as follows: DNA immobilization buffer was 10 mM tris(hydroxymethyl)aminomethane-hydrochloride (tris-HCl), 1.0 mM ethylenediaminetetraacetic acid, 10 mM tris(2-carboxyethyl)phosphine hydrochloride (pH 7.4), and 1.0 M sodium chloride; hybridization buffer was 1 M sodium chloride and 10 mM phosphate buffered saline (pH 7.4); buffer for both electrochemistry and electrode washing was 10 mM tris-HCl solution (pH 7.4). All solutions were prepared with Milli-Q™ water (18.2 MΩ cm resistivity) from a Millipore system (Millipore Corporation, Billerica, MA).
Apparatus
All electrochemical measurements were performed on a CHI760D electrochemical workstation (CH Instruments, Inc, Austin, TX). Electrochemical experiments were carried out with a conventional three-electrode system comprising a gold working electrode, a platinum wire auxiliary electrode, and a silver/silver chloride (with saturated potassium chloride) reference electrode. All potentials herein were referred to this reference electrode. Cyclic voltammetry was carried out at a scan rate of 50 mV/second and chronocoulometry at a pulse width of 250 milliseconds. Scanning electron microscopic (SEM) images were obtained using an XL-30E scanning electron microscopy (Philips, Amsterdam, the Netherlands). The electrolyte buffer was thoroughly purged with nitrogen before experiments.
Preparation of NSG electrode
The detailed procedure used to prepare nanostructure has been described previously except for the different frequency in SWORC fabrication process for real surface area increase.Citation43 The improved NSG electrode procedures are briefly described here. The bare planar gold electrode surface (2 mm in diameter) was freshly polished prior to use with 1.0, 0.3, and 0.05 μm alumina powder, respectively, and then cleaned ultrasonically sequentially in ethanol and water for 5 minutes. After electrochemically cleaning in fresh 0.5 M sulfuric acid solution to remove any possible impurities on the surface,Citation45 the gold electrode was then subjected to electrochemical pretreatment by two consecutive stages. Firstly, a relatively thick hydrous gold oxide layer was accumulated on the gold electrode immersed in 0.5 M sulfuric acid by using repetitive square-wave potential between −0.8 V and 2.5 V (versus silver/silver chloride electrode) at different frequencies for a time of 5 minutes. In the following stage, the potential was held at −0.8 V until complete electroreduction of the hydrous gold oxide layer was accomplished.Citation41 The resulting NSG electrode was sonicated in deionized water for 1 minute and cycled at 0.1 V/second between −0.35 V and 1.5 V in 0.5 M sulfuric acid solution to clean the surface of the electrode, and check variations in the electroadsorption charge of the O adatoms between the rough gold electrode and planar gold electrode.
DNA self-assembly and hybridization at NSG electrode
The cleaned nanostructure electrode was immersed into an immobilization buffer containing 10 μM capture probe modified with thiolate for 2 hours at room temperature to form a self-assembled monolayer. The single-stranded DNA (ssDNA)-modified electrode was then treated with 1.0 mM MCH for 1 hour to obtain a well-aligned ssDNA/MCH-modified electrode,Citation46 followed by thoroughly washing with deionized water to remove unspecific adsorbed DNA probe. The ssDNA/MCH-modified electrode was immersed in phosphate buffered saline solution containing synthetic targets or PCR real samples for 30 minutes at 45°C to form dsDNA.Citation47 The PCR real samples should be heated at 95°C for 10 minutes and cooled in an ice bath before use. After that, dsDNA-modified electrodes were washed with deionized water and immersed in 0.1% sodium dodecyl sulfate phosphate buffer (pH 7.40) to remove unbound oligonucleotides before RuHex accumulation.
DNA hybridization detection with an electrochemical indicator of RuHex
The probe DNA or hybridized electrodes were firstly immersed into 10 mM tris-HCl solutions (pH 7.4) containing 20 μM RuHex for 30 minutes, and then the cyclic voltammograms and chronocoulometry were recorded in blank 10 mM tris-HCl solutions.
Results and discussion
Preparation of NSG electrode
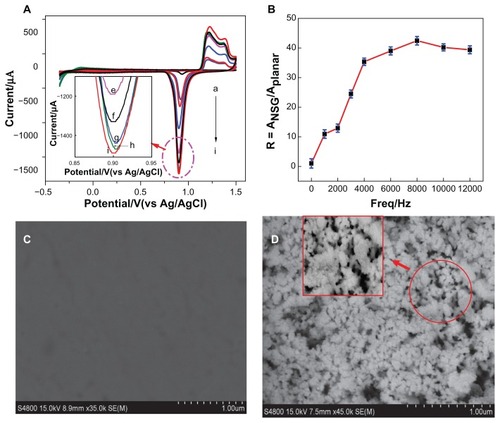
A schematic representation of the novel sensor fabrication procedure is shown in . The NSG electrode was firstly prepared by a repetitive SWORC strategy and then used as the substrate for DNA immobilization and hybridization. In order to examine the effect of frequency on real surface area of the NSG electrode, different frequency was applied in the preparation of the NSG electrode. As shown in , the real surface area increased with increasing frequency and reached maximum value when the cleaned planar gold electrode was immersed in 0.5 M sulfuric acid by using repetitive square-wave potential between −0.8 V and 2.5 V (versus silver/silver chloride reference electrode) at 8000 Hz for 5 minutes. The maximum real surface area was about 42.5 times compared with that of the planar gold electrode by assuming that the reduction of the monolayer of gold oxide requires 386 μCcm−2. SEM images of the same gold electrode before and after pretreatment of SWORC at 8000 Hz for 5 minutes are shown in . As shown in , the NSG electrode surface was divided into two layers. The bottom layer was a brain-like nanostructure, which is the same as one reported in previous work.Citation43 The upper layer was a cotton-wool-like nanostructure. The real surface of the NSG electrode prepared by this strategy was larger than those of direct electrochemical deposition gold strategy,Citation29 dealloying strategy from silver/gold alloys,Citation48 three-dimensionally ordered macroporous template strategy,Citation39 and hydrogen bubble dynamic template synthesis strategy.
Figure 1 Schematic representation of the fabrication procedure of deoxyribonucleic acid biosensor based on nanostructure gold electrode.
Abbreviations: AuE, gold electrode; DNA, deoxyribonucleic acid; HS, hydrosulfuryl; MCH, mercaptohexanol; RuHex, hexaamine-ruthenium III; SWORC, square-wave oxidation reduction cycle.
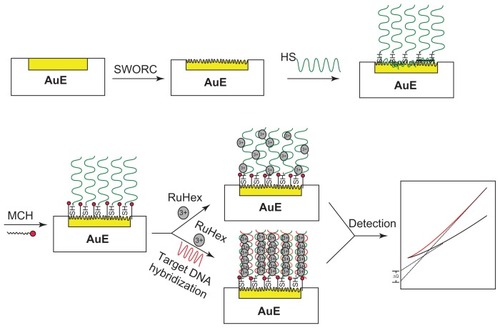
Figure 2 (A) Cyclic voltammograms of nanostructure gold electrode with different frequency in a solution of 0.5 M sulfuric acid at a scan rate of 100 mV/second. (a) 0 Hz, (b) 1000 Hz, (c) 2000 Hz, (d) 3000 Hz, (e) 4000 Hz, (f) 6000 Hz, (g) 12,000 Hz, (h) 10,000 Hz, and (i) 8000 Hz. (B) Effect of frequency on real surface area of nanostructure gold electrode by integration of the reduction peak of cyclic voltammograms in a solution of 0.5 M sulfuric acid at a scan rate of 100 mV/second (R = Ananostructure gold/Aplanar gold electrode). (C) Scanning electron microscopic image of the planar gold electrode and (D) after pretreatment of square-wave oxidation reduction cycle at 8000 Hz for 5 minutes.
Abbreviations: Ag, silver; AgCl, silver chloride; freq, frequency; vs, versus.
Electrochemical characteristics of the modified electrode surface
All electrochemical measurements were performed in 10 mM iron-hexacyano complexes, [Fe(CN)6]3−/4−, and 0.1 M potassium chloride solution at a scan rate of 100 mV/second. Electrochemical impedance spectroscopy was chosen as a marker to investigate the changes of the electrode behavior after each assembly step. The impedance spectra included a semicircle portion at higher frequencies corresponding to the electrotransfer-limited process and a linear portion at lower frequencies representing the diffusion-limited process. The semicircle diameter equaled the electrotransfer resistance (Ret), which dominated the electron transfer kinetics of the redox probe at the electrode interface. shows the Faradaic impedance spectra observed upon the stepwise modification process with the NSG electrode () and planar gold electrode () at a potential of 0.2 V (versus silver/silver chloride) in the frequency range of 0.05–105 Hz. Inset shows the electrical equivalent circuit. For the bare NSG electrode, the value of Ret was 0 Ω, demonstrating high conductivity due to its nanoporous architecture. When the probe was self-assembled onto the electrode surface, Ret increased from 0 Ω to 1862 Ω due to the electrostatic repulsion between the negatively-charged probe and the negatively-charged redox probe iron-hexacyano complexes. Ret decreased from 1862 Ω to 1547 Ω after the accumulation of RuHex onto the probe. The decrease in Ret was due to accumulation of positively-charged RuHex on the electrode surface, resulting in partial neutralization of the negative charges which promoted the ability of the redox probe to access the electrode surface. Subsequently, the target DNA was hybridized with the probe to form dsDNA and the value of Ret increased to 2573 Ω due to the large amount of negatively-charged DNA linked on the electrode surface. After accumulation of RuHex onto dsDNA, Ret decreased from 2573 Ω to 2179 Ω due to positively-charged RuHex bound to phosphates. For the planar gold electrode, Ret in each modification step increased sharply compared with corresponding step for the NSG electrode, which indicated that the NSG electrode possessed high conductivity due to its nanostructure architecture.
Figure 3 Impedance spectra (Nyquist plots) corresponding to (A) nanostructure gold electrode and (B) planar gold electrode. (a) Bare electrode, (b) after immobilization of capture probe, (c) after accumulation of hexaamine-ruthenium III to the single-stranded deoxyribonucleic acid, (d) hybridization with target deoxyribonucleic acid, and (e) after accumulation of hexaamine-ruthenium III to the double-stranded deoxyribonucleic acid.
Notes: Data were recorded in the presence of 10 mM iron-hexacyano complexes, [Fe(CN)6]3−/4−, as redox label. Biased potential was 0.08 V (versus silver/silver chloride) in the frequency range of 0.05–105 Hz and amplitude was 5.0 mV.
Abbreviation: Ret, electrotransfer resistance.
![Figure 3 Impedance spectra (Nyquist plots) corresponding to (A) nanostructure gold electrode and (B) planar gold electrode. (a) Bare electrode, (b) after immobilization of capture probe, (c) after accumulation of hexaamine-ruthenium III to the single-stranded deoxyribonucleic acid, (d) hybridization with target deoxyribonucleic acid, and (e) after accumulation of hexaamine-ruthenium III to the double-stranded deoxyribonucleic acid.Notes: Data were recorded in the presence of 10 mM iron-hexacyano complexes, [Fe(CN)6]3−/4−, as redox label. Biased potential was 0.08 V (versus silver/silver chloride) in the frequency range of 0.05–105 Hz and amplitude was 5.0 mV.Abbreviation: Ret, electrotransfer resistance.](/cms/asset/b0ff5949-ba35-4e0b-9772-b66f732920b7/dijn_a_27794_f0003_c.jpg)
Electrochemical response of RuHex-bound probe
Detection of hybridization was accomplished by using RuHex as the signaling molecule. Previous studies demonstrated that RuHex could bind to DNA by electrostatic interaction since the DNA backbone has a negative charge.Citation44 Cyclic voltammetry was first employed to characterize the electrochemistry of RuHex at NSG electrode surfaces with DNA/MCH monolayers. As shown in , a pair of peaks corresponding to the reduction and oxidation of RuHex could be observed at 10 mM tris-HCl containing 20 μM RuHex (, curve b), indicating that the electron transfer reaction of RuHex at the DNA/MCH surface was a surface-confined redox process since the peak currents were linearly proportional to scan rates. This pair of peaks was ascribed to RuHex electrostatically binding to the DNA surface and reflected the amount of DNA on the NSG electrode surface. Citation49 After hybridization of the immobilized probes with the complementary DNA sequence, the amount of RuHex electrostatically binding to the NSG electrode surface increased and finally resulted in much higher current signals (, curve a). Cyclic voltammograms of the planar gold electrode before and after hybridization are shown in , curves c and d. Results indicate that the current signals of the NSG electrode were much higher than that of the planar, which could be explained by the amount immobilized on the NSG electrode increasing due to the large real surface area.
Figure 4 (A) Cyclic voltammograms and (B) chronocoulometry curves for 20 μM hexaamine-ruthenium III as redox indicator at (a) double-stranded deoxyribonucleic acid modified nanostructure gold electrode, (b) single-stranded deoxyribonucleic acid modified nanostructure gold electrode, (c) double-stranded deoxyribonucleic acid modified planar gold electrode, and (d) single-stranded deoxyribonucleic acid modified planar gold electrode. Electrolyte was 10.0 mM tris buffer (pH 7.4) containing 20 μM hexaamine-ruthenium III.
Note: Scan rate = 50 mV/second, pulse period = 250 milliseconds.
Abbreviations: Ag, silver; AgCl, silver chloride; s, seconds; vs, versus.
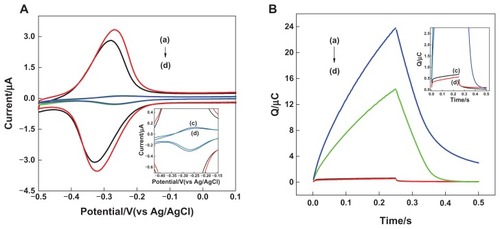
Previous studies demonstrated that the RuHex/DNA/electrode system generated significantly more intense signal in chronocoulometry than in voltammetry.Citation50,Citation51 Chronocoulometry was then carried out to characterize the redox process of RuHex. Charges of RuHex were measured before and after hybridization with the target DNA (). A significant increase of charges was observed after hybridization with 10 nM target DNA due to the increase of RuHex bound onto the NSG electrode surface (, curves a and b). Thus, the increase of charges reflected the extent of hybrid formation. For comparison, chronocoulometry of a planar gold electrode-based biosensor with the same target concentrations was also investigated (, curves c and d). The increment of charges observed on the NSG electrode was about 60 times higher than that of the planar gold electrode, which demonstrated that the NSG-based biosensor greatly increased the efficiency of hybridization.
Selectivity of electrochemical DNA biosensor
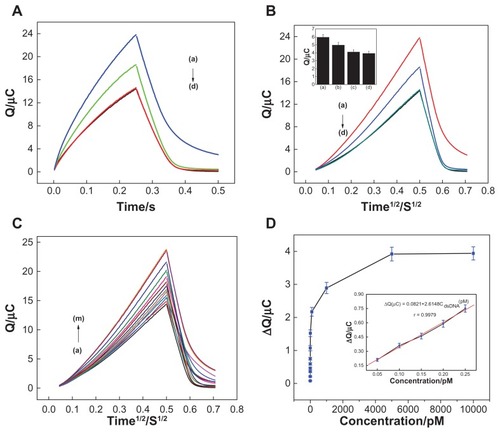
showed the chronocoulometry curves of the DNA-modified NSG electrodes measured in blank tris- HCl buffer solution after immersion in 20 μM RuHex of 10 mM tris-HCl (pH 7.4) for 30 minutes. It was clear that the lowest charges were obtained on the ssDNA-modified NSG electrode (, curve d). A significant increase of charges was observed after hybridization with complementary target DNA (, curve a), which indicated that the probe had completely hybridized with complementary DNA. In the presence of single-base mismatched DNA, the redox charges of RuHex (, curve b) significantly decreased compared with complementary DNA, showing that hybridization of the capture probe with single-base mismatched DNA was incomplete. Moreover, almost the same redox charges were obtained when the sole capture probe was hybridized with noncomplementary target DNA (, curve c), demonstrating that no successful hybridization occurred due to sequence mismatch. Chronocoulometric response curves were converted to Anson plots by plotting charge versus half-life (). The linear part of the Anson plot was then extrapolated back to time zero to obtain the intercept of the plot for ssDNA and hybridization with complementary target DNA, single-base mismatched DNA, and noncomplementary target DNA. Chronocoulometry experiments showed high selectivity of the constructed DNA biosensor for discriminating complementary DNA from single-base mismatched DNA and noncomplementary DNA.
Figure 5 (A) Chronocoulometry curves using 20 μM hexaamine-ruthenium III as redox indicator for (d) probe-modified nanostructure gold electrode, and after hybridization with (a) complementary target sequence, (b) single-base mismatch sequence, and (c) noncomplementary sequence. (B) Chronocoulometry transients of hexaamine-ruthenium III for (d) probe-modified nanostructure gold electrode, and after hybridization with (a) complementary target sequence, (b) single-base mismatch sequence, and (c) noncomplementary sequence. (C) Chronocoulometry transients for nanostructure gold electrodes with capture probe hybridized with target DNA at a series of concentrations: (a) 0 M, (b) 20 fM, (c) 50 fM, (d) 100 fM, (e) 150 fM, (f) 200 fM, (g) 250 fM, (h) 1pM, (i) 10 pM, (j) 100 pM, (k) 1 nM, (l) 5 nM, and (m) 10 nM. (D) Calibration curve of the deoxyribonucleic acid sensor, where the definition of signal is the same as that in Figure 5C. Inset shows the plot of the charge increment of hexaamine-ruthenium III as a function of the target concentration. Concentration of target deoxyribonucleic acid was 50 fM, 100 fM, 150 fM, 200 fM, and 250 fM.
Notes: Error bars represent relative standard deviation of three independent experiments. Other experimental conditions are as described in .
Abbreviation: s, seconds.
Sensitivity of the NSG-based biosensor
To further evaluate the detection performance of the NSG-based biosensor, the charges of RuHex were measured after hybridization with target DNA at different concentrations. show that the charges of RuHex on the NSG electrode increased with increasing target DNA concentration (ranging from 20 fM to 5 nM) and then tended to remain constant, indicating that all available immobilized probes on the NSG electrode surface were involved in hybridization. Inset shows that the increment of charges was related to target concentrations across the range of 50 fM to 250 fM, with the regression equation being ΔQ (μC) = 0.0821 + 2.6148 complementary dsDNA (pM), R = 0.9979. The detection limit was estimated to be 5.6 fM by using 3 σ (where σ is the standard deviation of the blank solution, n = 3). The reproducibility of the biosensor for detection of 0.15 pM target DNA was 7.32% (n = 3). The NSG-based biosensor possessed good molecular recognizability and could hybrid with completely complementary sequences well. Thus, this biosensor was used for detection of PCR amplified real samples.
Detection of electrophoresis and electrochemistry of PCR products
All PCR samples were obtained from the First Affiliated Hospital of Fujian Medical University (Fujian, China). The positive real sample, which came from an osteosarcoma patient, contained PCR product that had a sequence complementary to the specific survivin probe. The PCR product from a negative real sample, which came from a normal person, contained a sequence noncomplementary to the specific survivin probe. As the blank background, the PCR buffer system didn’t contain any DNA templates. shows the result of electrophoresis of PCR products. PCR amplification products from positive real samples (, lane 2) show the light brands in 1.5% agarose gel. However, PCR products from negative real samples (, lane 1) and blank background (, lane 3) did not present any light brands in the gel.
Figure 6 (A) Electropherogram of polymerase chain reaction products. The lanes from left to right: (1) negative real sample, (2) positive real sample, and (3) blank background. (B) Chronocoulometry transients using 20 μM hexaamine-ruthenium III as redox indicator for (e) probe-modified nanostructure gold electrode, (c) blank background, (b) after hybridization with the positive sample, (d) negative sample, and (a) the same concentration of target deoxyribonucleic acid.
Notes: Error bars represent relative standard deviation of three independent experiments. Experimental conditions are as described in .
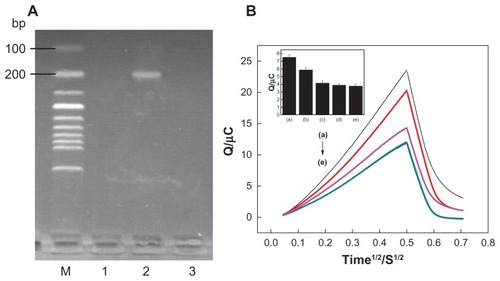
shows the chronocoulometry curves of RuHex when the capture probe was immobilized and different real samples were used in the hybridization step. The charges of RuHex obtained from the probe-modified NSG-based biosensor gave a mean average of 3.765 μC with a relative standard deviation (RSD) of 7.36%. Blank background was measured and the signals gave a mean average of 4.151 μC with an RSD of 7.59%. The charges of RuHex obtained from hybridization of the probe with positive and negative real samples gave a mean average of 5.879 μC with an RSD of 5.96% and 3.886 μC with an RSD of 6.15%, respectively. The charges obtained from hybridization of the probe with the same concentration of target DNA gave a mean average of 7.52 μC with an RSD of 5.35%. The signal of RuHex obtained from hybridization of the probe with positive real samples (, curve b) was much higher than that of the probe-modified NSG electrode (, curve e), indicating that hybridization at the NSG electrode surface occurred and the amount of RuHex bound with the hybrid increased. When the capture probe was hybridized with negative real samples which did not contain a target sequence, the signal of RuHex was almost the same as the probe-modified NSG electrode (, curves d and e), demonstrating that hybridization had not occurred due to sequence mismatch. Furthermore, the electrochemical signal obtained from hybridization of the probe with target DNA was higher than that of the same concentration of positive real samples, indicating that hybridization efficiency could be affected by the size of DNA fragment due to steric hindrance. Results showed that the electrochemical DNA biosensor was in good agreement with those obtained from gel electrophoresis.
Conclusion
A novel electrochemical DNA biosensor based on a nano-structure electrode was constructed for detection of survivin gene by using RuHex as an electrochemical indicator. Preparation of the nanostructure electrode was quite simple, economical, and controllable. Due to the large active surface, the NSG electrode possessed superior conductivity, activity, and biocompatibility. With the use of RuHex as an indicator, the optimized DNA biosensor could detect the target DNA at a concentration as low as 5.6 fM. The current fabricated biosensor was used for assay of the complementary sequence in PCR amplified real samples with satisfactory results. Moreover, this electrode modification strategy is expected to have further extensive applications in protein and enzyme biosensors.
Acknowledgments
The authors gratefully acknowledge the financial support of National High Technology and Development of China (863 Project: 2008AA02Z433), National Natural Science Foundation of China (20805006, 20975021, 81171668), Fujian Provincial University-Industry Cooperation Science and Technology Major Program (2010Y4003), Foundation of Fujian Key Laboratory of Hematology (2009J1004), Scientific Research Major Program of Fujian Medical University (09ZD013), Natural Science Foundation of Fujian Province of China (2010J06011), and Foundation of Fujian Provincial Department of Education (JA10126, JA11110).
Disclosure
The authors report no conflicts of interest in this work.
References
- BielackSSKempf-BielackBDellingGPrognostic factors in high-grade osteosarcoma of the extremities or trunk: an analysis of 1,702 patients treated on neoadjuvant cooperative osteosarcoma study group protocolsJ Clin Oncol200220377679011821461
- OsakaESuzukiTOsakaSSurvivin as a prognostic factor for osteosarcoma patientsActa Histochem Cytochem20063939510017327929
- TriebKLehnerRStulnigTSulzbacherIShroyerKRSurvivin expression in human osteosarcoma is a marker for survivalEur J Surg Oncol200329437938212711293
- VerdiciaMAHuangHDutilEKaiserDAHunterTNoelJPStructure of human anti-apoptotic protein survivin reveals a dimeric arrangementNat Struct Biol20007760260810876248
- ChantalatLSkoufiasDAKlemanJPJungBDidebergOMargolisRLCrystal structure of survivin reveals a bow tie-shaped dimmer with two unusual alpha-helical extensionsMol Cell20006118318910949039
- AmbrosiniGAdidaCAltieriDCA novel anti-apoptotic gene, survivin, expressed in cancer and lymphomaNat Med1997389179219256286
- LuCDAltieriDCTanigawaNExpression of a novel antiapoptosis gene, survivin, correlated with tumor cell apoptosis and p53 accumulation in gastric carcinomasCancer Res1998589180818129581817
- ZaffaroniNPennatiMCollelaGExpression of anti-apoptotic gene survivin correlates with taxol resistance in human ovarian cancerCell Mol Life Sci20025981406141212363043
- RodelCHassJGrothAGrabenbauerGGSauerRRödelFSpontaneous and radiation-induced apoptosis in colorectal carcinoma cells with different intrinsic radiosensitivities: survivin as a radioresistance factorInt J Radiat Oncol Biol Phys20035551341134712654446
- TaranJMasterZYuJIRakJDumontDJKerbelRSA role of survivin in chemoresistance of endothelial cells mediated by VEGFProc Natl Acad Sci U S A20029974349435411917134
- SahNKKhanZKhanGJBisenPSStructural, functional and therapeutic biology of survivinCancer Lett2006244216417116621243
- YamamotoTTanigawaNThe role of survivin as a new target of diagnosis and treatment in human cancerMed Electron Microsc200134420721211956993
- AltieriDCThe molecular basis and potential role of survivin in cancer diagnosis and therapyTrends Mol Med200171254254711733216
- LiFZAltieriDCThe cancer antiapoptosis mouse survivin gene: characterization of locus and transcriptional requirements of basal and cell cycle-dependent expressionCancer Res199959133143315110397257
- ConwayEMPollefeytSCornelissenJThree differentially expressed survivin cDNA variants encode proteins with distinct antiapoptotic functionsBlood20009541435144210666222
- ChoiKSLeeTHJungMHRibozyme-mediated cleavage of the human survivin mRNA and inhibition of antiapoptotic function of survivin in MCF-7 cellsCancer Gene Ther2003102879512536196
- FalleniMPellegriniCMarchettiASurvivin gene expression in early- stage non-small cell lung cancerJ Pathol2003200562062612898598
- BagniGOsellaDSturchioEMasciniMDeoxyribonucleic acid (DNA) biosensors for environmental risk assessment and drug studiesAnal Chim Acta2006573–5748189
- TsaiJJBauIJChenHTLinYTWangGJA novel nanostructured biosensor for the detection of the dust mite antigen Der p2Int J Nanomedicine201161201120821822382
- ZhouWMaYYangHDingYLuoXA label-free biosensor based on silver nanoparticles array for clinical detection of serum p53 in head and neck squamous cell carcinomaInt J Nanomedicine2011638138621468351
- LiuQLiuAGaoFCoupling technique of random amplified polymorphic DNA and nanoelectrochemical sensor for mapping pancreatic cancer genetic fingerprintInt J Nanomedicine201162933293922162652
- HahmJLieberCMDirect ultrasensitive electrical detection of DNA and DNA sequence variations using nanowire nanosensorsNano Lett2004415154
- WangJLiuGMerkociAElectrochemical coding technology for simultaneous detection of multiple DNA targetsJ Am Chem Soc2003125113214321512630867
- ChangHYuanYShiNGuanYElectrochemical DNA biosensor based on conducting polyaniline nanotube arrayAnal Chem200779135111511517530821
- ZhangJSongSPZhangLYSequence-specific detection of femtomolar DNA via a chronocoulometric DNA sensor (CDS): effects of nanoparticle-mediated amplification and nanoscale control of DNA assembly at electrodesJ Am Chem Soc2006128268575858016802824
- QiuHXueLJiGEnzyme-modified nanoporous gold-based electrochemical biosensorsBiosens Bioelectron200924103014301819345571
- WeiQZhaoYXuCNanoporous gold film based immunosensor for label-free detection of cancer biomarkerBiosens Bioelectron20112683714371821392961
- ShinHCDongJLiuMNanoporous structures prepared by an electrochemical deposition processAdv Mater2003151916101614
- LiFHanXLiuSDevelopment of an electrochemical DNA biosensor with a high sensitivity of fM by dendritic gold nanostructure modified electrodeBiosens Bioelectron20112652619262521146393
- DengYHuangWChenXLiZFacile fabrication of nanoporous gold film electrodesElectrochem Commun2008105810813
- ZhaoWXuJJShiCGChenHYFabrication, characterization and application of gold nano-structured filmElectrochem Commun200685773778
- ZielasekVJürgensBSchulzCGold catalysts: nanoporous gold foamsAngew Chem Int Ed Engl200645488241824417099919
- MortariAMaaroofAMartinDCortieMBMesoporous gold electrodes for sensors based on electrochemical double layer capacitanceSens Actuators B Chem20071231262268
- LangXYGuoHChenLYNovel nanoporous Au-Pd alloy with high catalytic activity and excellent electrochemical stabilityJ Phys Chem C2010114626002603
- YuCJiaFAiZZhangLDirect oxidation of methanol on self-supported nanoporous gold film electrodes with high catalytic activity and stabilityChem Mater2007192560656067
- HuangJFSunIWFabrication and surface functionalization of nanoporous gold by electrochemical alloying/dealloying of Au–Zn in an ionic liquid, and the self-assembly of L-cysteine monolayersAdv Funct Mater2005156989994
- JiaFYuCAiZZhangLFabrication of nanoporous gold film electrodes with ultrahigh surface area and electrochemical activityChem Mater2007191536483653
- BartlettPNBaumbergJJBirkinPRGhanemMANettiMCHighly ordered macroporous gold and platinum films formed by electrochemical deposition through templates assembled from sub-micron diameter monodisperse polystyrene spheresChem Mater200214521992208
- GaoWXiaXHXuJJChenHYThree-dimensionally ordered macroporous gold structure as an efficient matrix for solid-state electrochemiluminescence of Ru(bpy)3 2+/TPA system with high sensitivityJ Phys Chem C2007111131221312219
- LiYSongYYYangCXiaXHHydrogen bubble dynamic template synthesis of porous gold for nonenzymatic electrochemical detection of glucoseElectrochem Commun200795981988
- BilmesSARubimJCOttoAJSERS from pyridine adsorbed on electro-dispersed platinum electrodesChem Phys Lett198915918996
- GameroMParienteFLorenzoEAlonsoCNanostructured rough gold electrodes for the development of lactate oxidase-based biosensorsBiosens Bioelectron20102592038204420171079
- ZhongGLiuAChenXElectrochemical biosensor based on nanoporous gold electrode for detection of PML/RARα fusion geneBiosens Bioelectron201126938123817
- SteelABHerneTMTarlovMJElectrochemical quantitation of DNA immobilized on goldAnal Chem19987022467046779844566
- FanCPlaxcoKWHeegerAJElectrochemical interrogation of conformational changes as a reagentless method for the sequence-specific detection of DNAProc Nat Acad Sci U S A20031001691349137
- ArinagaKRantUTornowMFujitaSAbstreiterGYokoyamaNThe role of surface charging during the coadsorption of mercaptohexanol to DNA layers on gold: direct observation of desorption and layer reorientationLangmuir200622135560556216768474
- LinXHWuPChenWZhangYFXiaXHElectrochemical DNA biosensor for the detection of short DNA species of chronic myelogenous leukemia by using methylene blueTalanta200772246847119071642
- HuKLanDLiXZhangSElectrochemical DNA biosensor based on nanoporous gold electrode and multifunctional encoded DNA-Au bio bar codesAnal Chem200880239124913019551936
- HoPSFrederickCASaalDWangAHRichAThe interactions of ruthenium hexaamine with Z-DNA: crystal structure of a Ru(NH3)6 3+ salt of d(CGCGCG) at 1.2A resolutionJ Biomol Struct Dyn1987445215343271453
- LaoRSongSWuHElectrochemical interrogation of DNA monolayers on gold surfacesAnal Chem200577196475648016194115
- KatzEWeizmannYWillnerIMagnetoswitchable reactions of DNA monolayers on electrodes: gating the processes by hydrophobic magnetic nanoparticlesJ Am Chem Soc2005127259191920015969597