Abstract
The objective of this study was to investigate the use of cationized Pleurotus eryngii polysaccharide (CPEPS) as a nonviral gene delivery vehicle to transfer plasmid DNA encoding transforming growth factor beta-1 (pTGF-β1) into mesenchymal stem cells (MSCs) in vitro. Crude P. eryngii polysaccharide was purified, and then cationized by grafting spermine onto the backbone of the polysaccharide. Agarose gel electrophoresis, transmission electron microscopy, and a Nano Sense Zetasizer (Malvern Instruments, Malvern, UK) were used to characterize the CPEPS-pTGF-β1 nanoparticles. The findings of cytotoxicity analysis showed that when the nanoparticles were formulated with a CPEPS/pTGF-β1 weight ratio ≥ 10:1, a greater gel retardation effect was observed during agarose gel electrophoresis. The CPEPS-pTGF-β1 nanoparticles with a weight ratio of 20:1, respectively, possessed an average particle size of 80.8 nm in diameter and a zeta potential of +17.4 ± 0.1 mV. Significantly, these CPEPS-pTGF-β1 nanoparticles showed lower cytotoxicity and higher transfection efficiency than both polyethylenimine (25 kDa) (P = 0.006, Student’s t-test) and LipofectamineTM 2000 (P = 0.002, Student’s t-test). Additionally, the messenger RNA expression level of TGF-β1 in MSCs transfected with CPEPS-pTGF-β1 nanoparticles was significantly higher than that of free plasmid DNA-transfected MSCs and slightly elevated compared with that of Lipofectamine 2000-transfected MSCs. Flow cytometry analysis demonstrated that 92.38% of MSCs were arrested in the G1 phase after being transfected with CPEPS-pTGF-β1 nanoparticles, indicating a tendency toward differentiation. In summary, the findings of this study suggest that the CPEPS-pTGF-β1 nanoparticles prepared in this work exhibited excellent transfection efficiency and low toxicity. Therefore, they could be developed into a promising nonviral vector for gene delivery in vitro.
Introduction
Gene therapy has been well defined as a strategy for transferring nucleic acids, such as therapeutic DNA, antisense oligonucleotides, and small interfering RNA, to the target tissues or cells to correct or supplement the defective genes that are responsible for disease development.Citation1–Citation4 The ideal gene delivery system must be able to protect the nucleic acid from many types of degrading systems such as DNA-degrading enzymes and lysosomes,Citation5 in order to penetrate the cell membrane and gain entry into the target cells, and to promote efficient gene expression. The system must also possess specific properties including biocompatibility, biodegradability, nontoxicity, nonimmunogenicity, and stability, during storage and treatment.Citation1,Citation6 However, the lack of safe and efficient vectors for DNA delivery is currently a major hurdle for the success of gene therapy. Gene delivery systems can be classified into viral and non-viral systems.Citation7 Despite the fact that viral gene carriers are widely employed in clinical treatments due to their high transfection efficiency and long-term gene expression,Citation8,Citation9 there are several limitations that impede their applications, including immunogenic properties and the potential to cause mutational infection and toxic side effects.Citation10 Nonviral gene vectors have emerged as a promising alternative to viral vectors because they offer such advantages as low immunogenicity, increased biological safety, the ability to deliver large genes, excellent flexibility in their building block structures, and the possibility of large-scale production at a reasonable cost.Citation11,Citation12
As the leading nonviral gene vectors, cationic polymers can form complexes with the negatively charged nucleic acids so that large pieces of these nucleic acids can be condensed to nanometer-sized particles. This promotes the interaction of cationic polymers with the negatively charged cell membrane, which protects the incorporated nucleic acids in the complex from many types of degrading systems.Citation13,Citation14 A large number of cationic polymers have been designed as gene carriers, such as cationized gelatin,Citation15 poly(l-lysine) (PLL) polymers,Citation16–Citation18 polyethylenimine (PEI),Citation19–Citation21 and so on. However, these polymers suffer several inherent disadvantages including high toxicity, poor biodegradability, and low transfection efficiency.
In recent years, cationic polysaccharide, a type of natural, water-soluble, nontoxic, biocompatible and biodegradable cationic polymer, has been receiving increasing scientific attention and is considered to be the most attractive candidate for gene transfer.Citation22 Compared with other cationic polymers, cationic polysaccharide presents such advantages as the presence of groups that can be easily modified to improve the physicochemical properties and cellular uptake, which can be facilitated by a sugar-recognition receptor on the cell surface.Citation23 Chitosan, a naturally occurring linear amino polysaccharide, has been reported as a vector for gene delivery.Citation24 Researchers have found that apart from its biocompatibility, biodegradability, and low toxicity, chitosan and its derivatives showed excellent ability to transfer genes into cells.Citation25–Citation27 However, chitosan has demonstrated lower transfection efficiency compared with conventional nonviral gene carriers such as liposomes,Citation28 PEI,Citation29 and LipofectamineTM 2000 (Invitrogen, Carlsbad, CA).Citation30 Other leading cationic polysaccharides that have been investigated as gene vectors include dextran,Citation7,Citation31–Citation33 pullulan,Citation34,Citation35 pectin,Citation36 and schizophyllan.Citation22,Citation37
The cationization of polysaccharide is a promising strategy to develop nonviral gene vectors for use in gene therapy.Citation38,Citation39 Polysaccharides represent a structurally diverse class of macromolecules of widespread occurrence in nature and offer a high capacity for carrying biological information because they have great potential for structural variability.Citation40 In support of the above findings, the aim of this study was to develop a nonviral gene vector by grafting spermine residues onto a polysaccharide extracted from Pleurotus eryngii. P. eryngii is an edible mushroom which is very common in China. Mushrooms are known for their nutritional and medicinal values as well as for the diversity of their bioactive components such as nucleases, Citation41 proteases,Citation42 and polysaccharides.Citation43,Citation44 They also contain polysaccharide–peptide and polysaccharide–protein complexes. Citation45 So far, most of the research regarding P. eryngii has focused on its enzymes.Citation46–Citation48 One of the major components of P. eryngii, the polysaccharide of P. eryngii (PEPS), has been studied because of its positive health effects, which include cholesterol-lowering, antioxidant, and anticancer activities; however, little investigation into its application as a gene vector has been carried out.Citation49 Previous studies have indicated that the polysaccharides isolated from P. eryngii were mostly β-glucans, which exhibited potential prebiotic activities.Citation50 Therefore, to construct a cationic polysaccharide for use as a gene carrier, this study chemically modified PEPS by the reductive amination method. Cationized PEPS (CPEPS) enjoys the merits of both the positive charge of amine compounds and the bioactivity of PEPS. This advantage is favorable for delivering plasmid DNA into cells in vitro.
Nanoparticles are a desirable vehicle for gene delivery because of their nanoscale particle size, good stability, and excellent diffusion properties, which may facilitate cellular uptake.Citation51,Citation52 The plasmid encoding transforming growth factor beta-1 (TGF-β1) was used in the study. TGF-β1 is a widely used cytokine which can participate in and regulate many kinds of biochemical processes, including cell growth and differentiation, the formation of extracellular matrices, cytoadherence, immunoregulation, embryonic development, and wound healing.Citation53,Citation54 It has been reported that TGF-β1 was able to induce mesenchymal stem cells (MSCs) to differentiate into chondrocytes in three-dimensional scaffolds, and this study is exactly aimed at this direction. Therefore, plasmid TGF-β1 (pTGF-β1)was combined with CPEPS, resulting in CPEPS-p TGF-β1 nanoparticles that would have the ability to condense large plasmid DNA into nanoscaled supermolecular assemblies. The driving force for the complexation comes from the attraction between the two oppositely charged ions of each polyelectrolyte. Such properties as particle size distribution, zeta potential, and gel retardation effect were rigorously tested to characterize the CPEPS. Most importantly, the in vitro transfection efficiency of the CPEPS/plasmid DNA nanoparticles was investigated, and cytotoxicity was also tested by the 3-(4,5-dimethylthiazol-2-yl)-2,5-diphenyltetrazolium bromide (MTT) method.Citation55 It is expected that CPEPS could be developed into a promising nonviral gene vector for gene therapy.
Materials and methods
Materials
P. eryngii were kindly provided by the Zhenjiang edible mushroom growth base (Zhenjiang, China). Spermine and branched PEI (molecular weight 25 kDa) were purchased from Sigma-Aldrich (St Louis, MO). Dulbecco’s modified Eagle’s medium (DMEM), penicillin–streptomycin, trypsin, MTT, fetal bovine serum (FBS), and Lipofectamine 2000 were obtained from Invitrogen (Carlsbad, CA). All other chemicals and reagents were of analytical or even higher grade and were used without further purification. All solutions were prepared with double distilled water (DDW). The experimental protocol was approved by the University Ethics Committee for the use of experimental animals and conformed to the Guide for the Care and Use of Laboratory Animals.Citation56
Polysaccharide extraction and purification
The polysaccharide was extracted from the fruiting bodies of P. eryngii by purification, as illustrated in . The milled fruiting bodies of P. eryngii (2000 g) were extracted with 2 L of distilled water at 90°C for 3 hours (repeated three times). The aqueous extracts were concentrated under reduced pressure at 50°C and precipitated with absolute ethanol (with a final ethanol concentration of 75% (v/v)). The precipitate was washed twice with absolute ethyl alcohol, and further dissolved in distilled water. This was dialyzed for 48 hours against distilled water (molecular weight cutoff [MWCO] 8000–14,400, Biosharp).Citation39 The retentate portion was centrifuged to remove insoluble material. The supernatant was lyophilized, and then primrose-yellow crude PEPS was obtained.
Figure 1 The process of polysaccharide of Pleurotus eryngii extraction and purification.
The crude PEPS was purified by anion–exchange chromatography on a column (D 2.6 cm × 40 cm, Shanghai Huxi Analysis Instrument Factory Co, Ltd, China) filled with DEAE-52 cellulose resin (Whatman, UK). Then, the fractions that were collected from the DEAE-52 cellulose resin chromatographic column were loaded onto the SephadexG-100 (Shanghai Richu Bioscience Co, Ltd, China) gel chromatographic column (D 2.6 cm × 40 cm, Shanghai Huxi Analysis Instrument Factory). Fractions were collected and monitored for the presence of carbohydrate with a phenol–sulfuric acid assay.Citation57 A single peak was observed with an ultraviolet (UV) absorption photometry instrument (UV2401PC, Shimadzu, Tokyo, Japan). The target fractions were combined and dialyzed against distilled water (MWCO 3500, Biosharp).Citation39 After lyophilization, purified PEPS was obtained.
Preparation of CPEPS
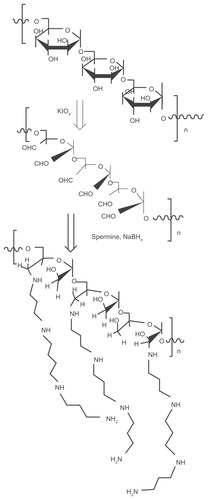
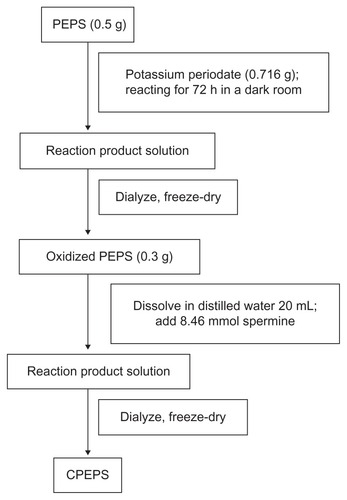
The CPEPS was prepared by the reductive amination method () according to a previous study,Citation32 with slight modifications. The process is shown in . The PEPS (0.5 g, 3.125 mmol of glucose units) was dissolved in 50 mL of DDW which was followed by the addition of potassium periodate (0.716 g, with an IO4 −/saccharide molar ratio of 1:1). The mixture was quickly placed in a darkroom to allow it to react at room temperature with vigorous magnetic stirring for 72 hours. The resulting polyaldehyde derivative was dialyzed (MWCO 3500, Biosharp)Citation39 for another 48 hours against DDW. After freeze-drying, oxidized PEPS was obtained.
Figure 2 The process of spermine grafting to the polysaccharide (dextran is used as an example).
Notes: The reductive amination method is used to produce the cationized polysaccharide: the polysaccharide is first oxidized by KIO4; after the addition of spermine, NaBH4 is used to reduce the reactants.
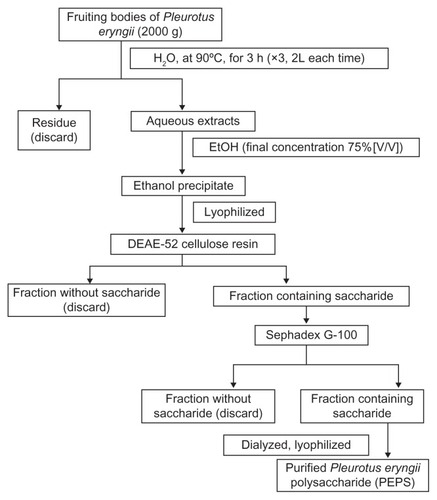
Figure 3 The process of cationized Pleurotus eryngii polysaccharide (CPEPS) preparation.
The aldehyde content was determined according to Jun-ichiro et al.Citation58 Oxidized PEPS (0.3 g) was dissolved in 20 mL of freshly prepared hydroxylamine hydrochloride water solution (0.25 M, pH 4). The resulting mixture was then gently stirred overnight at room temperature, followed by titration with standardized sodium hydroxide solution (0.1 M) till the end point as recorded on a digital pH meter (model PHS-3TC, Shanghai Tainda, Shanghai, China) was reached.
A solution of oxidized PEPS (containing 6.77 mmol of aldehyde groups) in 50 mL of DDW was slowly added (using a Sage Metering pump model 365 [Sage Metering, Monterey, CA]) over 2 hours to a basic solution containing a 1.25 equimolar amount of spermine (8.46 mmol) dissolved in 30 mL of borate buffer (0.1 M, pH 11). The mixture was then gently stirred at room temperature for 24 hours. Then, NaBH4 (0.3 g) was added to the mixture to react for 48 hours and the process was repeated with an additional portion of NaBH4 (0.3 g) for another 24 hours under the same conditions. The resulting light-yellow solution was dialyzed (MWCO 3500, Biosharp) for 48 hours against DDW. After freeze-drying, cationized PEPS (CPEPS) was obtained.
Characterization of PEPS and CPEPS
Based on the literature and the limited experimental conditions in our laboratory, in this study, the average molecular weights of PEPS and CPEPS were analyzed with a Shimadzu gel permeation chromatography (GPC) system-equipped Shimadzu RID-10A refractive index detector (RID) (LC-10 AVP, Shimadzu). Analysis of the monosaccharide composition of PEPS was preliminarily determined by thin layer chromatography. After the spermine modification, the quantity of spermine residues that were grafted onto the PEPS was reflected by the amount of primary amino groups determined by the trinitrobenzene sulfonic acid method. The quantity of total nitrogen per unit weight of polymer was determined with a Euro EA elemental analyzer. A Fourier transform infrared spectrometer (KBr) (Nicolet 170SX, Thermo Fisher Scientific, Waltham, MA) was used to characterize the PEPS and CPEPS and to retrieve their structural information.
Preparation of plasmid DNA
The TGF-β1 was amplified in Escherichia coli host strain DH5α and purified by column chromatography with the PureYield™ Plasmid Maxiprep Start-Up Kit (Promega, Madison, WI) according to the manufacturer’s protocol. Ampicilin was used to select for the pTGF-β1-transformed cells. The DNA concentration was quantified by measuring the UV absorbance at 260 nm with a UV spectrophotometer (DU 530 Life Science UV/Vis spectrophotometer; Beckman Coulter, Fullerton, CA).
Preparation of CPEPS-pTGF-β1 nanoparticles
The CPEPS-pTGF-β1 nanoparticles were prepared by complex coacervation. A number of CPEPS-pTGF-β1 nanoparticle samples that differed in their CPEPS/pTGF-β1 weight ratios were prepared. The CPEPS stock solution (8 mg/mL) was made by dissolving 8 mg CPEPS in 1 mL distilled water, which was then sterilized by heating at 80°C for 4 hours. The required solutions for the different CPEPS concentrations and that of the pTGF-β1 concentration (400 βg/mL) were prepared with sterilized DDW. Meanwhile, aliquots (100 βL) of each of the CPEPS and pTGF-β1 working solutions were heated separately at 55°C for 30–45 minutes. Equal volumes of each solution were then quickly mixed and vortexed for 60 seconds to obtain the CPEPS-pTGF-β1 nanoparticles.
Analysis of gel retardation effect of CPEPS-pTGF-β1 nanoparticles
The CPEPS-pTGF-β1 retention effect was analyzed using gel electrophoresis. CPEPS-pTGF-β1 nanoparticle solutions (10 βL) with different weight ratios were mixed with 1 βL loading buffer (0.1% sodium dodecyl sulfate, 5% glycerol, and 0.005% bromophenol blue) and put into 1% agarose gel in tris-borate-ethylenediaminetetraacetic acid buffer solution (pH 8.0) containing 1 βg/mL ethidium bromide. The diluted free pTGF-β1 solution (10 βL) was used as a control. Electrophoretic evaluation of the complex was carried out in tris-borate-ethylenediaminetetraacetic acid buffer solution at 80 V for 90 minutes. A photograph of the gel was taken with a UV transilluminator (Gel Doc 2000, Bio-Rad, Hercules, CA).
Zeta potential
The zeta potentials of the nanoparticle suspensions, which had different weight ratios of CPEPS to pTGF-β1 (10:1, 20:1, and 30:1), were measured with a ZEN3600 Nano Series Zetasizer (Malvern Instruments, Malvern, UK). The zeta potentials of the free plasmid and original CPEPS were determined under the same conditions. This measurement would reflect the degree of cationization.
Determination of the nanoparticle size distribution
The nanoparticle size distribution was determined by a dynamic light scattering (DLS) technique, performed at 25°C with a Brookhaven BI-90plus instrument (Brookhaven Instruments Corporation, Holtsville, NY). The measured scattering intensities were then analyzed by the software provided by Brookhaven. The determination limits of the size distribution generally ranged from 1 nm to 6 βm, with high sensitivity and reproducibility.
Transmission electron microscopy (TEM)
TEM (JEM-2100; JEOL, Tokyo, Japan) was used to detect the size and shape of the nanoparticles. Samples were prepared by placing 1 βL nanoparticle suspension onto a copper screen and allowing them to air-dry. Then, the air-dried samples were observed directly under TEM without the need to coat the samples with a conducting layer as is required for conventional scanning electron microscopy.
Isolation and culture of MSCs
The method of isolation and culture of MSCs was as described by Alhadlaq and Mao.Citation59 The MSCs were isolated from 1-month-old rats by flushing the femurs and tibias with phosphate-buffered solution (PBS, pH 7.4). This was followed by the collection of 5 mL bone marrow suspensions into centrifuge tubes. Lymphocyte cell separation buffer (5 mL) was gently added into each tube along the walls of the tube. After centrifugation, a mist-like layer containing most of the MSCs had formed. The mist-like layer was then carefully collected into new tubes and washed twice with PBS. After centrifugation, the precipitate was suspended in cell culture medium containing DMEM, 10% FBS, low glucose (1%), 100 U/mL penicillin, and 100 βg/mL streptomycin. The resulting suspension was transferred into cell culture flasks. The cells were incubated at 37°C in a humidified atmosphere of 5% CO2.
Cytotoxicity assay
The in vitro cytotoxicity of the different CPEPS-pTGF-β1 nanoparticles (weight ratios 10:1; 20:1; 30:1) was examined by MTT dye reduction assay. The second-passage MSCs were seeded in a 96-well plate at a cell density of 2.5 × 10⁴ cells/well and incubated at 37°C for 24 hours in 100 βL of DMEM containing 10% FBS. After that, the medium was removed and replaced with a 100 βL suspension of CPEPS-pTGF-β1 nanoparticles (pTGF-β1 200 ng/well) which had been diluted in a serum-free medium. Lipofectamine 2000/pTGF-β1 and branched PEI (25 kDa)/pTGF-β1 were employed as control groups according to each manufacturer’s protocol, under the same conditions. This was to ensure that the optimal ratios for transfection were used. The concentration of pTGF-β1 in each group was 2 ng/βL. The same concentration of pTGF-β1 was used in the subsequent experiments.
Cell viability was tested after the addition of the CPEPS-pTGF- β1 complexes for 48 hours at 37°C in 5% CO2. After that, 10 βL of MTT solution (5 mg/mL) was added to each well for an additional 4-hour incubation under the same conditions. The MTT-containing medium was then removed, and 100 βL dimethyl sulfoxide was added. Dimethyl sulfoxide was used to dissolve the formazan crystals that were formed by the living cells. The absorbance was measured at 570 nm using a microplate reader (SpectraMax 190; Molecular Devices, Sunnyvale, CA). The measured absorbance was normalized with the absorbance of nontreated control cells.
In vitro transfection experiments
In the transfection experiment, second-passage MSCs were seeded in 96-well plates at a density of 2.5 × 10⁴ cells/well in 100 βL complete culture medium (DMEM, containing 10% FBS) and incubated for a period of 24 to 48 hours to obtain a confluence of 80% before transfection. The medium was then removed and replaced with a 100 βL suspension of CPEPS-pTGF-β1 nanoparticles (pTGF-β1 200 ng/well) in a serum-free medium, which contained DMEM, 100 U/mL, and 100 βg/mL streptomycin glutamate. In the positive control groups, Lipofectamine 2000/pTGF-β1 and branched PEI (25 kDa)/pTGF-β1 were handled rigorously according to the protocols provided by the manufacturers and naked pTGF-β1 (200 ng/well) in serum-free medium was used for the negative control group. Four hours later, the medium was replaced with 100 βL fresh complete medium and the cells were incubated for 72 hours. A rat TGF-β1 enzyme-linked immunosorbent assay kit (Yantai Addcare Biotech, Shandong, China) was used to detect cell transfection efficiency, according to the protocol.
RNA isolation and reverse transcriptase polymerase chain reaction
Similar to the enzyme-linked immunosorbent assay test, second-passage MSCs were seeded in six-well plastic culture plates at a density of 2 × 10⁶ cells/well in 2 mL complete culture medium (DMEM, containing 10% FBS) and incubated for 24–48 hours to obtain a confluence of 80%. This was followed by transfection as described above. After 24 hours of transfection, total RNA was extracted using TRIzol® Reagent (Invitrogen), thus following the instructions provided by the manufacturer. RNA concentration and purity were measured by a spectrophotometer (NanoDrop Technologies, Wilmington, DE).
Reverse transcriptase polymerase chain reaction analysis was carried out to determine the messenger RNA (mRNA) expression level of TGF-β1. The reverse transcriptase reaction was conducted with 1.0 ug total RNA using a RevertAid™ cDNA First Strand Synthesis Kit (K1622; Thermo Fisher Scientific, Shenzhen, China). The following polymerase chain reaction (PCR) amplification reaction utilized the Taq polymerase and specific primers. The specific sequences of the primers for PCR were 5′-TGGTGGACCGCAACAACGCA-3′ (forward primer) and 5′-TGCACGGGACAGCAATGGGG-3′ (reverse primer) (GenBank Accession No NM 021578.2). In this study, glyceraldehyde 3-phosphate dehydrogenase was used as an internal standard. The PCR was run in an iCycler (Bio-Rad) using a Brilliant II SYBR® Green QPCR Master Mix (Stratagene, La Jolla, CA). The PCR conditions were as follows: 95°C for 10 minutes (for initial denaturation), followed by 26 cycles of denaturation at 95°C for 30 seconds, annealing for 30 seconds at 57°C for TGF-β1 and at 58°C for glyceraldehyde 3-phosphate dehydrogenase, extension at 72°C for 30 seconds. The PCR products were visualized on a 2% (w/v) agarose gel containing 1 βg/mL ethidium bromide with a UV transilluminator (Gel Doc 2000, Bio-Rad).
Flow cytometry analysis
Cell cycling signals were analyzed using a GalliosTM Flow Cytometer (Beckman Coulter, Miami, FL). In this study, classic procedures were followed to evaluate propidium iodide (Beyotime Institute of Biotechnology, Shanghai, China), staining of DNA content. After 72 hours of transfection, cells were washed twice with PBS (pH 7.4) and detached from the wells with trypsin. The suspended cells were placed in sterilized centrifuge tubes and centrifuged at 1500 rpm for 5 minutes using an Eppendorf centrifuge (Eppendorf GA, Hamburg, Germany), removing the supernatant. The cell pellet was then washed with PBS and resuspended with 0.5 mL of PBS (pH 7.4). The cell suspension was added into 5 mL of 75% ethanol with precooling at −20°C (very slowly, drop by drop) and then fixed at 4°C overnight, followed by centrifuge at 1000 rpm for 5 minutes at 4°C to remove the ethanol. The cell pellet was washed twice with PBS + 1% bovine serum albumin and resuspended in 400 βL PBS + 1% bovine serum albumin. After that, 50 βL of 500 βg/mL propidium iodide was added into the cell suspension, followed by incubation at 37°C for 30 minutes before analysis by flow cytometer.
The cells were divided into four groups: group 1, treated with free pTGF-β1; group 2, treated with Lipofectamine 2000/pTGF-β1; group 3, treated with CPEPS-pTGF-β1 nanoparticles, and group 4, treated with medium containing pTGF-β1 protein.
Statistical analysis
The data were analyzed with both one-factor and two-factor analyses of variance. Student’s t-test and the Fisher’s protected least significance difference post hoc test were used to determine the significance (significance accepted at P < 0.01) of the difference between selected groups with SPSS statistics software (v15.0; SPSS Inc, Chicago, IL). The data were presented as the mean ± standard error of the mean.
Results
Characteristics of the CPEPS
The GPC findings showed that the average molecular weights of the PEPS and CPEPS were 549 kDa and 333 kDa, respectively. The amount of primary and secondary amino groups derived from spermine and the percentage of cross-linked spermine were as shown in . The findings showed that CPEPS was not cross-linked.
Table 1 Amino group content and cross-linking of CPEPS
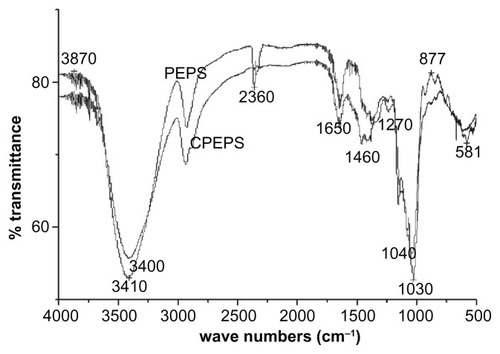
Qualitative functional group analysis of the CPEPS by Fourier transform infrared spectroscopy (KBr) yielded peaks at 3410, 1650, 1460, 1270, and 1030 cm−1 (see ). Comparatively, the spectrum of the CPEPS revealed an obvious change at 3410 cm−1 (the presence of amine and −OH groups), and peaks at 1650 cm−1 (indicating the existence of −NH2),Citation32 1270 cm−1 (indicating the C–O group in an ester bond),Citation39 and 1030 cm−1 (−OH stretching) as against the spectrum of PEPS. This demonstrated that the amino groups were successfully grafted onto the backbone of the polysaccharide.
Figure 4 Fourier transform infrared spectra of polysaccharide of Pleurotus eryngii (PEPS) and cationized P. eryngii polysaccharide (CPEPS).
Thin layer chromatography revealed that the monosaccharides in the PEPS mainly consisted of glucose, galactose, and mannose.
Gel retardation effect of the CPEPS-pTGF-β1 nanoparticles
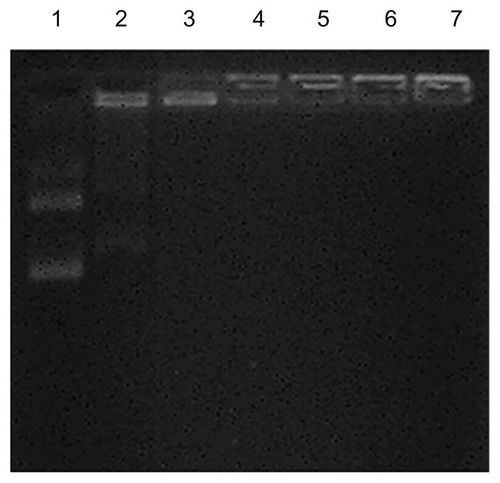
shows the electrophoretic pattern of the tested CPEPS-pTGF- β1 nanoparticles with different CPEPS/pTGF-β1 weight ratios. The nanoparticles with the lowest CPEPS/pTGF-β1 weight ratio (1:5; well 2 of ) showed that a portion of the TGF-β1 plasmids had detached itself from the nanoparticles and migrated into the gel, as demonstrated by a faint band corresponding to the location of the naked TGF-β1 plasmid (well 1 of ). When the CPEPS/pTGF-β1 weight ratio was increased to 10:1 (well 3 of ), there was no sign of plasmid migration across the agarose gel. This indicated that the complexation of pTGF-β1 and CPEPS was strong enough to completely retard DNA migration. Accordingly, the CPEPS-pTGF- β1 complexes with weight ratios of 10:1, 20:1, and 30:1 were used in the subsequent transfection study.
Figure 5 Agarose gel electrophoresis of the CPEPS-pTGF-β1 nanoparticles.
Notes: Well 1, free pTGF-β1; wells 2–7, CPEPS-pTGF-β1 nanoparticles with various weight ratios of CPEPS/pTGF-β1 (from left to right: 5:1, 10:1, 20:1, 30:1, 60:1, and 80:1).
Abbreviations: CPEPS, cationized Pleurotus eryngii polysaccharide; pTGF-β1, plasmid encoding transforming growth factor beta-1.
Zeta potential
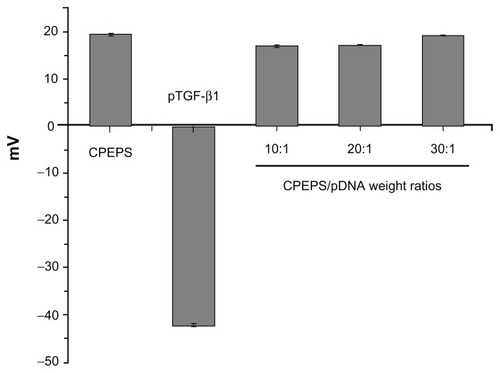
The zeta potential of the original CPEPS was +19.4 ± 0.2 mV (mean ± standard error for 15 runs of the same sample; see ). In contrast, the zeta potential of the naked pTGF-β1 was −42.1 ± 0.3 mV (). At the three different ratios of CPEPS/pTGF-β1 (10:1, 20:1 and 30:1), the zeta potential changed from a negative value to a positive value and increased to +17.0 ± 0.2 mV, +17.4 ± 0.1 mV, and +19.2 ± 0.2 mV, respectively.
Figure 6 The zeta potentials of free pTGF-β1, CPEPS, and CPEPS combined with different amounts of pTGF-β1 to yield the following CPEPS/pTGF-β1 weight ratios: 10:1, 20:1, and 30:1.
Note: The values are the means ± standard error of the mean of three experiments.
Abbreviations: TGF-β1, transforming growth factor beta-1; pTGF-β1, plasmid encoding TGF-β1; CPEPS, cationized P. eryngii polysaccharide.
Particle size distribution and morphology
DLS demonstrated the various sizes of the nanoparticles with CPEPS/pTGF-β1 weight ratios of 10:1, 20:1, and 30:1. The size distribution of the nanoparticles with a CPEPS/pTGF-β1 weight ratio of 20:1 ranged from 29.2 nm to 168.5 nm, with an average diameter of 80.8 nm (), whereas the average sizes of the other two nanoparticle groups were 248.3 nm (10:1) and 151.1 nm (30:1), respectively ().
Table 2 The size distribution of nanoparticles with CPEPS/pTGF- β1 weight ratios of 10:1, 20:1, and 30:1
Figure 7 Particle size distribution and morphology. (A) The particle size distribution of the CPEPS/pTGF-β1 nanoparticles with a weight ratio of 20:1; (B) transmission electron microscopy image of the CPEPS/pTGF-β1 nanoparticles with a weight ratio of 20:1.
Abbreviations: CPEPS, cationized Pleurotus eryngii polysaccharide; pTGF-β1, plasmid encoding transforming growth factor beta-1.
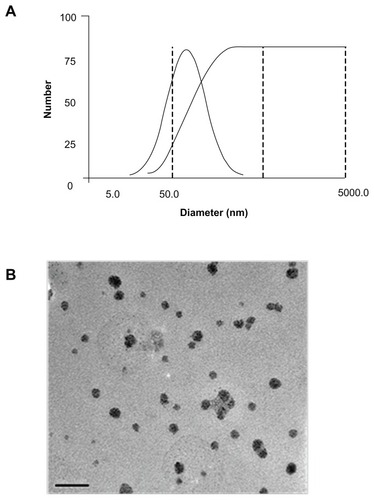
The TEM measurement showed that the monodispersed nanoparticles (CPEPS/pTGF-β1 weight ratio of 20:1) had a spherical shape and a size distribution within a relatively narrow range (30–50 nm) ().
Cytotoxicity of the CPEPS-pTGF-β1 nanoparticles
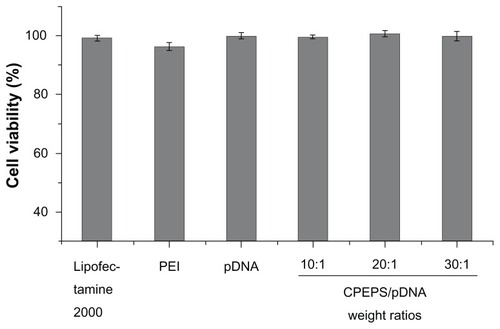
As shown in , the result demonstrated that the CPEPS-pTGF-β1 nanoparticles yielded comparative or even higher cell viability than that of Lipofectamine 2000 and branched PEI (25 kDa), indicating that the CPEPS-pTGF-β1 nanoparticles were safe for MSCs.
Figure 8 Cytotoxicity assay. From left to right: Lipofectamine™ 2000; polyethylenimine (25 kDa); free plasmid; CPEPS-pTGF-β1 nanoparticles with CPEPS/pTGF-β1 weight ratios of 10:1, 20:1, and 30:1.
Note: The values are the means ± standard error of the mean of three experiments.
Abbreviations: CPEPS, cationized Pleurotus eryngii polysaccharide; PEI, polyethylenimine; pTGF-β1, plasmid encoding transforming growth factor beta-1.
In vitro gene transfection
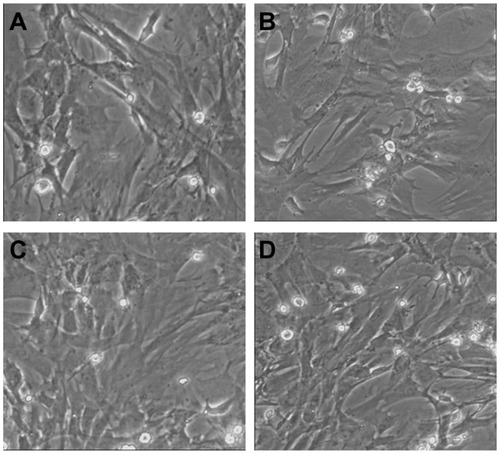
The TEM images of MSCs before and after transfection are shown in .
Figure 9 Transmission electron microscopy (TEM) images of MSCs before and after transfection. (A) TEM image of mesenchymal stem cells before transfection; (B–D) TEM images of mesenchymal stem cells after transfection by CPEPS-pTGF- β1 nanoparticles with CPEPS/pTGF-β1 weight ratios of 10:1, 20:1, and 30:1, respectively.
Abbreviations: CPEPS, cationized Pleurotus eryngii polysaccharide; pTGF-β1, plasmid encoding transforming growth factor beta-1.
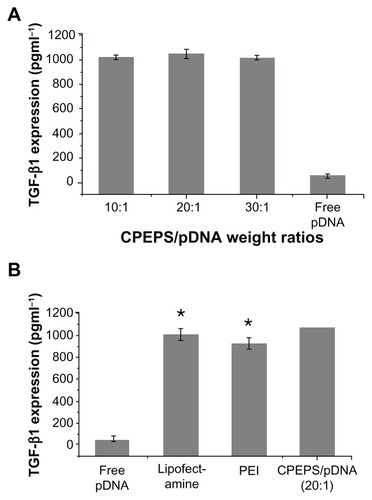
Among the three groups of different CPEPS/pTGF-β1 weight ratios (10:1, 20:1, and 30:1), the optimal TGF-β1 expression was recorded for a CPEPS/pTGF-β1 weight ratio of 20:1 (). Statistically, the CPEPS-pTGF- β1 nanoparticles with a CPEPS/pTGF-β1 weight ratio of 20:1 revealed a significantly higher transfection effect than that of PEI (25 kDa) (P = 0.002, Student’s t-test) and Lipofectamine 2000 (P = 0.006, Student’s t-test), the current gold standard of commercial transfection reagents ().
Figure 10 TGF-β1 protein released into the medium from mesenchymal stem cells 72 hours after treatment with CPEPS-pTGF-β1 nanoparticles. (A) TGF-β1 protein concentrations in the medium with various weight ratios of CPEPS to pTGF-β1: 10:1 (first bar), 20:1 (second bar), and 30:1 (third bar), as well as in free plasmid DNA (fourth bar). (B) A comparison of TGF-β1 expression levels: free plasmid DNA (first bar); Lipofectamine™ 2000 (second bar); polyethylenimine (25 kDa, third bar); and CPEPS-pTGF-β1 nanoparticles with a CPEPS/pTGF-β1 weight ratio of 20:1 (fourth bar).
Note: The values are the means ± standard error of the mean of three experiments.
Abbreviations: TGF-β1, transforming growth factor beta-1; pTGF-β1, plasmid encoding TGF-β1; CPEPS, cationized Pleurotus eryngii polysaccharide; PEI, polyethylenimine.
mRNA expression level of TGF-β1
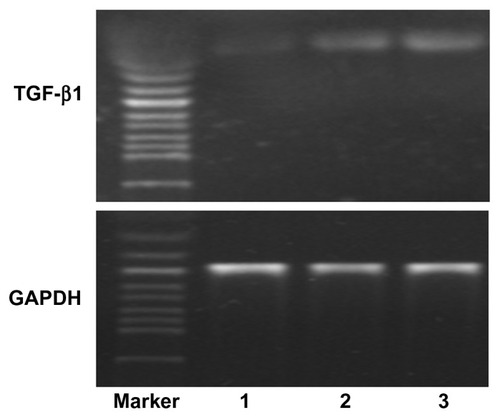
As shown in , the mRNA expression level of TGF-β1 in CPEPS-pTGF-β1 nanoparticle-transfected MSCs (well 1 in ) was notably higher than that of MSCs transfected with free pTGF-β1 (well 2 in ) and also slightly higher than that of MSCs transfected with Lipofectamine 2000 (well 3 in ).
Figure 11 Messenger RNA expression of TGF-β1 in mesenchymal stem cells (MSCs).
Notes: Well 1, MSCs transfected with free pTGF-β1; well 2, MSCs transfected with Lipofectamine™ 2000/pTGF-β1; well 3, MSCs transfected with CPEPS-pTGF- β1 nanoparticles.
Abbreviations: TGF-β1, transforming growth factor beta-1; CPEPS, cationized Pleurotus eryngii polysaccharide; pTGF-β1, plasmid encoding TGF-β1; GAPDH, glyceraldehyde 3-phosphate dehydrogenase.
Flow cytometry analysis
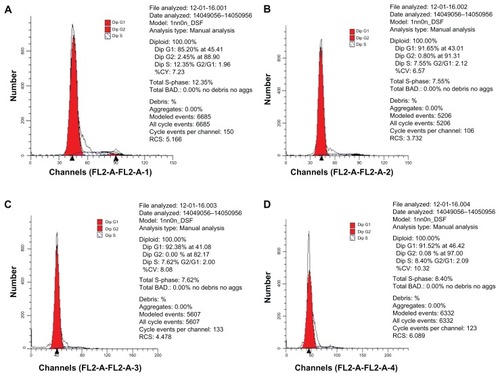
As shown in , the results of the flow cytometry of propidium iodide-stained cells demonstrated that the percentage of cells in the G1 phase for group 1 (85.20%, ) was the lowest with the highest percentage being that of group 3 (92.38%, ). However, the percentage of cells in the S phase for group 1 (12.35%) was higher than that of the other three groups (group 2 []: 7.55%; group 3: 7.62%, and group 4: 8.4% []). Interestingly, there were no cells in the G2 phase for group 3.
Figure 12 Flow cytometry of propidium iodide-stained mesenchymal stem cells (MSCs). (A) MSCs treated with plasmid TGF-β1; (B) MSCs treated with Lipofectamine™ 2000/pTGF-β1; (C) MSCs treated with CPEPS-pTGF-β1 nanoparticles; (D) MSCs treated with medium containing pTGF-β1 protein.
Abbreviations: TGF-β1, transforming growth factor beta-1; pTGF-β1, plasmid encoding TGF-β1; CPEPS, cationized Pleurotus eryngii polysaccharide.
Discussion
In this study, PEPS was used as a gene delivery material for the first time. PEPS was a promising candidate for gene delivery after proper modification due to its advantages, including biocompatibility, biodegradability, nontoxicity, and ease of chemical modification.
Generally, the molecular weights of polymers are determined by GPC, which is also known as size-exclusion chromatography, equipped with either an RIDCitation32,Citation60 or a light-scattering detector.Citation20,Citation24 Despite the increasingly widespread application of DLS, GPC equipped with RID has equally also been used to measure the molecular weights of polymers in many recent studies.Citation32,Citation60 Based on other studies and the limited experimental conditions in the laboratory, a RID (Shimadzu GPC system-equipped Shimadzu RID-10 A) was used to determine the molecular weights of PEPS and CPEPS. The findings revealed a drastic decease in the molecular weight of CPEPS (549 kDa) as compared to that of PEPS (333 kDa). This could possibly be due to the extensive aminolysis of PEPS during the conjugation reaction.Citation38,Citation58
In previous studies,Citation38,Citation58 nuclear magnetic resonance (NMR) was employed to further characterize the structure of the polysaccharide. In this work, 1H NMR spectra were recorded on a 400 MHz Bruker AV-400 NMR spectrometer (Bruker, Madison, WI) to characterize the structure of PEPS and CPEPS. Unfortunately, no valuable information could be obtained (data not shown). In some published reportsCitation58,Citation61,Citation62 the samples had molecular weights less than 100 kDa as against the results of this study (>100 kDa). It is possible that the molecular weights of the samples were beyond the sensitivity of the NMR spectrometer. The exact reason is still unknown, and it will be explored in our future study. According to some researchers,Citation39,Citation60 it was acceptable to combine the use of trinitrobenzene sulfonic acid, total nitrogen determination, and Fourier transform infrared spectroscopy to characterize the CPEPS.
Spermine, an amino compound with two primary amino groups and two secondary amino groups on each molecule, was chemically grafted onto PEPS to obtain CPEPS.Citation58 The quantity of the total amount of nitrogen per microgram of CPEPS indicated the amount of spermine grafted on the backbone of PEPS. As spermine was conjugated to the polysaccharide via one of its primary amino groups, the conjugated primary amino group became a secondary amine after conjugation.Citation38 Cross-linking was possible via the remaining primary amine of spermine. In this study, no cross-linking was observed (), indicating good control of the reaction conditions. Significantly, a low degree of cross-linking was desirable in this application.
The study investigated the monosaccharide content of the PEPS via preliminary thin layer chromatography analysis and found that D-glucose was the major monosaccharide component; the other components were galactose and mannose. The results were in agreement with previous studies.Citation50 It was speculated that because D-glucose was the major monosaccharide in PEPS, the monomer was more likely to be grafted with spermine. It was also likely that the spermine might be linked to the other monosaccharide components. In a related study, various polysaccharides (pullulan, dextran, and mannan) with different cationization degrees were used to transfect MSCs in order to examine the factors affecting transfection.Citation63 The findings showed that the gene expression level was closely related to the type of cationized polysaccharide. The exact composition of PEPS monosaccharides, which are the major contributors of cationization, will be addressed in future works.
Gel electrophoresis showed that the cationized polysaccharide could successfully incorporate TGF-β1 plasmid. The complexation of CPEPS and TGF-β1 plasmid was CPEPS-content dependent, with a greater CPEPS/pTGF-β1 weight ratio resulting in better plasmid incorporation.
It is well known that DNA charge reversal is one of the basic requirements for the transfection of cells. Interestingly, the zeta potentials of the three different CPEPS-pTGF- β1 nanoparticles were almost the same as that of the original polysaccharide (+19.4 ± 0.2 mV) and statistically insignificant (see .) This implies that the negatively charged plasmids were successfully combined with the positively charged polysaccharide to form nanoparticles of more positive charges on its outer surface. Therefore, the value of the positive charges on the surface of the nanoparticles will be comparable to that of the original CPEPS. This point will be further investigated in future studies.
The particle size values provided by TEM (30–50 nm, ) and DLS (29.2~168.5 nm) were quite different ( and ). A possible reason could be that the DLS and TEM had various determination conditions: samples measured by DLS were in suspended form, whereas dried particles were observed under TEM. In summary, the CPEPS-pTGF-β1 complex had a nanoscaled particle size. Interestingly, these findings showed that the average particle size of the formulated nanoparticles (CPEPS/pTGF-β1 weight ratio of 20:1) was 80.8 nm in diameter, which was much smaller than the sizes reported in previous studies (cationized gelatinCitation15 and chitosanCitation25 nanoparticles with an average size of approximately 172 nm in diameter and 250 nm in diameter were produced, respectively). However, the average size of the nanoparticles with a CPEPS/pTGF-β1 weight ratio of 30:1 was 151.1 nm which is obviously larger than that of the 20:1 nanoparticles. This large particle size suggested that excess cationic polysaccharide might acquire a greater positive zeta potential, but it could also cause redundant CPEPS coacervation on the particle surface resulting in a particle size increase. This is unfavorable for cellular uptake.
Low cytotoxicity is one of the basic requirements for a safe and effective gene carrier. The outcome of the MTT test showed that the CPEPS-pTGF-β1 nanoparticles exhibited an exceptional safety profile (). It is likely that the intracellular degradability of the polymer was responsible for the low cytotoxicity of CPEPS.Citation49 Inside the cells, the CPEPS could be degraded to different kinds of monosaccharides and oligoamines, which were easily metabolized, hence nontoxic.Citation64 Essentially, the CPEPS-pTGF-β1 nanoparticles prepared in this study were safe for MSCs.
Cell transfection efficiency is the key index in evaluating the properties of nonviral gene carriers. The results of the CPEPS-pTGF-β1 nanoparticles with a weight ratio of 20:1 (80.8 nm on average) showed the highest transfection efficiency (). This means that the smaller size of the nanoparticles facilitated the movement of the particles through membranes. In addition, when the CPEPS/pTGF-β1 weight ratio was lower than 20:1, it could possibly lead to an incomplete encapsulation of the negatively charged naked pTGF-β1, resulting in a relatively large particle size (248.3 nm) that probably hindered the process of cellular uptake. This assertion was also supported by the gel retardation assay (). It was observed that there was less tendency for the plasmid to migrate as the CPEPS/pTGF-β1 weight ratio increased. The free plasmid DNA showed the greatest migration towards the positive pole. This implies that the complex with a weight ratio of 10:1 had an inadequate amount of cationic polysaccharide. In the case of the nanoparticles with a CPEPS/pTGF-β1 weight ratio greater than 20:1, the reduced TGF-β1 expression could possibly be due to a larger particle size (151.1 nm), as well as to the strong bond of attraction between the CPEPS and pTGF-β1. This would have prevented the release of pTGF-β1 from the nanoparticles in a timely and complete manner once the nanoparticles entered the cells. Additionally, a high CPEPS/pTGF-β1 weight ratio might lead to the state of free CPEPS that could competitively inhibit the interaction between CPEPS-pTGF-β1 nanoparticles and cell membrane.Citation39 Further investigations would be needed to provide a deeper understanding of the MSC transfection mechanisms with respect to the CPEPS/pTGF-β1 weight ratio.
Interestingly, the CPEPS-pTGF-β1 nanoparticles (weight ratio of 20:1) showed a significantly enhanced transfection effect as compared to those of PEI (25 kDa), (P = 0.002, Student’s t-test) and Lipofectamine 2000 (P = 0.006, Student’s t-test). This was possible because CPEPS could condense the TGF-β1 plasmid to a small size (80.8 nm on average), which facilitated the process of cellular uptake. At the same time, the positive charge on the surface of the nanoparticle (+17.4 ± 0.1 mV) promoted the interaction with the negatively charged cell membranes. It is a well-known fact that polysaccharides can readily be transported to cells by known biological processes, which might greatly contribute to the success of the transfection.Citation38
In the study, long-term (72-hour) expression of TGF-β1 by MSCs was also investigated. In a related study,Citation64 immunofluorescence staining was conducted to check if the stem cells had differentiated after transfection. The findings of that study showed that the transfection was transient. In this study, the results supported that, and after transfection stem cells still maintained mesenchymal lineage properties (data not shown). This could also be supported by the TEM images of MSCs before and after transfection, which exhibited no obvious morphological changes after transfection. Longer- term (more than 72-hour) transfection investigation will be addressed in future works.
Reverse transcriptase polymerase chain reaction was carried out to reflect the transfection effect of CPEPS-pTGF-β1 nanoparticles from the mRNA expression level of TGF-β1, and the result was in agreement with that revealed by enzyme-linked immunosorbent assay, indicating the high transfection effect of CPEPS-pTGF-β1 nanoparticles and their superiority over Lipofectamine 2000.
It is well known that the S phase is the cell cycle phase for DNA synthesis which prepares the cells for mitosis, and the G1 phase is the cell stage after mitosis to the beginning of the S phase. So the cells moving from the S to the G1 phase indicated a tendency of differentiation. Flow cytometry analysis revealed that cells transfected with CPEPS-pTGF-β1 nanoparticles had low proliferation but showed a tendency of differentiation. This could possibly be due to the effect of TGF-β1 on MSCs, because TGF-β1 has the ability to induce chondrogenesis of MSCs.Citation65 Further investigation of this aspect will be addressed in future studies.
Conclusion
In this study, a polysaccharide isolated from the edible mushroom P. eryngii was chemically modified with spermine for the first time to obtain CPEPS, out of which CPEPS-pTGF-β1 nanoparticles were then prepared. Gel retardation assay showed that CPEPS-pTGF-β1 nanoparticles possessed the ability to prevent the plasmid DNA from migrating when the CPEPS/pTGF-β1 weight ratio increased to 10:1. Varying the CPEPS to TGF-β1 plasmid weight ratio affected the TGF-β1 expression significantly, with the highest transfection efficiency noted at the CPEPS/pTGF-β1 weight ratio of 20:1. In addition, the CPEPS-pTGF-β1 nanoparticles (weight ratio of 20:1) showed significantly enhanced transfection efficiency compared with that of Lipofectamine 2000. Cytotoxicity assay revealed that the CPEPS/pTGF-β1 nanoparticles were less toxic than both PEI (25 kDa) and Lipofectamine 2000. Furthermore, the mRNA expression level of TGF-β1 in MSCs transfected by CPEPS-pTGF-β1 nanoparticles was significantly higher than that of free plasmid DNA-transfected MSCs and slightly elevated compared with that of Lipofectamine™ 2000-transfected MSCs. Flow cytometry analysis revealed that 92.38% of MSCs were arrested in the G1 phase after transfection with CPEPS-pTGF-β1 nanoparticles, indicating a tendency of differentiation. All of these findings support the fact that the CPEPS-pTGF-β1 nanoparticles could be developed into a promising gene delivery system in the near future.
Acknowledgments
This work was supported by the National Natural Science Foundation of China (30772661, 30973677, and 81072586), Special Funds for 333 Projects (BRA2010138), and Industry-University-Research Institution Cooperation (BY2009141) in Jiangsu Province.
The authors are grateful to Caleb Kesse Firempong at Jiangsu University for English editing. The authors also thank the University Ethics Committee for their kind guidance with regard to the animal experiments.
Disclosure
There was no financial involvement with any organization or entity with a financial interest in or financial conflict with the subject matter or materials discussed in the paper.
References
- RubanyiGMThe future of human gene therapyMol Aspects Med20012211314211470139
- LiSHuangLNon-viral gene therapy: promises and challengesGene Ther20007313410680013
- LiSMaZNonviral gene therapyCurr Gene Ther2001120122612108955
- VileRGRussellSJLemoineNRCancer gene therapy: hard lessons and new coursesGene Ther200072810680008
- NishikawaMHuangLNon-viral vectors in the new millennium: delivery barriers in gene transferHum Gene Ther20011286187011387052
- HanSMahatoRISungYKKimSWDevelopment of biomaterials for gene therapyMol Ther2000230231711020345
- EliyahuHJosephAAzzamTBarenholzYDombAJDextran–spermine based polyplexes – evaluation of transgene expression and of local and systemic toxicity in miceBiomaterials2006271636164516221492
- PhillipsJEGersbachCAGarciaAJVirus-based gene therapy strategies for bone regenerationBiomaterials20072821122916928397
- DayaSBernsKIGene therapy using adeno-associated virus vectorsClin Microbiol Rev20082158359318854481
- ZaissAKMuruveDAImmune responses to adeno-associated virus vectorsCurr Gene Ther2005532333115975009
- DaniSUThe challenge of vector development in gene therapyBraz J Med Biol Res19993213314510347748
- HuQJZuoPShaoBAdministration of non-viral gene vector encoding rat β-defensin-2 ameliorates chronic Pseudomonas aeruginosa lung infection in ratsJ Gene Med20101227628620131335
- MerdanTKopeekJKisselTProspects for cationic polymers in gene and oligonucleotide therapy against cancerAdv Drug Deliv Rev20025471575812204600
- De SmedtSCDemeesterJHenninkWECationic polymer based gene delivery systemsPharm Res20001711312610751024
- XuXMCapitoRMSpectorMDelivery of plasmid IGF-1 to chondrocytes via cationized gelatin nanoparticlesJ Biomed Mater Res, Part A2008847383
- MannARichaRGanguliMDNA condensation by poly L-lysine at the single molecule level: role of DNA concentration and polymer lengthJ Control Release200812525226218068848
- ZhangXOulad-AbdelghaniMZelkinANPoly(l-lysine) nanostructured particles for gene delivery and hormone stimulationBiomaterials2010311699170619954837
- LvHTZhangSBWangBCuiSHYanJToxicity of cationic lipids and cationic polymers in gene deliveryJ Control Release200611410010916831482
- GodbeyWTWuKKMikosAGPoly(ethylenimine) and its role in gene deliveryJ Control Release19996014916010425321
- HeFWangCFJiangTHanBZhuoRXPoly[(5-methyl-5- allyloxycarbonyl- trimethylene carbonate)-co-(5,5-dimethyl-trimethylene carbonate)] with Grafted Polyethylenimine as Biodegradable Polycations for Efficient Gene DeliveryBiomacromolecules20101130283035
- SunYXZhangXZChengHChengSXZhuoRXA low-toxic and efficient gene vector: carboxymethyl dextran-graft-polyethylenimineJ Biomed Mater Res Part A20088411021110
- NagasakiTHojoMUnoALong-term expression with a cationic polymer derived from a natural polysaccharide: schizophyllanBioconjug Chem20041524925915025520
- JoJIkaiTOkazakiAYamamotoMHiranoYTabataYExpression profile of plasmid DNA by spermine derivatives of pullulan with different extents of spermine introducedJ Control Release200711838939817320235
- MalmoJVårumKMStrandSPEffect of chitosan chain architecture on gene delivery: comparison of self-branched and linear chitosansBiomacromolecules20111272172921294570
- XuXMCapitoRMSpectorMPlasmid size influences chitosan nanoparticle mediated gene transfer to chondrocytesJ Biomed Mater ResPart A20088410381048
- PengSFYangMJSuCJChenHLLeePWEffects of incorporation of poly (γ-glutamic acid) in chitosin/DNA complex nanoparticles on cellular uptake and transfection efficiencyBiomaterials2009301797180819110309
- ThanouMFloreaBIGeldofMJungingerHEBorchardGQuaternized chitosan oligomers as novel gene delivery vectors in epithelial cell linesBiomaterials20022315315911762833
- CorsiKChellatFYahiaLFernandesJCMesenchymal stem cells, MG63 and HEK293 transfection using chitosan-DNA nanoparticlesBiomaterials2003241255126412527266
- JiangHLKimYKAroteRChitosan-graft-polyethylenimine as a gene carrierJ Control Release200711727328017166614
- StrandSPLeluSReitanNKDe Lange DaviesCArturssonPVarumKMMolecular design of chitosan gene delivery systems with an optimized balance between polyplex stability and polyplex unpackingBiomaterials20103197598719857892
- NaganeKJoJTabataYPromoted adipogenesis of rat mesenchymal stem cells by transfection of small interfering RNA complexed with a cationized dextranTissue Eng Part A201016213119604070
- AzzamTEliyahuHShapiraLLinialMBarenholzYDombAJPolysaccharide-oligoamine based conjugates for gene deliveryJ Med Chem2002451817182411960493
- HosseinkhaniHAzzamTTabataYDextran-spermine polycation: an efficient non-viral vector for in vitro and in vivo gene transfectionGene Ther20041119420314712304
- KanataniIIkaiTOkazakiAEfficient gene transfer by pullulan-spermine occurs through both clathrin- and raft/caveolae-dependent mechanismsJ Control Release2006116758217055606
- ThakorDKTengYDTabataYNeuronal gene delivery by negatively charged pullulan-spermine/DNA anioplexesBiomaterials2009301815182619152971
- KatavTLiuLSTraitelTGoldbartRWolfsonMKostJModified pectin-based carrier for gene delivery: cellular barriers in gene delivery courseJ Control Release200813018319118585414
- MizuMKoumotoKAnadaTA polysaccharide carrier for immunostimulatory CpG DNAs to enhance cytokine secretionJ Am Chem Soc20041268372837315237982
- EliyahuHSianiSAzzamTDombAJBarenholzYRelationships between chemical composition, physical properties and transfection efficiency of polysaccharide–spermine conjugatesBiomaterials2006271646165516242185
- DongLXiaSLuoYTargeting delivery oligonucleotide into macrophages by cationic polysaccharide from Bletilla striata successfully inhibited the expression of TNF-alphaJ Control Release200913421422019073226
- CarboneroERGracherAHPSmiderleFRA β-glucan from the fruit bodies of edible mushrooms Pleurotus eryngii and Pleurotus ostreatoroseusCarbohydr Polymer200666252257
- WangHXNgTBIsolation of a new ribonuclease from fresh fruiting bodies of the straw mushroomBiochem Biophys Res Commun199926471471810543997
- WangHXNgTBPleureryn, a novel protease from fresh fruiting bodies of the edible mushroom Pleurotus eryngiiBiochem Biophys Res Commun200128975075511726212
- KimJHKimYSCharacterization of a metalloenzyme from a wild mushroom, Tricholoma saponaceumBiosci Biotechnol Biochem20016535636211302169
- ZhangMCuiSWCheungPCKWangQAntitumor polysaccharides from mushrooms: a review on their isolation process, structural characteristics and antitumor activityTrends Food Sci Tech200718419
- KimGYLeeJYLeeJOPartial characterization and immunostimulatory effect of a novel polysaccharide–protein complex extracted from phellinus linteusBiosci Biotechnol Biochem2006701218122616717425
- MunozCGuillénFMartínezATMartínezMJLaccase isoenzymes of Pleurotus eryngii: characterization, catalytic properties, and participation in activation of molecular oxygen and Mn2+ oxidationAppl Environ Microbiol199763216621749172335
- PogniRBarattoMCTeutloffCGiansantiSRuiz-DuenasFJChoinowskiTTryptophan neutral radical in the oxidized state of versatile peroxidase from Pleurotus eryngii: a combined multifrequency EPR and density functional theory studyJ Biol Chem20062819517952616443605
- Ruiz-DuenasFJMoralesMPérez-BoadaMManganese oxidation site in Pleurotus eryngii versatile peroxidase: a site-directed mutagenesis, kinetic, and crystallographic studyBiochemistry200746667717198376
- KimSWKimHGLeeBEHwangHHBaekDHKoSYEffects of mushroom, Pleurotus eryngii, extracts on bone metabolismClin Nutr20062516625170
- SynytsyaAMickovaKSynytsyaAGlucans from fruit bodies of cultivated mushrooms Pleurotus ostreatus and Pleurotus eryngii: Structure and potential prebiotic activityCarbohydr Polymer200976548556
- LiuZTabakmanSWelsherKDaiHCarbon nanotubes in biology and medicine: in vitro and in vivo detection, imaging and drug deliveryNano Res200928512020174481
- WangLZhaoWTanWBioconjugated silica nanoparticles: development and applicationsNano Res2008199115
- ElisseeffJMcIntoshWFuKBlunkBTLangerRControlled release of IGF-I and TGF-beta1 in a photopolymerizing hydrogel for cartilage tissue engineeringJ Orthop Res2001191098110411781011
- GuoCALiuXGHuoJZJiangCWenXJChenZRNovel gene-modified- tissue engineering of cartilage using stable transforming growth factor-β1-transfected mesenchymal stem cells grown on chitosan scaffoldsJ Biosci Bioeng200710354755617630127
- CiapettiGCenniEPratelliLPizzoferratoAIn vitro evaluation of cell/biomaterial interaction by MTT assayBiomaterials1993143593648507779
- Institute for Laboratory Animal ResearchGuide for the Care and Use of Laboratory AnimalsWashingtonNational Academies Press1996 Available from http://oacu.od.nih.gov/regs/guide/guide.pdfAccessed February 14, 2012
- MasukoTMinamiAIwasakiNMajimaTNishimuraSILeeYCCarbohydrate analysis by a phenol-sulfuric acid method in microplate formatAnal Biochem2005339697215766712
- Jun-ichiroJArimichiOKentaroNMasayaYYasuhikoTPreparation of cationized polysaccharides as gene transfection carrier for bone marrow-derived mesenchymal stem cellsJ Biomater Sci Polymer Ed201021185204
- AlhadlaqAMaoJJMesenchymal stem cells: isolation and therapeuticsStem Cells Dev20041343644815345137
- XuFJZhangZXPingYLiJKangETNeohKGStar-shaped cationic polymers by atom transfer radical polymerization from β-cyclodextrin cores for non-viral gene deliveryBiomacromolecules20091028529319128039
- LiYZhuYXiaKDendritic poly(l-lysine)-b-poly(l-lactide)-b-dendritic poly(l-lysine) amphiphilic gene delivery vectors: roles of PLL dendritic generation and enhanced transgene efficacies via termini modificationBiomacromolecules2008102284229319586045
- WangYWangLSGohSHSynthesis and characterization of cationic micelles self-assembled from a biodegradable copolymer for gene deliveryBiomacromolecules200781028103717298094
- RenYJiangXPanDMaoHQCharge density and molecular weight of polyphosphoramidate gene carrier are key parameters influencing its DNA compaction ability and transfection efficiencyBiomacromolecules2010113432343921067136
- XuPSQuickGKYeoYGene delivery through the use of a hyaluronate-associated intracellularly degradable crosslinked polyethyleneimineBiomaterials2009305834584319631979
- GuoTZhaoJChangJPorous chitosan-gelatin scaffold containing plasmid DNA encoding transforming growth factor-beta1 for chondrocytes proliferationBiomaterials2006271095110316143394