 ?Mathematical formulae have been encoded as MathML and are displayed in this HTML version using MathJax in order to improve their display. Uncheck the box to turn MathJax off. This feature requires Javascript. Click on a formula to zoom.
Abstract
This paper presents a new method for cancer detection based on diffusion reflection measurements. This method enables discrimination between cancerous and noncancerous tissues due to the intense light absorption of gold nanorods (GNRs), which are selectively targeted to squamous cell carcinoma head and neck cancer cells. Presented in this paper are tissue-like phantom and in vivo results that demonstrate the high sensitivity of diffusion reflection measurements to the absorption differences between the GNR-targeted cancerous tissue and normal, noncancerous tissue. This noninvasive and nonionizing optical detection method provides a highly sensitive, simple, and inexpensive tool for cancer detection.
Background
Nanoparticle-based contrast agents for molecular imaging became a mainstay imaging tool for selectively detecting and imaging biological processes and diseases.Citation1–Citation3 The use of the enhanced scattering properties of gold nanoparticles as near infrared (NIR) contrast agents is under intensive study.Citation4,Citation5 This promising field builds on the safety of nonionizing radiation, ease of generation, relatively high tissue penetration depth (due to the low absorption and scattering properties), and reduced auto-fluorescence of the tissue in this spectral range.Citation6 In addition, the particles’ superior absorption properties have been utilized for photothermal therapy.Citation6–Citation8
Presented in this current work is a novel, noninvasive, and highly sensitive molecular cancer-detection method based on NIR diffusion reflection measurements of cancerous tissues that are targeted with gold nanorods (GNRs). The diffusion reflectance profile of an irradiated tissue depends on its absorption and scattering coefficients.Citation9,Citation10 The absorption coefficient of a tissue is predominantly determined by the concentration of the absorbance molecules, while the scattering coefficient depends mainly on the size and shape of the scattering components in the tissue, rather than their concentration. Citation11–Citation13 Since imaging techniques that are based on scattering (with or without nanoparticles as contrast agents) suffer from relatively high background noise and low contrast, the diffusion reflection method proposes to focus mainly on the absorption properties of the targeted GNRs rather than their scattering properties. As a result, no contrast interruptions are expected.
Since GNRs have unique size- and shape-dependent optical properties, they can cause a significant change in the optical properties of the targeted tissue. Previous studies have presented diffuse reflectance measurements for cancer diagnosisCitation14–Citation16 – but without nanoparticles as contrast agents. The diffusion reflectance method described in this study presents higher efficiency and sensitivity resulting from the GNRs insertion that specifically target cancerous cells and significantly change their absorption.
In the present work, the diffusion reflectance detection method is demonstrated for head and neck cancer (HNC). The head and neck lymph nodes are located adjacent to the skin where visible-NIR light can easily penetrate. One of the major diagnosis challenges in HNC today is reliable detection of involved lymph nodes, since their status is one of the most important prognosis predictors and is also pivotal for appropriate treatment. However, assessment of lymph nodes based on currently available imaging techniques is limited in sensitivity and specificity and fails to distinguish between nonneoplastic and malignant processes. These limitations lead to the routine performance of prophylactic procedures such as extensive neck dissection and radiation. Hence, the development of more sensitive in vivo detection techniques is of major importance and could substantially improve HNC treatment and potential cure. In this present study, GNRs were synthesized and conjugated with anti-epidermal growth factor receptor (anti-EGFR) antibodies (Cetuximab), which home specifically to squamous cell carcinoma (SCC) HNC.Citation17
These GNRs were intravenously injected into tumor-bearing mice. The feasibility of the diffusion reflection technique to detect cancer based on the absorption coefficient differences between cancerous and normal tissues following targeted GNRs injection was examined.
Materials and methods
The diffusion reflection method
The diffusion modelCitation10,Citation18,Citation19 is among the main approaches that best describe the light path in tissues. This approach assumes that light can be treated as a concentration of optical energy that diffuses down a concentration gradient. The loss of energy is caused by the absorbing and scattering components within the tissue.Citation10 The diffusion model can solve several classes of image or property recovery problems. One of the most common among them is the measured Γ(ρ). This Γ(ρ) function, which describes the reflected light intensity (defined as Γ) at the tissue surface in several light source-detector separations (defined as ρ), presents a strong correlation to the tissue optical properties, such as the absorption coefficient μa and the reduced scattering coefficient μs′. The Γ(ρ) function was previously described by the general formula:Citation20,Citation21
where c1 is a constant, depending on the optical properties of the medium and on the sizes of the source and detector apertures; n is the power of ρ, which depends on ρ’s range and on the ratio μa/μs′ and μ is the effective attenuation coefficient given by
(for μa ·μs′).Citation10 As mentioned above, GNRs have unique size- and shape-dependent optical properties. They have the ability to resonantly absorb and scatter visible and NIR light upon the excitation of their surface plasmon oscillation and usually present intense and narrow absorption/scattering peaks.Citation12 Since the Γ(ρ) profile highly depends on the tissue absorption and scattering properties, decorating the tumor with specifically targeted GNRs simply changes the measured Γ(ρ) in the tumor compared with normal tissue. This phenomenon exists as long as the reflected intensity is measured at a wavelength corresponding to the GNRs absorption/scattering surface plasmon resonance peak. In the current work, tissue-like phantoms and mice were irradiated with a 650 nm laser. At this wavelength, certain sizes of GNRs can have significant absorption but a negligible scattering coefficient.Citation12 As a result, the measurements in this work focused on the change in tissue absorption following the GNRs injection, rather than on the change in its scattering properties which is mostly measured in NIR molecular spectroscopy and imaging techniques.
Optical setup
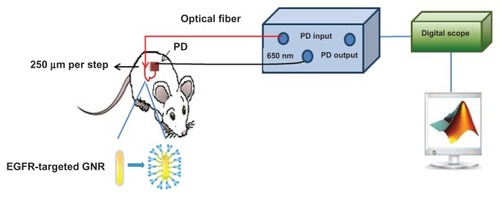
A noninvasive optical technique (see ) was designed and built for reflected light intensity measurements.Citation22 The setup includes a laser diode as an excitation source (650 nm), optically bundled to a fiber (125 μm diameter) for irradiation. A portable photodiode was used as a detector, deposited at different distances, ρ, on the sample surface in order to enable Γ(ρ) measurements. The photodiode’s cross-section diameter was 1 mm2. The initial distance, ρ, between the light source and the first photodiode was ~1 mm. A micrometer plate, to which the optic fiber was attached, enabled a consecutive reflected light intensity measurement. The micrometer plate was moved in 20 incremental steps of 250 μm each. The reflected light intensity was collected from different source-detector distances (ρ) varying between 1 mm (the initial distance between the light source and the photodiode) to 6 mm. The reflected intensity, Γ(ρ) (in volts) was collected using a digital scope (Mso7034a; Agilent Technologies, Santa Clara, CA), and the data was processed using MATLAB. A schematic description of the measurement procedure is presented in .
Figure 1 A schematic description of the experimental setup for the reflected light intensity measurements. Laser diode (650 nm) and an optical fiber (arrow) were used to irradiate the sample on a single point. The photodiode was in close contact with the sample surface. The micrometer plate moved in 20 incremental steps of 250 μm, enabling continuous measurements of the spatial reflectance from the sample, from 1 mm up to 6 mm from the laser diode position.
Abbreviations: EGFR, epidermal growth factor receptor; GNR, gold nanorod; PD, photodiode.
Nanorod fabrication and targeting
GNRs were synthesized using the seed mediated growth method.Citation23 Their size, shape, and uniformity were characterized using transmission electron microscopy (see ), and the resultant size was 25 nm × 65 nm, with narrow size distribution (10%). A solution of GNRs suspended in cetyltrimethylammonium bromide (CTAB) (Sigma-Aldrich, St Louis, MO) was centrifuged at 11,000 g for 10 minutes, decanted, and resuspended in water to remove excess CTAB. To prevent aggregation, to stabilize the particles in physiological solution, and to improve blood circulation time, a layer of polyethylene glycol (mPEG-SH, molecular weight [MW] 5000 g/mol) (creative PEGWorks, Winston-Salem, NC) was adsorbed onto the GNRs. This layer also provided the chemical groups that are required for antibody conjugations (SH-PEG-COOH, MW 3400 g/mol).
Figure 2 Ultra-violet visible absorption spectra (normalized) of bare GNRs (25 nm × 65 nm), PEG-coated and anti-EGFR-coated GNRs, and transmission electron microscopy image of the bare GNRs (inset).
Abbreviations: EGFR, epidermal growth factor receptor; GNRs, gold nanorod; PEG, polyethylene glycol.
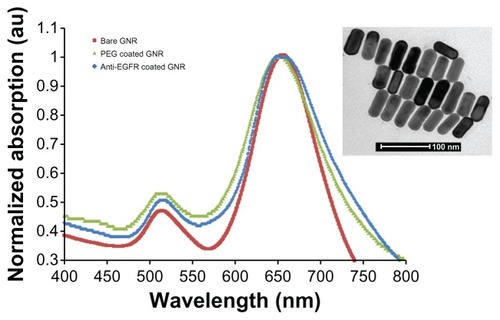
The absorption spectrum of bare GNRs, PEGylated and anti-EGFR-coated GNR solutions were measured and are presented in . Zeta potentialsCitation24 (ZetaSizer 3000HS, Malvern Instruments, Worcestershire, UK) of the resulting GNRs were measured (). The zeta potential indicates the stability of colloidal dispersions, and with regards to the GNRs, the zeta potential refers to the repulsion between adjacent, similarly charged particles. GNRs stabilized in CTAB solution showed cationic surfaces (+13.1 mV). This was due to adsorbed CTAB that has a quaternary amine as a hydrophilic head. In contrast, PEG-modified GNRs showed a nearly neutral surface (+0.87 mV).
Table 1 Zeta potentials of bare, PEG-coated and anti-EGFR-coated GNRs
To specifically target SCC HNC, the PEGylated GNRs were coated with Cetuximab (Erbitux, Merck KGaA, Germany), a monoclonal antibody against EGFRs that is highly sensitive to HNC SCC.Citation25 The binding of the EGFRs to the GNRs was confirmed by zeta potential measurement, resulting in a positive potentialCitation25 (+5 mV, see ). The antibody conjugated GNRs were stable for up to 3 months, confirmed by their maintenance of the same plasmon resonance.
Phantom preparation
Solid phantoms with different absorption coefficients were prepared in order to simulate skin tissues with different optical properties.Citation26 The phantoms were prepared using India ink 0.1% as an absorbing component, Intralipid® 20% (Lipofundin MCT/LCT 20%, B. Braun Melsungen AG, Melsungen, Germany) as a scattering component,Citation27 and 1% agarose powder (SeaKem LE Agarose, Lonza, Norwalk, CT) in order to convert the solution into a gel. The solutions were heated and mixed (at a mixing temperature of ~90°C) while the agarose powder was slowly added. The absorption spectrum of the India ink was determined using a spectrophotometer, and the absorption coefficient of each phantom was calculated according to the concentration of the ink in each solution. The scattering properties of the phantoms were determined according to the scattering coefficients presented by Cubeddu et al.Citation27 The phantoms were prepared in cell culture plates (90 mm) and were cooled under vacuum conditions (to avoid bubbles). Five phantoms with the same scattering properties and different absorption coefficients were prepared. Each phantom contained 2% of Intralipid and increasing concentrations of India ink: 5.0 × 10⁻⁴, 2.5 × 10⁻³, 5.0 × 10⁻³, 7.0 × 10⁻³, and 1.0 × 10⁻¹ (%). The resulted scattering coefficient was ~1.6 mm−1, and the resulting absorption coefficients were μa = 0.0064, 0.0126, 0.0180, 0.0227, and 0.0295 mm−1, respectively.
GNRs (10 mg/mL) were added into two identical phantom solutions, containing 2 × 10⁻³% of ink and 2% of Intralipid (optical properties of μa = 0.0115 mm−1 and μs’ = 1.6 mm−1) to achieve final concentrations of 0.03 and 0.008 mg/mL of gold in the phantoms. The solutions were heated and mixed at a temperature of approximately 90°C while the agarose powder was slowly added. Then, the phantom solutions were poured into a 24-well plate (each well with a 16 mm diameter) and were cooled under vacuum conditions.
In vitro experiment
A-431 cells (2.5 × 10⁶) in 5 mL Dulbecco’s modified Eagle’s medium containing 5% fetal calf serum, 0.5% penicillin, and 0.5% glutamine were divided into two groups for a quantitative cell binding study (each experimental group was run in triplicate). The first group was incubated with 50 μL of anti-EGFR-coated GNRs (25 mg/mL) for 30 minutes at 37°C, and the second group (negative control) was incubated under the exact same conditions with anti-rabbit immunoglobulin G (IgG)-coated GNRs. After incubation, the medium was washed twice with phosphate buffered saline followed by the addition of 1 mL of aqua regia HCl:HNO3 (1:3) (Sigma-Aldrich). After evaporation of the acid, the sediment was dissolved in 5 mL 0.05 M HCl. The gold concentrations of the samples were quantified by atomic absorption spectroscopy (AA 140; Agilent Technologies, Santa Clara, CA).
In vivo experiment
This new method for tumor detection was evaluated using mice bearing human HNC derived from an A-431 SCC cell line. A-431 cells (2 × 10⁶) were injected subcutaneously into the back flank area of 10–11-week-old nude mice. These cells express from 2 × 10⁴ to 2 × 10⁶ EGFRs per cell.Citation28,Citation29 When the tumor reached a size of 7–9 mm in diameter, the mice received 100 μL (25 mg/mL) of immuno-targeted GNRs by tail vein injection. Mice tumor and normal tissue (control #1; identical organ on the opposite side, without tumor, after the GNRs injection) were scanned immediately after GNRs injection and up to 10 hours post-injection. As a control experiment, the same mice were scanned (tumor and normal tissues) before GNRs injection (control #2 and #3, respectively). Diffusion reflection measurements were performed on all samples to test the ability to specifically and sensitively detect tumors.
All in vivo measurements were performed under appropriate anesthesia: the mice barrier-controlled facility was under the strict care of the veterinarian in charge of the Institutional Animal Care and Use Committee (IACUC). The mice were inspected daily by the veterinarian, who handles the appropriate tests and treatment protocols, as required. All research protocols were followed closely by the veterinarian. All major procedures were performed in the surgical facilities using general anesthesia and standard, aseptic surgical techniques.
Results
Phantom results
The reflected light intensity from five different phantoms was measured using the experimental setup described above. Representative results of the reflected light intensity profiles are presented in . The experimental results correlate well with the analytical predictions of the diffusion theory: the larger the μa, the sharper the graph’s slope. The phantoms’ absorption coefficients were 0.0064, 0.0126, 0.0180, 0.0227, and 0.0295 mm−1, and the slopes represent increasing respective negative values of: 0.57, 0.64, 0.69, 0.74, and 0.81. The increasing negative values of the slopes directly correlate with the increasing concentrations of ink in the phantoms. These results indicate the experimental setup’s ability to clearly distinguish between different absorption coefficients.
Figure 3 Diffusion reflection intensity (in semi-logarithmic scale) as a function of the distance between the detector and the light source, for different phantoms as follows: (A) homogeneous phantoms with the same reduced scattering property μs′ = 1.6 mm−1 but different absorption coefficients of 0.0064, 0.0126, 0.0180, 0.0227, and 0.0295 mm−1 (the solid, dashed, dotted, diamond marked, and triangle marked lines, respectively); and (B) a homogeneous phantom (the solid line) and phantoms with gold nanorod particles of different concentrations (the cross- and the circle-marked lines).
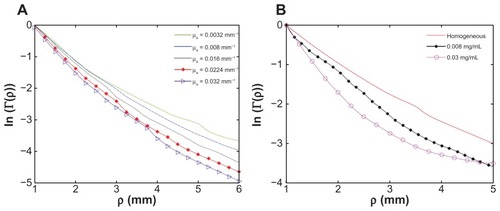
presents the reflected light intensity from three solid phantoms as follows: one homogeneous phantom (a solid phantom without GNRs, μa = 0.0115 mm−1 and μs′ = 1.6 mm−1) and two phantoms containing 0.008 and 0.030 mg/mL of GNRs. The results clearly indicate that the presence of GNRs within the phantom increases the slope of the reflected intensity profile. Moreover, the higher the GNRs concentration, the sharper the reflectance graph slope. The phantom with 0.008 mg/mL of GNRs represents a negative slope of 1.11, while the phantom containing 0.030 mg/mL of GNRs represents a negative slope of 1.39. As mentioned above, the GNRs have high absorption at 650 nm but negligible scattering properties. Therefore, the observed increase in the graph’s slope is due to the increase in the absorption of the irradiated phantom resulting from the presence of the GNRs.
In vitro cell-binding experiment
To evaluate the specificity of the interaction between the antibody-coated GNRs and the A-431 SCC cancer cells (which highly express the EGFR), two types of GNRs were introduced to the cells: the first was specifically coated with anti-EGFR antibody; whilst the second, which was used as a negative control, was coated with a nonspecific antibody (anti-rabbit IgG). Flame atomic absorption spectroscopy measurements quantitatively demonstrated that the active tumor targeting (anti-EGFR-coated GNRs) was significantly more specific than the control experiment (anti-rabbit IgG-coated GNRs). The A-431 cells took up 21.8 ± 2.3 μg of targeted GNRs, whilst parallel cells in the negative control experiment absorbed only 0.20 ± 0.01 μg of GNRs.Citation25 These results correlate well with previously published studies, which report that head and neck SCC express from 2 × 10⁴ to 2 × 10⁶ EGFRs per cell.Citation28,Citation29
In vivo results
The tumor-bearing mice were irradiated, under appropriate anesthesia, and the reflected light intensity was measured using the optical setup described above. The reflectance measurements were performed before the GNRs injection and for several delay times (15 minutes, 3, 5, and >10 hours) post-injection. The slopes of the reflected light intensity profiles were calculated, and average results are shown in .
Figure 4 Comparison between the reflected light intensity slopes (absolute values) of the cancerous and normal tissues at several time points.
Notes: The results are the average of five to ten diffusion reflection measurements of different mice. The error bars represent error of the mean. The highest error bar is of the normal tissue immediately post injection, indicating different rates of the gold nanorod flow in the different mice’s blood.
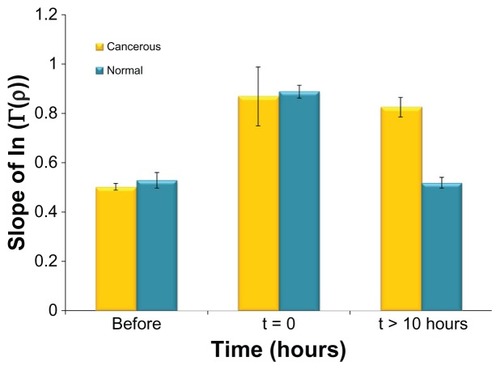
compares the reflected light intensity slopes (absolute values) of the cancerous and the normal tissues, for three representative times: (1) before GNRs injection (control #2 and #3), (2) immediately (~15 minutes) after intravenous injection, and (3) more than 10 hours post-injection. It is clearly demonstrated that >10 hours post GNRs injection there is a significant change (of more than 60%) between the reflectance profiles of the cancerous and the normal tissue (control #1). This change results from specific accumulation of GNRs in the tumor. It is also demonstrated that immediately after GNRs injection, as well as for the delay times of 3 and 5 hours post-injection (results not shown), the reflectance profiles of both the cancerous and the normal tissues present an increase in their slopes, which indicates the GNRs’ long circulating time in the blood. After that time, the GNRs were gradually cleared from the blood until their complete clearance from the normal tissue, resulting in a decrease of its reflectance slope compared with the cancerous tissue, which kept a stable value of 0.8. Regarding control #3 (normal tissue before the GNRs injection), the mice’s normal tissues were irradiated in different areas in the mice’s skin tissue, and the reflectance slopes of the different areas were almost identical, resulting in a small standard deviation (small error bar in the left column in ). This high similarity of these slopes indicates that any area of the skin can be irradiated, and the resulted reflection slope will always be lower than the tumor reflection slope 10 hours post the GNRs injection, enabling a consistent tumor detection.
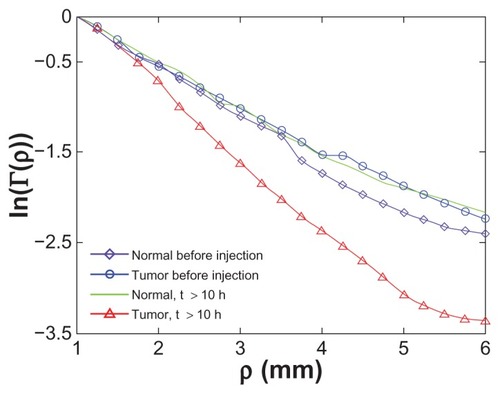
emphasizes the difference between the slopes before GNRs injection and >10 hours post-injection for the cancerous and normal tissues, as directly obtained from the reflected light intensity measurements. While the reflectance slope, which directly indicates the absorption coefficient of the normal tissue, is the same before GNRs insertion and >10 hours post-injection, the tumor clearly represents a sharper slope. This clear discrimination between cancerous and normal tissue enables sensitive and specific cancer detection based on diffusion reflection measurements.
Figure 5 Diffusion reflection intensity (in semilogarithmic scale) as a function of the distance between the detector and the light source. The graph emphasizes the difference between the slopes before GNRs injection and >10 hours post-injection for the cancerous and normal tissues. While the absorption value and the reflectance slope of the normal tissue is the same before GNRs insertion and more than 10 hours post-injection, the tumor clearly presents a higher absorption value resulting in a sharper slope.
Abbreviation: GNRs, gold nanorods.
Discussion
This work presents a novel in vivo cancer detection technique that utilizes the unique favorable absorption properties of GNRs in the NIR region. The ability to specifically deliver and target high concentrations of GNRs exclusively to the tumor significantly elevated the absorption coefficient of the tumor and enabled the discrimination (by more than 60%) between cancerous and noncancerous tissues. As opposed to NIR imaging techniques that utilize the scattering properties of the tissue, the key advantage of the proposed diffusion reflection technique is its ability to directly correlate between the absorbers’ molecules concentration and the Γ(ρ) signal. Further investigation is required to best correlate between the diffusion reflection slope and the GNRs concentration in the tissue, which can indicate the tumor size. This noninvasive and nonionizing optical detection method is expected to provide a highly sensitive, simple, and inexpensive tool for cancer detection.
Conclusion
A novel and simple method for cancer detection is presented. Using the absorption properties of gold nanoparticles, the detection of HNC was enabled based on diffusion reflection measurements of the cancerous tissue.
Acknowledgments
This work was supported by Merck Sorono, the Elias, Genevieve and Geogianna Atol Charitable Trust, and the Katz Family Grant Incentive Program.
Disclosure
The authors report no conflicts of interest in this work.
References
- LeeJHHuhYMJunYWArtificially engineered magnetic nanoparticles for ultra-sensitive molecular imagingNat Med200713959917187073
- WeisslederRPittetMJImaging in the era of molecular oncologyNature200845258058918385732
- HilderbrandSAWeisslederRNear-infrared fluorescence: application to in vivo molecular imagingCurr Opin Chem Biol201014717919879798
- ChenJSaekiFWileyBJGold nanocages: bioconjugation and their potential use as optical imaging contrast agentsNano Lett2005547347715755097
- GobinAMLeeMHHalasNJJamesWDDrezekRAWestJLNear-infrared resonant nanoshells for combined optical imaging and photothermal cancer therapyNano Lett200771929193417550297
- HuangXEl-SayedIHQianWEl-SayedAMCancer cell imaging and photothermal therapy in the near-infrared region by using gold nanorodsJ Am Chem Soc20061282115212016464114
- LoweryARGobinAMDayESHalasNJWestJLImmunonanoshells for targeted photothermal ablation of tumor cellsInt J Nanomedicine2006114915417722530
- LalSClareSEHalasNJNanoshell-enabled photothermal cancer therapy: impending clinical impactAcc Chem Res200841842185119053240
- ReifRA’AmarOBigioIJAnalytical model of light reflectance for extraction of the optical properties in small volumes of turbid mediaAppl Opt2007467317732817932546
- JacquesSTPogueBWTutorial on diffuse light transportJ Biomed Opt20081304130210413019
- LeeKSEl-SayedMADependence of the enhanced optical scattering efficiency relative to that of absorption for gold metal nanorods on aspect ratio, size, end-cap shape, and medium refractive indexJ Phys Chem B2005109203312033816853630
- JainPKLeeKSEl-SayedIHEl-SayedMACalculated absorption and scattering properties of gold nanoparticles of different size, shape, and composition: applications in biological imaging and biomedicineJ Phys Chem B20061107238724816599493
- ShimadaMSatoCHoshiYYamadaYEstimation of the absorption coefficients of two-layered media by a simple method using spatially and time-resolved reflectancesPhys Med Biol2009545057507119652290
- YangYCelmerEJKoutcherJAAlfanoRRUV reflectance spectroscopy probes DNA and protein changes in human breast tissuesJ Clin Laser Med Surg200119353911547817
- BigioIJBownSGBriggsGDiagnosis of breast cancer using elastic-scattering spectroscopy: preliminary clinical resultsJ Biomed Opt2000522122810938787
- ZhuCPalmerGMBreslinTMHarterJRamanujamNDiagnosis of breast cancer using diffuse reflectance spectroscopy: comparison of a Monte Carlo versus partial least squares analysis based feature extraction techniqueLas Surg Med200638714724
- BaselgaJThe EGFR as a target for anticancer therapy – focus on cetuximabEur J Cancer2001371622
- DasMXuCZhuQAnalytical solution for light propagation in a two-layer tissue structure with a tilted interface for breast imagingAppl Opt2006455027503616807614
- JohnsonPMFaezSLagendijkADFull characterization of anisotropic diffuse lightOpt Exp20081674357446
- SchmittJMZhouGXWalkerECWallRTMulti layer model of photon diffusion in skinJ Opt Soc Am A19907214121532254803
- FarrellTJPattersonMSWilsonBA diffusion theory model of spatially resolved, steady-state diffuse reflectance for the noninvasive determination of tissue optical properties in vivoMed Phys1992198798881518476
- AnkriRTaitelbaumHFixlerDReflected light intensity profile of two-layer tissues – phantom experimentsJ Biomed Opt.201116808500121895309
- NikoobakhtBEl-SayedMAPreparation and growth mechanism of gold nanorods (NRs) using seed-mediated growth methodChem Mater20031519571962
- MaldineyTRichardCSeguinJWattierNBessodesMSchermanDEffect of Core Diameter, Surface Coating, and PEG chain length on the biodistribution of persistent luminescence nanoparticles in miceACS Nano2011585486221291197
- ReuveniTMotieiMRommanZPopovtzerAPopovtzerRTargeted gold nanoparticles enable molecular CT imaging of cancer: an in vivo studyInt J Nanomedicine201162859286422131831
- DamJSPedersenCBDalgaardTFabriciusPEArunaPAndersson-EngelsSFiber-optic probe for noninvasive real-time determination of tissue optical properties at multiple wavelengthsAppl Opt2001401155116418357101
- CubedduRPifferiATaroniPTorricelliAValentiniGA solid tissue phantom for photon migration studiesPhys Med Biol199742197119799364593
- StantonPRichardsSReevesJEpidermal growth factor receptor expression by human squamous cell carcinomas of the head and neck, cell lines and xenograftsBr J Cancer1994704274338080726
- ToddRWongDTEpidermal growth factor receptor (EGFR) biology and human oral cancerHistol Histopathol19991449150010212811