Abstract
The quantification of drug metabolites produced during drug metabolism is a growing concern for the pharmaceutical industry, regulatory agencies such as the US Food and Drug Administration, the European Medicines Agency, and others. As 70% of drugs are known reactive metabolites and have black box warnings, they are a major cause of drug-induced injury and lead to drug attrition in early or late clinical stages. According to a 2006 survey report of pharmaceutical companies, drug-induced liver injury was ranked first in terms of adverse events, and it remains the most common reason for restriction or withdrawal of a drug from the market by the Food and Drug Administration. Although there are many reasons underlying drug-induced liver injury, one of the most important is liver failure induced by drug metabolites. Generally, a drug produces metabolites that may bind to cellular molecules and trigger a toxicological effect, cause serious adverse drug reactions, or alter cellular functions. Experimental cellular models that attempt to qualify drug metabolites from cell cultures rely on human plasma and urine obtained from clinical trials and supernatant during early in vitro experiments. However, there is a lack of information about the quantification of drug metabolites inside human hepatocytes, where the drug is extensively metabolized. To overcome this limitation, we used the highly accepted, gold standard organotypic cellular model of primary human hepatocytes to investigate and quantify the parent drug, as well as drug metabolites inside human hepatocytes and outside human hepatocytes to evaluate the quantity of drug metabolites, which are assumed to have remained inside the primary human hepatocytes. We refer to this as a two-compartment model, where one compartment is supernatant compared with in vivo hepatic blood circulation, and the other is inside the hepatocyte cell compared with the inside of in vivo human liver. We detected the nanoconcentrations of all major metabolites (desmethyldiazepam, temazepam, and oxazepam) of the diazepam drug, both inside the cells (matrix) and outside the hepatocyte cells (supernatant) at different time points (primary human hepatocytes: 0, 1, 2, 4, 8, and 24 hours; primary porcine hepatocytes: 0, 1, 2, 5, and 24 hours) during biotransformation in an organotypic sandwich cellular model. Although it is difficult to detect tissue distribution of metabolites in humans, we strongly recommend testing in a two-compartment model of primary human hepatocytes, as nonhuman models may not reflect human metabolism. Preclinical drug screening assessment tests that use this two-compartment strategy may facilitate safer registration of new drug candidates.
Introduction
Drug- and drug metabolite-mediated toxicity in the postmarketing stage or late clinical trial stage is an increasing economic and health concern for academics, clinicians, and the pharmaceutical industry. Presently, the spectrum of productivity in drug discovery has been inadequate, due to rapid postmarketing withdrawal, restricted use, and black box warnings.
Despite sophisticated instruments and advanced techniques for drug development, the therapeutic benefits of medications and drug safety are unsatisfactory, with high attrition rates in clinical trials or in the postmarketing period, which affects the pharmaceutical industry, regulatory agencies, physicians, and patients. The development of a single drug, from preclinical screening to use in the clinical setting, is a very lengthy (>12 years) and costly (>US$800 million) process.Citation1,Citation2 The pharmaceutical industry suffers heavy attrition rates due to more than 90% of new drugs failing regulatory approval in late preclinical or clinical phases of investigation.Citation3 According to a survey of pharmaceutical companies in 2006, hepatotoxicity ranked first for withdrawal of approved drugs from market.Citation4 In one report, many volunteers and patients suffered from liver failure that required surgery or liver transplantation (90 cases of liver failure, 70 of which resulted in death or transplantation) and died due to unexpected hepatotoxicity during Phase III clinical trials.Citation5 In 2008, the European Commission estimated that adverse reactions kill 197,000 EU citizens annually, at a cost of €79 billion.Citation6 It is estimated that more than 900 drugs are associated with hepatotoxicityCitation7 and have been withdrawn from the market, while many others are recalled or require labeling changes. Currently, the pharmaceutical industry is concerned over hepatotoxicity guidance.Citation8 There are no signs of hepatotoxicity of market drugs in preclinical drug development. The incidence of hepatotoxicity caused by drugs or their metabolites increases on a daily basis. Many approved drugs have been taken off the pharmaceutical market or given black box warnings over the past four years, due to unexpected liver failure/hepatotoxicity. Many approved drugs remained on the market for only 2 to 4 years. For example, sitaxsentan was approved in 2006 by regulatory agencies, such as the US Food and Drug Administration (FDA) and the European Medicines Agency (EMA), but it was withdrawn from the market on December 10, 2010 because of a high incidence of hepatotoxicity. There are many examples of market drugs that have been quickly withdrawn from the market within this 2-to-4-year window after agency approval. Although there are many reasons underlying drug-induced hepatotoxicity, one of the most important is hepatotoxicity induced by drug metabolites.
The safety testing of drug metabolites is of increasing concern to both the pharmaceutical industry and regulatory agencies,Citation9 as many frequently prescribed drugs have been associated with warnings or have been withdrawn shortly after receiving clinical approval, due to toxicity of the metabolites.Citation10 Furthermore, it has been considered that active metabolites have potentially superior therapeutic benefits relative to their parent compounds, as evidenced by the therapeutic roles of metabolites in 22% of drugs prescribed in the USA in 2003.Citation11 Although metabolites have beneficial effects, if they accumulate inside hepatocytes (where the parent compound is metabolized), they may induce toxic effects. There are many publications on the mechanisms of wide-range toxic models, but there is a critical lack of publications regarding the safety assessment of drug metabolites, especially quantification of metabolites inside hepatocytes. Quantitative analyses of drug metabolites inside hepatocyte cells have not been conducted in early preclinical stages, which is a major limitation of the existing preclinical in vitro model.Citation12,Citation13 Very recently, various toxicology and regulatory agencies, including the FDA, have raised serious issues regarding complete drug metabolite profilesCitation14–Citation31 during the early clinical development of drug candidates, prior to initiation of large human clinical trials.
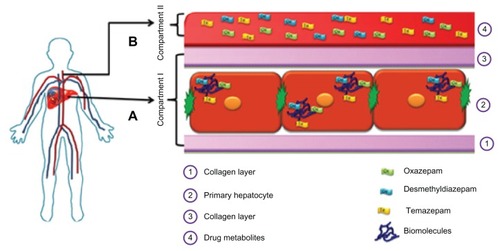
The biotransformation of drugs into reactive, active, or stale silent metabolites, which can all bind to hepatic cellular biomolecules (protein and DNA), is a fundamental concept during drug development.Citation12,Citation13 We hypothesize that during drug biotransformation, drug metabolites not only escape to the supernatant or serum/plasma, but they also remain in vivo in the cell matrix phase in hepatic tissue or hepatocytes cells.Citation12 A hypothetical two-compartment model of drug metabolite quantification that compares the in vivo hepatic blood situation and plasma circulation, with special reference to drug metabolite detection during biotransformation, is provided in . Conventional in vitro studies have been limited primarily to measurements of the quality and quantity of drug metabolites of parent compounds in cells. A key in the investigation of drug metabolites is to determine whether these metabolites are able to escape from the cells in which they are formed. To detect the drug metabolites in vivo, samples such as bile, urine, and plasma are collected from experimental animals and humans, but without a focus on whole cell metabolite analysis. Our opinion is that some reactive metabolites may keep accumulating in the cell matrix phase and potentially create adverse reactions with other drugs. Although it is difficult to detect tissue distribution of metabolites in humans, we strongly recommend testing in a two-compartment model of primary human hepatocytes, as nonhuman models may not reflect human metabolism. We hypothesize that it is of equal importance to understand the distribution of metabolites in both plasma and tissue, as drug-metabolizing enzymes are not equally distributed in the liver. In particular, two-compartment models may help detect silent metabolites as well as reactive metabolites.
Figure 1 A hypothetical two-compartment model of drug metabolite quantification to compare the in vivo hepatic blood situation and plasma circulation, with special reference to drug metabolite detection during biotransformation. (A) matrix phase (inside the human hepatocytes: Compartment I) compared to the interior of the in vivo hepatocyte cells and (B) supernatant (Compartment II) compared to blood plasma, as in vivo hepatocytes have direct contact with human plasma – hepatocytes can extract oxygen and nutrients and detoxify chemicals in the plasma, and their metabolites pass into the plasma.
Note: Preclinical drug screening assessment tests that utilize this two-compartment strategy may facilitate safer registration of new drug candidates.
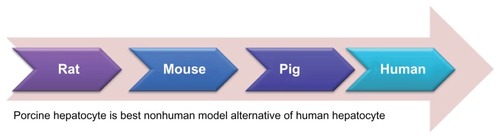
Reliance on animal experimentation or cell lines for testing metabolite safety profiles often yields irrelevant data for clinical trials of human volunteers and patients, resulting in failed treatments and hazardous health conditions. Several hepatic cell lines have been developed for drug metabolism, but low expression of drug-metabolizing enzymes of these cell lines is a significant limitation. The primary hepatocytes are diploid, whereas the immortalized cell lines are aneuploids. Aneuploid cell lines do not represent the entire population, due to their abnormal karyotype, possibly causing them to interfere with toxicology results. Although primary human hepatocytes have been considered the gold standard for in vitro drug metabolism studies, there should be an alternative, due to a scarcity of primary human hepatocytes. Recently, we compared primary rat, porcine, and human hepatocytes and found the porcine hepatocyte to be the closest human analog in terms of drug metabolism.Citation32 Therefore, the pig is the best nonhuman model for drug biotransformation, because it is anatomically and physiologically similar to humans (), and there are no major ethical issues. Not only can extracorporeal pig liver perfusion be used for liver failure,Citation33 but the pig also has been considered for other human xenotransplantations, such as fetal pancreatic islets for diabeticsCitation34 and neural cells for Parkinson’s disease.Citation35 Consequently, it is sensible to use porcine hepatocytes when human hepatocytes are unavailable.
Figure 2 The pig liver is closer to human liver anatomy than rat or mouse liver.
Notes: Therefore, we investigated the drug metabolism of diazepam and its metabolites in both human and porcine hepatocytes. It is widely accepted that the porcine hepatocyte is the best nonhuman model to use as an alternative to human hepatocytes, due to shortages or unavailability of human hepatocytes.
Organotypic sandwich models are always superior to conventional, collagen-coated cultures with respect to liver-specific functions, drug-metabolizing enzymes,Citation36–Citation38 and other liver features, such as cuboidal morphology, bile canaliculi, tight junctions, and gap junctions.Citation39,Citation40 Advanced organotypic cellular models provide challenges in the biotransformation of drugs; the conventional in vitro model is highly criticized. Research (in both the pharmacological and toxicological fields) into the expression of drug-metabolizing enzymes also relies on cell culture models during the biotransformation of drugs. It has been reported that the expression of sensitive enzymes and rates of metabolite formation are much lower in conventional primary hepatocyte culture models than in the organotypic model.Citation41 Therefore, in the organotypic model, the inductive potential of a drug is better, which may lead to the observation of a qualitative instead of a quantitative effect.
Diazepam has been used routinely in surgery for 40 years, for a wide range of disorders, including insomnia, alcohol withdrawal, epilepsy, and other neuropsychiatric disorders, in addition to its sedative and anxiolytic effects. Therefore, we designed this experiment to analyze the biotransformation of diazepam in an organotypic sandwich model of primary human hepatocytes () and primary porcine hepatocytes (). Diazepam and its major metabolites, nordiazepam, temazepam, and oxazepam, in human primary hepatocytes and porcine hepatocytes, were analyzed by high-performance liquid chromatography (HPLC), using an easy and quick two-compartment strategy. Our approach addresses the challenges facing the pharmaceutical industry to provide safety profiles for metabolites of drug candidates during the various stages of drug development and allows for a direct comparison between the interior of the human liver and plasma/hepatic circulation.
Figure 3 Timeline for diazepam metabolism experiment in human hepatocytes.
Notes: On Day 0, cells are isolated and placed on a dish precoated with collagen. Two days after the insulation, a second collagen layer is added to make the organotypic sandwich cellular model. The experiment begins on Day 3, with different incubation times. The experiment was performed three times at different isolations. Number of dishes per time point, n = 3 per experiment.
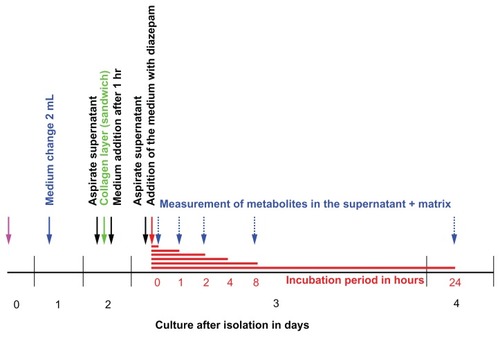
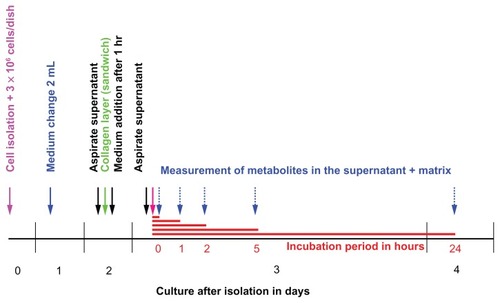
Figure 4 Timeline for diazepam metabolism experiment in primary porcine hepatocytes.
Notes: On Day 0, the isolation was performed. Two days later, the cells were coated with the second layer of collagen. On the third day, the experiment took place at different incubation times. The experiment was conducted four times at different isolations. Number of dishes per time point, n = 3 per experiment.
Materials and methods
Chemicals and reagents
William’s medium E (WE) was obtained from BioWhittaker (Verviess, Belgium), Dulbecco’s Modified Eagle Medium (DMEM) without phenol red from Cell Concepts (Umkirch, Germany), collagenase type IV CLS and fetal calf serum (FCS) from Biochrom (Berlin, Germany), H-insulin from Hoechst AG (Frankfurt, Germany), and pentobarbital (Nembutal®) from Sanofi CEVA (Hannover, Germany). Ethylene glycol-bis(β-aminoethyl ether)N,N,N′,N′-tetraacetic acid (EGTA), 2-[4-(hydroxyethyl)-1-piperazino]-ethansulfonic acid (HEPES), bovine serum albumin (BSA), glucose, NaCl, prednisolone, albumin, tetramethylbenzidine (TMB), 7-ethoxyresorufin, dicumarol, β-glucuronidase, testosterone, testosterone-β-D-glucuronide, and ethoxycoumarin were purchased from Sigma (Taufkirchen, Germany), Hank’s balanced salt solution (HBSS), and trypan blue from PAA Laboratories (Linz, Austria), Ringer buffer from Delta Pharm (Pfullingen, Germany), and glycine from Baker Analyzed® Reagent (Deventer, The Netherlands). Glucagon, KCl, and CaCl2 were acquired from Merck (Frankfurt, Germany), penicillin, streptomycin, and L-glutamine from GIBCO (Eggenstein, Germany), and heparin from Serva GmbH (Heidelberg, Germany). H2O2 and H2SO4 were obtained from Roth (Karlsruhe, Germany), and goat antialbumin antibodies from Bethyl (Montgomery, TX, USA). [4-14C]-testosterone was purchased from Amersham Buchler GmbH (Braunschweig, Germany), with a specific activity of 59 mCi/mmol (7.51 MBq/mg). Steroid standards of the major monohydroxylated testosterone metabolites (OH-T) were acquired from Steraloids Inc (Wilton, NH). All other chemicals were of either analytical, reagent, or HPLC grade.
Isolation of human hepatocytes
Human hepatocytes were isolated from specimens obtained from patients undergoing liver lobectomy as therapy for hepatic tumors. Small peripheral pieces (10–20 g) of healthy tissue were removed from the safety margin of healthy tissue resected together with the nodular tumor to prevent the intraoperative tumor from spreading and to ensure total removal of the tumor. Specimens were transferred to ice-cold Krebs–Ringer buffer (KRB) without Ca2+. Vessels visible on the cut surface were cannulated. Perfusion started with 400 mL Ca2+ free KRB for 8 minutes, followed by a perfusion, for 12 minutes, of 200 mL KRB containing 21.5 U collagenase type IV (Biochrom) and 9 mL of 11 M CaCl2. The collagenase perfusate was recirculated, and the perfusion was performed at the rate of 50 mL per minute−1. All perfusates were equilibrated with 95% oxygen and 5% carbon dioxide and warmed to 37°C. The resulting cell suspension was filtered through nylon mesh with a 100-μm pore size and washed three times with cold KRB. Hepatocyte viability ranged from 90% to 95% as assessed by trypan blue exclusion assay. On average, 6 × 10⁷ cells were obtained from one isolation procedure. Prior to surgery, the patients gave informed consent for the use of their tissue for research purposes. Resections were performed at the Department of Abdominal and Transplant Surgery, Medical School of Hannover.
Porcine hepatocyte isolation
Female pigs (6–8 weeks old, 20–30 kg in weight) belonging to the German Landrace were obtained from the Mariensee animal breeding institution (Germany). Anesthesia was administered to all the pigs by intramuscular application of 10 mg/kg body weight azaperone and 0.025 mg/kg body weight atropine sulfate. The pigs were placed on an operating table equipped with a warming blanket. For oral intubations with a cuffed endotracheal tube, the animals received thiopental (12.5 mg/kg body weight) and fentanyl (0.005 mg/kg body weight) via a small venous catheter inserted into the ear vein. After intubating, the animals were ventilated with intermittent positive pressure, using a Ventilog respirator (Drager Medical, Lubeck, Germany) with one-third oxygen and two-thirds nitrous oxide flow. The tidal volume was kept between 300 and 400 mL, with a ventilation rate between 10 and 15 per minute−1. The animals were hepatectomized, and the livers were transferred to the lab in sterile cold Ringer buffer. The cells were isolated according to a modification of the methods described by SeglenCitation42 and Hoogenboom et al.Citation43 The liver was perfused at 37°C with buffer A containing KCl (6.71 mM), NaCl (142 mM), and HEPES (10 mM) substituted with EGTA (0.2 mM). When the excreting buffer stayed clear, the organ was perfused with the same volume of buffer B (same as buffer A, but without EGTA) to wash out the EGTA. Afterwards, 500 mL of buffer C containing KCl (6.71 mM), NaCl (66.75 mM), HEPES (10 mM), glucose (11 mM), and collagenase (130 kU/l, type IV CLS; Biochrom) were recirculated through the liver for 5 minutes, followed by an addition of 10 mL CaCl2 (200 mM) and a further recirculation for half an hour. The organ was then cut into pieces and placed into sterile 4°C cold buffer D, containing 10% HBSS, HEPES (10 mM), BSA (2.0 g/L), glucose (5.56 mM), and CaCl2 (2 mM). The liver cells were released from the liver and the suspension was filtered through a nylon membrane (pore size 100 μm) and then centrifuged at 55 × g for 5 minutes. The resulting pellet was resuspended in buffer D and washed three times. The cells were then resuspended in culture medium and counted in a hemocytometer in the presence of trypan blue and NaCl. A mean viability of 90.5% ± 1.0% was obtained.
Cell cultivation in an organotypic model
Primary human hepatocytes were enclosed within two layers of collagen, as described in the literature.Citation36,Citation37 Rat tail collagen was prepared according to the method of Elsdale and Bard.Citation44 Final concentration was 1.5 mg mL−1. Glass Petri dishes, 60 mm in diameter (Schott, Mainz, Germany), were coated for 30 minutes with 100 μg cm−2 collagen. Hepatocytes were seeded at a density of 2 × 10⁶ cells per dish. Four hours following the seeding and attachment of the cells, the culture medium (Williams E; Biochrom) was removed, along with nonadherent cells, and a second layer of liquid and ice-cold collagen was pipetted on top of the hepatocytes. After gelation of this second matrix layer, a sandwich configuration with two layers of hydrated collagen gel was formed, reflecting the in vivo bipolar hepatocellular enclosure within the matrix of the space of Dissé. Thirty minutes following gelation of this second matrix layer, the culture medium was placed on top. The pH of the collagen solution was adjusted to 7.4 using a 10 × DMEM (Biochrom) concentrate, which was diluted with the collagen solution at a ratio of 1:10. The total volume of cell culture supernatant was 4 mL, including the hydrated collagen matrix volume of 2 mL.
Culture media were supplemented with 2% (v/v−1) fetal bovine serum (Biochrom), prednisolone 9.6 μg mL−1, glucagon 0.014 μg mL−1 (Novo, Mainz, Germany), and insulin 0.16 U mL−1 (Hoechst). Penicillin 200 U mL−1 and streptomycin 200 μg mL−1 (Biochrom) were also added. The culture medium was replaced with fresh medium every 24 hours.
In vitro studies for assessment of diazepam biotransformation
Human hepatocytes were exposed to 1 μg mL−1 diazepam on the second day in culture. At all the time points, the experiments were run in duplicate. All experiments were repeated four times, using cells from five individual isolations. For each time point, a different petri dish was harvested: supernatants and cell matrix phase equaling 2 mL each were aspirated and frozen separately at −20°C until HPLC analysis.
Analysis of diazepam and metabolites by HPLC
Midazolam (1 μg), as internal standard, and 20 μL 4 M NaOH were added to 1 mL of each probe. After adding 100 μL isopropanol, the probes were extracted after 30 minutes with 5 mL ethyl acetate and centrifuged 10 minutes with 200 g. The ethyl acetate phase was evaporated under nitrogen atmosphere, and the remnant was dissolved in 120 μL mobile phase of HPLC, consisting of acetonitrile + methanol + 0.04% triethylamine (40 + 10 + 50 volume parts) pH 7. 80 μL were loaded on a HPLC Nucleosil®-100-5 C18 HD-column (Macherey-Nagel, Düren, Germany). The HPLC equipment was from Merck (Darmstadt, Germany) and Hitachi (Tokyo, Japan) and consisted of an L7100 HPLC pump, L7200 autosampler, L7450 UV detector, D7000 interface module, and HPLC system manager, running on a Compaq computer. The flow rate of the mobile phase was 0.8 mL minute−1; the column temperature was 22°C. For the quantification of temazepam, desmethyldiazepam and oxazepam standards of 10 ng–10 μg were extracted and measured, as described above.
Statistical analysis
Values are expressed as arithmetic means ± standard deviation (SD). Statistical significance was analyzed for drug biotransformation data, representing five separate hepatocyte preparations. Prior to the statistical analysis, a logarithmic transformation was performed on raw data to account for variance heterogeneity and distributional irregularities. Thereafter, Student’s t-tests were used to assess the statistical relevance of all the acquired data. P-values less than 0.05 were considered statistically significant.
Results
Two-compartment strategy for biotransformation of diazepam and quantification of its metabolites in an organotypic cellular model of primary human hepatocytes
Diazepam
The metabolism of diazepam (parent compound) in the matrix and the supernatant is shown in and . At time t = 0, the diazepam concentration in the supernatant was higher than in the matrix (supernatant: 10840 ± 869.32 ng/mL; matrix: 8508.33 ± 1210.24 ng/mL; difference: 2331.67). After an hour, the concentration of diazepam in the supernatant was lower than in the matrix. The time factor here compares the activity of the distribution, binding, and release of the drug, and is particularly evident in the following exposure times. Here, an analogy can be drawn to the pharmacokinetics of in vivo conditions (absorption, distribution, metabolism, elimination). The difference of diazepam in the matrix and what remained in the supernatant during the exposure period, from an hour or less, was the same (). Furthermore, during the exposure period, the measured diazepam concentration in the supernatant was lower (at t = 0: 10840 ± 869.32 ng/mL; after 24 hours: 1238.33 ± 216.63 ng/mL) (). This means that only 11.42% of the parent compound (diazepam) was found in the supernatant (from t = 0), and 24.79% was in the matrix. The metabolized remaining portions are shown in . As the length of exposure of the substance increased, the measured amount of the parent compound decreased and metabolism increased. Thus, the decrease in the measured level is analogous to the metabolism of the respective metabolites.
Figure 5 Time course and concentration in the matrix and in the supernatant of primary human hepatocytes of (A) diazepam; (B) desmethyldiazepam; (C) temazepam metabolites; and (D) oxazepam metabolites.
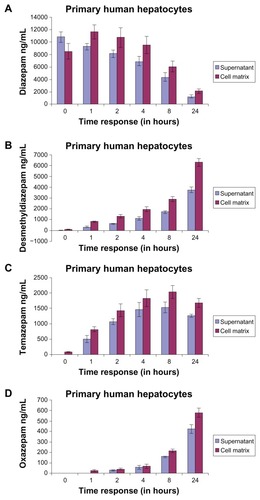
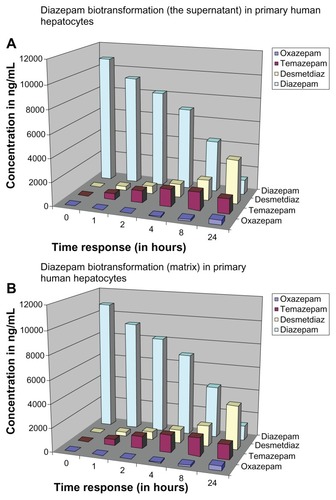
Figure 6 Representation of diazepam metabolism status at different exposure time points in primary human hepatocytes in (A) the supernatant, and (B) the matrix.
Desmethyldiazepam
The concentration of desmethyldiazepam, a major metabolite of diazepam, is shown in . In the matrix, the metabolite concentrations were higher than in the supernatant (supernatant: 3732.66 ± 259.28 ng/mL; matrix: 6284.33 ± 346.02 ng/mL; difference: 2551.67 ng/mL) after 24 hours of exposure. Like diazepam, the concentration of desmethyldiazepam in the supernatant and matrix () reflected a similar pattern during the exposure period. The diazepam was mainly metabolized by the cytochrome P450-dependent monooxygenase system, the 3A4 gene family. The activity of these monooxygenases is different and dependent on time. We found a very low nanoconcentration (89.66 ± 12.34 ng/mL) of desmethyldiazepam in the supernatant and in the matrix at 24 hours.
Temazepam
Temazepam is also one of the major metabolites of diazepam. The metabolism of diazepam to temazepam is lower compared to desmethyldiazepam. The highest concentration of desmethyldiazepam occurred at 24 hours, at a value of 3732.66 ng/mL in the supernatant and 6284.33 ± 259.28 ng/mL in the matrix. However, the highest value of temazepam was 1531.33 ± 171.19 ng/mL in the supernatant and 2031.66 ng/mL in the matrix ± 205.43 ng/mL, at 8 hours. Comparing these two values, the metabolism of diazepam to desmethyldiazepam is at least twice as high as that of diazepam to temazepam. Temazepam was hardly measurable in the supernatant, but we found low nanolevels (80.66 ± 20.03 ng/mL) in the matrix at t = 0. The formation of desmethyldiazepam and temazepam during the exposure period exhibited different patterns. The graph of temazepam is curved, while the graph of desmethyldiazepam is tangential. After an exposure time of 24 hours, the concentration of desmethyldiazepam (supernatant: 625 ± 67.55 ng/mL; matrix: 1315 ± 165.54 ng/mL), compared with the 24-hour value (), was 16.74% in the supernatant and 20.93% in the matrix. On the other hand, the concentration of temazepam (at 2 hours: 1059.33 ± 106.37 ng/mL in supernatant; 1431.33 ± 206.08 ng/mL in matrix) was 69.18% in the supernatant and 70.45% in the matrix at 8 hours. The observed concentrations of these two metabolites were completely different.
Oxazepam
Oxazepam is another metabolite of diazepam (). The time course of oxazepam exhibited a similar trend as that of desmethyldiazepam. However, the concentrations of oxazepam, in both the supernatant and in the matrix, were much lower than those of desmethyldiazepam and temazepam. After 24 hours, the value of oxazepam in the supernatant was lower than in the matrix (supernatant: 423.66 ± 42.25 ng/mL; matrix: 579.33 ± 43.43 ng/mL). We did not find any concentrations of oxazepam in the supernatant or in the matrix at t = 0. We observed nanolevels of oxazepam (23.33 ± 9.07 ng/mL) after an hour of oxazepam exposure. The concentration of oxazepam was higher in both the supernatant (510 ± 30.34 ng/mL) and the matrix (650 ± 54.9 ng/mL) at 24 hours. We concluded that the concentration of oxazepam was also higher inside the human hepatocyte cells than in the supernatant.
Overview of diazepam metabolism and its major metabolites in human hepatocytes
Metabolism of the parent drug diazepam and its metabolites during the 0–24 hour exposure time is shown for the supernatant (). The illustration presents a simplified overview of the concentration of individual metabolites and the temporal sequence in which they are formed in the supernatant. By contrast, the ratio of the individual metabolites and the parent compound to the total number (diazepam + metabolites) during the exposure period is shown in . The total sum of the individual time points is 100% in . After 24 hours, we found that the measured amount of diazepam only accounts for 18.61% ± 3.26% of the total number (diazepam + metabolites). Diazepam was metabolized within 24 hours of exposure time. Desmethyldiazepam accounted for 18.92% ± 0.75% of the total number, whereas oxazepam and temazepam accounted for 6.37% ± 0.64%.
The total concentration was plotted on the basis of the individual measurements at different exposure times in the matrix and in the supernatant. Thus, it was possible to distinguish between the first and the second hour of exposure time to form a steady state of the drug between the matrix and the supernatant. Through the formation of the flow balance, the difference between the matrix and the supernatant remained relatively the same in the following exposure times. After 24 hours of exposure, the concentration of diazepam was only 10.90% ± 2.03% in the matrix and 6.40% ± 1.12% in the supernatant (measured in total 17.30%) of diazepam. After a 24-hour exposure period, over 80% of diazepam from t = 0 was metabolized, which coincides with the in vivo half-life of diazepam (24–48 hours). Such a result confirms that our strategy may be the culture technique that mimics in vivo metabolism and, hence, can be used for the comparison of the metabolism.
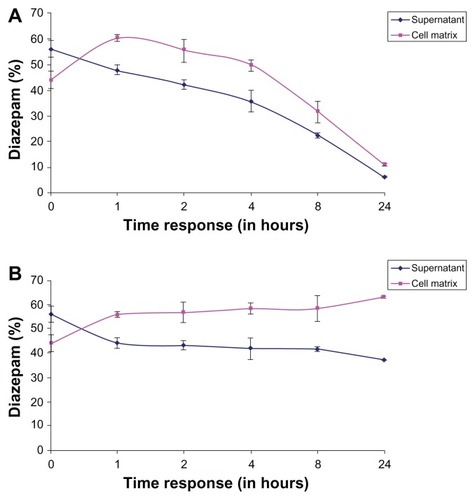
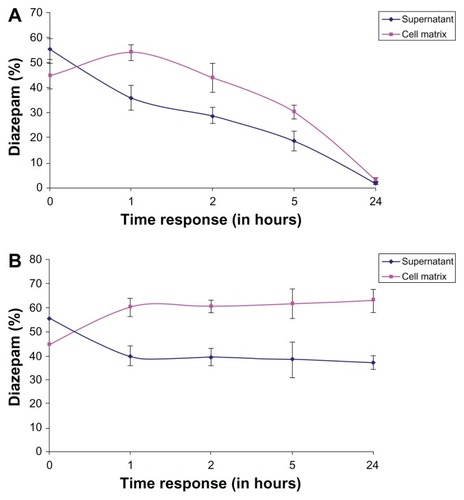
The percentage representation of diazepam in the matrix and the supernatant at different exposure times in relation to the sum of matrix + supernatant content in human hepatocytes is shown in . The value of the sum is given 100% and the individual values of each compartment are fractions of this sum. shows a steady state between the matrix and the supernatant between the first and second hour of exposure time. The ratio of the individual measurement to the sum of the respective timing remained constant during the exposure period. The chart also indicates that a higher quantity of the drug remained inside the matrix of human hepatocytes.
Figure 7 (A) Percentage representation of diazepam in the matrix and the supernatant at different exposure times in relation to the sum of matrix + supernatant content in the human hepatocytes. (B) Percentage representation of diazepam in the matrix and the supernatant at different exposure times in relation to the sum of matrix + supernatant content in the porcine hepatocytes.
Two-compartment strategy for biotransformation of diazepam and quantification of its metabolites in an organotypic cellular model of primary porcine hepatocytes
Diazepam
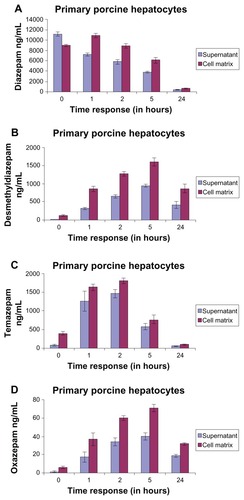
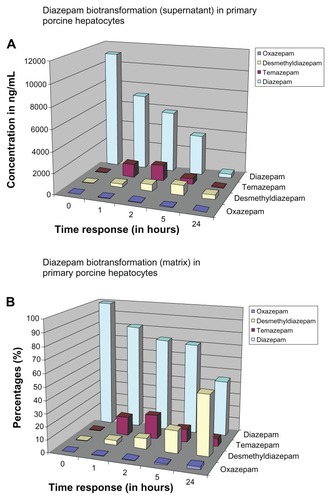
The time course of diazepam (parent compound) in the matrix and in the supernatant in porcine hepatocytes is shown in . Analogous to the human hepatocytes (; ), at t = 0, the diazepam concentration in the supernatant was higher than in the matrix (supernatant: 11,145.33 ± 384.39 ng/mL; matrix: 8965 ± 226.03 ng/mL; difference: 2180.33 ng/mL). However, the amount of diazepam was higher in the matrix compartment than in the supernatant at 1 hour and thereafter. The ratio of diazepam concentration in the matrix to the respective time of the supernatant remained the same over the exposure time at 1 hour (). We noticed an initial diazepam concentration of 11,145.33 ± 384.39 ng/mL, and after 24 hours, we observed a concentration of 383 ± 82.42 ng/mL. Thus, after a 24-hour exposure time, we measured only 3.44% of the parent compound in the supernatant. The same process occurred in the matrix (at t = 0: matrix: 8965 ± 226.03 ng/mL; after 24 hours: 130.39 ± 645 ng/mL). We measured 5.12% by adding the respective values of the matrix and the supernatant together (at t = 0: 20,110.33 ng/mL; at 24 hours: 1028.67 ng/mL). This means that 94.88% of the parent compound was further metabolized (). Therefore, it follows that as the length of exposure of the substance increases, the measured amount of parent compound decreases and metabolism increases.
Figure 8 Time course and concentration of diazepam in the matrix and in the supernatant of (A) primary porcine hepatocytes; (B) desmethyldiazepam metabolites; (C) temazepam metabolites; and (D) diazepam oxazepam.
Desmethyldiazepam
The concentrations of desmethyldiazepam in the supernatant and the matrix are shown in . We observed that the distribution behavior of desmethyldiazepam is similar to its parent compound, diazepam (). The measured quantity of metabolites in the matrix was consistently higher during the entire exposure time than in the supernatant. In contrast to the matrix, there was almost no detectable desmethyldiazepam in the supernatant (supernatant: 13.67 ± 1.53 ng/mL; matrix: 126 ± 27.73 ng/mL) at t = 0. The concentration of desmethyldiazepam increased during the exposure period, both in the supernatant and in the matrix, so that the maximum value was reached after 5 hours of exposure (supernatant: 936.67 ± 40.45 ng/mL; matrix: 1595 ± 109.53 ng/mL; difference: 658.33 ng/mL).
Temazepam
As mentioned previously, temazepam in also one of the major metabolites of diazepam; its metabolite profile is presented in . The concentration of temazepam was highest at 2 hours of exposure time and decreased at 5 hours and 24 hours in the matrix and the supernatant, respectively. At t = 0, there was only a trace amount of temazepam measured in the supernatant (72 ± 17.09 ng/mL). The same measurement in the matrix resulted in a 5.5-fold higher value (396 ± 52.26 ng/mL) compared to the supernatant. The highest values (supernatant: 1460.33 ± 104.19 ng/mL; matrix: 1805.33 ± 77.00 ng/mL) occurred at t = 2 hours.
Oxazepam
We also calculated the metabolism of oxazepam, a Phase II metabolite of diazepam (). The results were similar to the time course shown by desmethyldiazepam. The content of oxazepam, both in the supernatant and in the matrix, was significantly lower than that of desmethyldiazepam and temazepam. The highest value of oxazepam was reached after 5 hours of exposure time (supernatant 39.67 ± 3.79 ng/mL and in the matrix 70.67 ± 4.04 ng/mL) and fell off again thereafter, such that, after 24 hours, we observed 18.67 ± 1.53 ng/mL in the supernatant and 31.33 ± 1.53 ng/mL in the matrix. Comparing the levels of desmethyldiazepam and oxazepam, the value of oxazepam in the supernatant was only 4.23%, whereas the value of desmethyldiazepam was 4.43%. Oxazepam exhibited a similar pattern to that of the temazepam metabolites. Here, the value of temazepam was only 2.72% in the supernatant and 3.91% in the matrix. The metabolism of diazepam to oxazepam started later than in the previous two metabolites (desmethyldiazepam and temazepam). At t = 0, the concentration of oxazepam was hardly measurable in both the supernatant and in the matrix (supernatant 1 ± 1 ng/mL and in the matrix 6 ± 1 ng/mL). We observed trace levels of metabolite after 1 hour of exposure (supernatant: 17.33 ± 5.77 ng/mL; matrix: 36.33 ± 7.02 ng/mL).
Overview of diazepam metabolism and its major metabolites in porcine hepatocytes
shows a summary of the temporal course of diazepam metabolism in the supernatant. After 24 hours of exposure, we measured diazepam concentration and found only 383 ± 82.42 ng/mL. This was 3.44% of the initial compound at t = 0 of the 100% value. Consequently, almost 96.56% of diazepam had been metabolized within a 24-hour period. In contrast, shows the relationship of the individual metabolites and the parent compound in the total amount and in the supernatant, focussing on the corresponding metabolites at different time points. The amount of parent compound (diazepam) decreased during the exposure time. Desmethyldiazepam had the highest proportion, because the further degradation of this metabolite is slower than the other metabolites and diazepam. However, when the 2-hour values are analyzed, temazepam (18.42% ± 1.31%) exhibited the highest proportion of metabolites compared to desmethyldiazepam (8.16% ± 0.61%) and oxazepam (0.42% ± 0.05%).
Figure 9 Representation of diazepam metabolism status at different exposure time points in primary porcine hepatocytes in (A) the supernatant and (B) the matrix.
At t = 0, we observed a diazepam content of 20,110.33 ± 444.69 ng/mL in the supernatant. The total concentration was plotted as a reference quantity to the individual measurements at different exposure times in the matrix and in the supernatant. The above sum is equal to 100% and the individual values of the different exposure times, hereby set in proportion. We found that between the first and second hours of exposure time, a steady state of the drug formed between the matrix and the supernatant. Through the formation of the metabolism flow balance, the relative difference between the matrix and the supernatant remained the same until 5 hours. After 24 hours of exposure, we found very low concentrations of diazepam in both the matrix and in the supernatant. The majority of diazepam was metabolized completely over a 24-hour exposure time.
The sums of diazepam concentration percentages (matrix + supernatant) are plotted against the respective exposure times as a reference value for the individual values in the matrix and in the supernatant (). The values of each point in time are separately set as the supernatant and matrix, with the sum of the matrix and the supernatant in percentage and proportion. The sum is given as 100% and a share of the individual values of each compartment, and in comparison, charged as a percentage. Between the first and second hour of exposure time, a steady state between the matrix and the supernatant formed. Furthermore, the ratio of the sum of the individual measurements of each point in time during the exposure time remained constant. The ratio of matrix to supernatant at each measurement time remained about the same. The cessation of the flow balance for a higher quantity of the drug was measured in the matrix.
Figure 10 (A) Percentage representation of diazepam in the matrix and the supernatant at different exposure times in relation to the sum of matrix + supernatant content in the human hepatocytes. (B) Percentage representation of diazepam in the matrix and the supernatant at different exposure times in relation to the sum of matrix + supernatant content in the porcine hepatocytes.
Comparison of the temporal expression of diazepam metabolism of primary human hepatocytes and porcine hepatocytes
Diazepam
A number of differences are evident in a comparison of diazepam metabolite profiles ( and ) between human and pig hepatocytes. The trajectories of the graphs are similar, and diazepam increases continuously during the exposure period. However, there is a significant difference in the proportion of diazepam in human hepatocytes in both the supernatant and in the matrix at 24 hours of exposure time, which is not reduced in comparison to porcine hepatocytes. At t = 0, the percentage of diazepam was 11.42% in the supernatant and 24.79% in the matrix. By contrast, the measured percentage of diazepam in porcine hepatocytes was 3.44% in the supernatant and 7.20% in the matrix. Adding the supernatant and matrix value from t = 0 (19348.33 ± 1723.38 ng/mL) of human hepatocytes and comparing it with the sum at t = 24 hours (3347.67 ± 608.52 ng/mL, supernatant + matrix), we found 17.3% of initial value of diazepam. The same process results in a value of 5.08% for the pig hepatocytes. When the two totals (3347.67 ng/mL human and pig 1028.67 ng/mL) are compared at t = 24 hours, the mean is 3.25 times higher in human hepatocytes than in pig hepatocytes. Thus, it appears that human hepatocytes require a longer time than pig hepatocytes do, and that the corresponding cytochromes in humans work at a slower rate.
Desmethyldiazepam
Comparing the desmethyldiazepam diagrams of human and porcine hepatocytes ( and ) revealed that the time course of the performance is qualitatively and quantitatively different. The reaction proceeded tangentially in humans, continuously rising to 24 hours of exposure time, with the maximum level at t = 24 hours. The course of the implementation of the pig has a similar growth as that of humans; however, it reached its highest value after t = 5 hours, after which it decreased. We analyzed and compared the values of desmethyldiazepam of both hepatocytes, and the t = 24 hour values of the human hepatocytes (supernatant: 3732.67 ± 259.28 ng/mL; matrix: 6284.33 ± 346.02 ng/mL) were significantly higher than those of the pig hepatocytes (supernatant: 412 ± 95.28 ng/mL; matrix: 861.67 ± 115.70 ng/mL). Thus, the value of desmethyldiazepam in human hepatocytes was 7.86 times higher than that of the pig.
Temazepam
The time course and the increase of temazepam are similar to desmethyldiazepam. The increase of temazepam is similar to desmethyldiazepam, but with two differences. First, temazepam had peak values at t = 2 hours after dosing exposure time, whereas desmethyldiazepam peaked after t = 5 hours. Secondly, the temazepam values fall off more rapidly. Comparing the temazepam graphs of human and pig, qualitative and quantitative differences are evident ( and ). Temazepam reaches peak values in human hepatocytes after 8 hours of incubation. When the t = 24 hour values are compared with each other, it is clear that the human hepatocytes (supernatant: 1258.67 ± 49.66 ng/mL; matrix: 1669.67 ± 143.79 ng/mL) had a significantly higher value than the porcine hepatocytes (supernatant: 50.67 ± 7:23 ng/mL; matrix: 89.67 ± 22.74 ng/mL). The human hepatocytes showed a 20.87-fold higher temazepam concentration compared to those of the pig. If the two limits (t = 8 hour, supernatant human hepatocytes: 1531.33 ± 171.19 ng/mL, matrix: 2031.67 ± 205.43 ng/mL; supernatant porcine hepatocytes, t = 2 hour value: 1460.33 ± 104.19 ng/mL; matrix: 1805.33 ± 77.00 ng/mL) are compared with each other, there is no significant difference in the quantity of the metabolite.
Oxazepam
When considering the oxazepam graphs ( and ), the time courses in the human and porcine hepatocytes are analogous to those of desmethyldiazepam. However, there is a difference in their measurement height, as oxazepam content was much lower than that of desmethyldiazepam ( and ). When analyzing the values of human and pig together, the highest value of the oxazepam in humans occurs after t = 24 hours and in pigs after t = 5 hours. The oxazepam values of human hepatocytes were much higher (supernatant: 423.67 ± 42.25 ng/mL; matrix: 579.33 ± 43.43 ng/mL) than those of the pig (supernatant: 18.67 ± 1.53 ng/mL; matrix: 31.33 ± 1.53 ng/mL) at t = 24 hours. Oxazepam was 20.06 times higher in human hepatocytes than in porcine hepatocytes.
Discussion
The quantification of metabolites during drug biotransformation is one of the most significant parameters of preclinical screening tests for the registration of new drug candidates.Citation12,Citation13 Evaluation of metabolites in human plasma at an early stage of drug development is routine, but there is a critical lack of information on metabolite concentrations remaining inside the hepatocytes. The present study provides suggestions that quantification of a drug and its metabolites should be undertaken both inside and outside of the hepatocytes before large-scale clinical trials. Early identification of complete drug metabolite profiles (metabolite detection in two stages: cell matrix phase and supernatant) can deliver clear justifications for nonclinical testing, as well as clinical studies. The notion of a two-compartment model may rapidly provide adequate results before beginning a large-scale clinical trial, thereby reducing the time and money invested during various stages of drug development. By using this organotypic cellular in vitro model of primary hepatocytes (human and pig), one can quickly identify the metabolite concentrations of drug candidates at different stages of the drug development process. We believe that these types of in vitro metabolism studies should be conducted before initiation of clinical trials. Generally, in vivo metabolism studies of humans have been performed in the relatively late stages of clinical trials of drug development; however, we strongly recommend using the two-compartment organotypic models to mimic the in vivo metabolic evaluation in humans, with special reference to metabolite detection inside and out of the hepatocytes cells (). These two-compartment organotypic models may confirm a variety of in vivo outcomes in a short amount of time, which is essential to the early stages of the drug development process.
During drug discovery, it is imperative to monitor the complete dynamic profile of the parent compound and its metabolites in relevant in vitro and in vivo systems. It is critically important to recognize and quantify the metabolites in both the cell and the supernatant phases and to evaluate them properly in the in vivo system later. These types of rapid screening strategies may yield necessary information regarding the complete dynamic profile of both major and minor metabolites, which may provide indications of the efficacy and safety of the drug candidate. Accumulated metabolites can bind covalently with cellular macromolecules and may cause organ or cellular toxicity sooner or later. There is a lack of publications regarding metabolite toxicity inside the cell, as accumulated metabolites may be involved in clinically adverse events, including idiosyncratic drug toxicities. The covalent binding by reactive drug metabolites is a poorly understood cause of cellular toxicity. Currently, the covalent binding of metabolites has been monitored by using radioactive drugs, which have limited applicability in drug discovery. Several marketed drugs are known to form reactive metabolites and have been shown to bind covalently to proteins, demonstrating a greater risk of adverse reactions, by themselves or with other medications. The quantification of drug metabolites is a long-standing issue for drug development. However, questions regarding the importance of accumulated metabolites still remain.
Generally, toxicology research is more often focused on the analysis of drug metabolites in the supernatant in experimental in vitro models and in the serum in in vivo, either in preclinical or animal models, without knowing the persistence of the drug metabolites in liver tissue in vivo and the matrix phase in vitro. Our experimental approach for detecting drug metabolites is based on the simple and quick methodologies of the two-compartment model. It is important to quantify the complete profiles of all metabolites and their potential to interact with other medications and bind with hepatic biomolecules noncovalently or covalently. Diazepam is a compound that the liver should clear; however, in our previous studies, we detected diazepam metabolites in the cell matrix phase,Citation45 suggesting that, under some conditions, diazepam may not be cleared by the liver. Protein covalent binding by reactive metabolites of drugs can lead to acute or chronic hepatotoxicity. In many cases, reactive metabolites are also associated with idiosyncratic liver injury.Citation18,Citation28,Citation46,Citation47 However, on the basis of the possible correlation between reactive metabolites and idiosyncratic drug reactions, formation of a large amount of reactive metabolites is regarded as a significant liability for a drug candidate in the preclinical stages. Increased attention is needed to improve our ability to predict whether metabolites remain inside the hepatocyte during the initial drug screening process, which provides valuable information for the clinical trials of drug candidates. It is widely acknowledged that nonspecific covalent binding should be avoided or minimized when optimizing drug properties during the lead optimization stage of drug discovery. To the best of our knowledge, no such two-compartment strategy has been used in the pharmaceutical industry to monitor the metabolites inside hepatocytes in an in vitro model. To improve the drug discovery process, we believe that this two-compartment organotypic cellular model will yield valuable information about the safety profile of drug metabolites inside and outside of hepatocytes, which marks an important milestone in drug development.
Disclosure
The authors report no conflicts of interest in this work.
References
- PaulSMMytelkaDSDunwiddieCTHow to improve R&D productivity: the pharmaceutical industry’s grand challengeNat Rev Drug Discov20109320321420168317
- DiMasiJAHansenRWGrabowskiHGThe price of innovation: new estimates of drug development costsJ Health Econ200322215118512606142
- http://www.fda.gov [homepage on the Internet]Innovation or stagnation: challenge and opportunity on the critical path to new medical productsSilver Spring, MDUS Food and Drug Administration2004 [updated October 20, 2010]. Available from: http://www.fda.gov/ScienceResearch/SpecialTopics/CriticalPathInitiative/CriticalPathOpportunitiesReports/ucm077262.htmAccessed May 10, 2011
- HoldenADetecting and investigating drug induced adverse events: the International Serious Adverse Event Consortium’s experienceProceedings of the FDA/CDER/PhRMA/AASLD MeetingMarch 27, 2008 Available from: http://www.fda.gov/downloads/Drugs/Science Research/Research-Areas/ucm077482.pdfAccessed October 17, 2008
- GaleEALessons from the glitazones: a story of drug developmentLancet200135792711870187511410214
- Strengthening pharmacovigilance to reduce adverse effects of medicines [Memo]BrusselsEuropean Commission2008 Available from: http://ec.europa.eu/health/files/pharmacos/pharmpack_12_2008/memo_pharmacovigiliance_december_2008_en.pdfAccessed May 10, 2011
- MakarovaSIHuman N-acetyltransferases and drug-induced hepatotoxicityCurr Drug Metab20089653854518680474
- HughesBIndustry concern over EU hepatotoxicity guidanceNat Rev Drug Discov20087971919172685
- FrederickCBObachRSMetabolites in safety testing: “MIST” for the clinical pharmacologistClinical Pharmacol Ther201087334535020107437
- SmithDAObachRSMetabolites and safety: What are the concerns, and how should we address them?Chem Res Toxicol200619121570157917173370
- FuraARole of pharmacologically active metabolites in drug discovery and developmentDrug Discov Today2006113–413314216533711
- GiriSBaderAImproved preclinical safety assessment using micro-BAL devices: the potential impact on human discovery and drug attritionDrug Discov Today2011169–1038239721354326
- GiriSNieberKBaderAHepatotoxicity and hepatic metabolism of available drugs: current problems and possible solutions in preclinical stagesExpert Opin Drug Metab Toxicol20106889591720367107
- LeungLKalgutkarASObachRSMetabolic activation in drug-induced liver injuryDrug Metab Rev2012441183321939431
- EmotoCMurayamaNRostami-HodjeganAYamazakiHMethodologies for investigating drug metabolism at the early drug discovery stage: prediction of hepatic drug clearance and P450 contributionCurr Drug Metab201011867868520973757
- BaillieTACayenMNFoudaHDrug metabolites in safety testingToxicol Appl Pharmacol2002182318819612229863
- PowleyMWFrederickCBSistareFDDeGeorgeJJSafety assessment of drug metabolites: implications of regulatory guidance and potential application of genetically engineered mouse models that express human P450sChem Res Toxicol200922225726219170595
- SmithDAObachRSMetabolites in safety testing (MIST): considerations of mechanisms of toxicity with dose, abundance, and duration of treatmentChem Res Toxicol200922226727919166333
- NeddermanANMetabolites in safety testing: metabolite identification strategies in discovery and developmentBiopharm Drug Dispos200930415316219544286
- VishwanathanKBabalolaKWangJObtaining exposures of metabolites in preclinical species through plasma pooling and quantitative NMR: addressing metabolites in safety testing (MIST) guidance without using radiolabeled compounds and chemically synthesized metabolite standardsChem Res Toxicol200922231132219067650
- NaitoSFurutaSYoshidaTCurrent opinion: safety evaluation of drug metabolites in development of pharmaceuticalsJ Toxicol Sci200732432934117965548
- US Food and Drug AdministrationGuidance for Industry: Safety Testing of Drug MetabolitesDraft GuidanceRockville, MDUS Food and Drug Administration, Center for Drug Evaluation and Research (CDER)2006
- US Food and Drug AdministrationGuidance for Industry: Safety Testing of Drug MetabolitesRockville, MDUS Food and Drug Administration, Center for Drug Evaluation and Research (CDER)2008
- PrueksaritanontTLinJHBaillieTAComplicating factors in safety testing of drug metabolites: kinetic differences between generated and preformed metabolitesToxicol Appl Pharmacol2006217214315217055014
- SmithDAObachRSSeeing through the mist: abundance versus percentage. Commentary on metabolites in safety testingDrug Metab Dispos200533101409141715985503
- AtrakchiAHInterpretation and considerations on the safety evaluation of human drug metabolitesChem Res Toxicol20092271217122019563206
- BaillieTAApproaches to the assessment of stable and chemically reactive drug metabolites in early clinical trialsChem Res Toxicol200922226326619216579
- LeclercqLCuyckensFMannensGSde VriesRTimmermanPEvansDCWhich human metabolites have we MIST? Retrospective analysis, practical aspects, and perspectives for metabolite identification and quantification in pharmaceutical developmentChem Res Toxicol200922228029319183054
- Davis-BrunoKLAtrakchiAA regulatory perspective on issues and approaches in characterizing human metabolitesChem Res Toxicol200619121561156317173368
- HumphreysWGUngerSESafety assessment of drug metabolites: Characterization of chemically stable metabolitesChem Res Toxicol200619121564156917173369
- ParkBKBoobisAClarkeSManaging the challenge of chemically reactive metabolites in drug developmentNat Rev Drug Discov201110429230621455238
- LangschAGiriSAcikgozAJasmundIFrericksBBaderAInterspecies difference in liver-specific functions and biotransformation of testosterone of primary rat, porcine and human hepatocyte in an organotypical sandwich cultureToxicol Lett2009188317317919428196
- WatanabeASakaiTSatoSClinical efficacy of lactulose in cirrhotic patients with and without subclinical hepatic encephalopathyHepatology1997266141014149397979
- MakiTMonacoAPPorcine islet xenotransplantation utilizing a vascularized bioartificial pancreasAnn Transplant19972369719869867
- DinsmoreJHManhartCRaineriRJacobyDBMooreANo evidence for infection of human cells with porcine endogenous retrovirus (PERV) after exposure to porcine fetal neuronal cellsTransplantation20007091382138911087157
- BaderAKnopEKernA3-D coculture of hepatic sinusoidal cells with primary hepatocytes-design of an organotypical modelExp Cell Res199622612232338660959
- BaderAZechKCromeOUse of organotypical cultures of primary hepatocytes to analyse drug biotransformation in man and animalsXenobiotica19942476236337975727
- KernABaderAPichlmayrRSewingKFDrug metabolism in hepatocyte sandwich cultures of rats and humansBiochem Pharmacol19975477617729353130
- SidhuJSLiuFOmiecinskiCJPhenobarbital responsiveness as a uniquely sensitive indicator of hepatocyte differentiation status: requirement of dexamethasone and extracellular matrix in establishing the functional integrity of cultured primary rat hepatocytesExp Cell Res2004292225226414697333
- MaringkaMGiriSNieberKAcikgozABaderABiotransformation of diazepam in a clinically relevant flat membrane bioreactor model using primary porcine hepatocytesFundam Clin Pharmacol201125334335320618872
- MaringkaMGiriSBaderAPreclinical characterization of primary porcine hepatocytes in a clinically relevant flat membrane bioreactorBiomaterials201031115617219818493
- SeglenPOPreparation of isolated rat liver cellsMethods Cell Biol1976132983177845
- HoogenboomLAPastoorFJClousWEHesseSEKuiperHAThe use of porcine hepatocytes for biotransformation studies of veterinary drugsXenobiotica19891911120712192618075
- ElsdaleTBardJCollagen substrata for studies on cell behaviorJ Cell Biol19725436266374339818
- AcikgozAKarimNGiriSSchmidt-HeckWBaderATwo compartment model of diazepam biotransformation in an organotypical culture of primary human hepatocytesToxicol Appl Pharmacol2009234217919118983865
- ThompsonRAIsinEMLiYRisk assessment and mitigation strategies for reactive metabolites in drug discovery and developmentChem Biol Interact20111921–2657121074519
- TujiosSFontanaRJMechanisms of drug-induced liver injury: from bedside to benchNat Rev Gastroenterol Hepatol20118420221121386809