Abstract
Objective
To investigate the cellular uptake of evodiamine and rutaecarpine in a microemulsion in comparison with aqueous suspensions and tinctures.
Materials and methods
A microemulsion was prepared using the dropwise addition method. Mouse skin fibroblasts were cultured in vitro to investigate the optimal conditions for evodiamine and rutaecarpine uptake with different drug concentrations and administration times. Under optimal conditions, the cellular uptake of microemulsified drugs was assayed and compared to tinctures and aqueous suspensions. Rhodamine B labeling and laser scanning confocal microscopy (LSCM) were used to explore the distribution of fluorochrome transferred with the microemulsion in fibroblasts. Cellular morphology was also investigated, using optical microscopy to evaluate microemulsion-induced cellular toxicity.
Results
The maximum cellular drug uptake amounts were obtained with a 20% concentration (v/v) of microemulsion and an 8 hour administration time. Drug uptake by mouse skin fibroblasts was lowest when the drugs were loaded in microemulsion. After incubation with rhodamine B-labeled microemulsion for 8 hours, the highest fluorescence intensity was achieved, and the fluorochrome was primarily distributed in the cytochylema. No obvious cellular morphologic changes were observed with the administration of either the microemulsion or the aqueous suspension; for the tincture group, however, massive cellular necrocytosis was observed.
Conclusion
The lower cellular uptake with microemulsion may be due to the fact that most of the drug loaded in the microemulsion vehicle was transported via the intercellular space, while a small quantity of free drug (released from the vehicle) was ingested through transmembrane transport. Mouse skin fibroblasts rarely endocytosed evodiamine and rutaecarpine with a microemulsion as the vehicle. The microemulsion had no obvious effect on cellular morphology, suggesting there is little or no cellular toxicity associated with the administration of microemulsion on mouse skin fibroblasts.
Introduction
Evodiamine (Evo) and rutaecarpine (Rut) are important bioactive alkaloids isolated from the Chinese medicinal herb Evodia rutaecarpa (Juss.) Benth.Citation1–Citation3 Evo and Rut have been reported to exhibit anti-inflammatoryCitation4 and anti-nociceptiveCitation5 effects. Both Evo and Rut have been found to strongly inhibit prostaglandin E2 synthesis from lipopolysaccharide-treated RAW 264.7 cells, and Evo has also been shown to inhibit cyclooxygenase-2 induction and NF-κB activation.Citation6–Citation9 However, these alkaloids are insoluble in water, which limits their transdermal absorption. In order to address this problem, an oil-in-water (o/w) microemulsion was designed as a vehicle to increase the solubility of these compounds. The application of this novel microemulsion could markedly improve the transdermal absorption of Evo and Rut compared to that obtained using aqueous suspensions and tinctures.Citation10
Microemulsions have received increasing attention in recent years. A microemulsion is defined as a dispersion consisting of oil, surfactant, cosurfactant, and an aqueous phase, which is an optically isotropic and thermodynamically stable liquid solution with a droplet diameter of 10–100 nm, and it can therefore serve as an effective nanomedicine vehicle.Citation11 Microemulsion systems have several advantages over conventional formulations, such as ease of manufacturing, increased drug solubility, good thermodynamic stability, and enhanced drug permeation.Citation12 Microemulsions provide a promising delivery system for either sustained or controlled drug release through transdermal administration,Citation10 and these novel transdermal delivery systems have attained increasing significance in basic research. For example, microemulsions may affect the stratum corneum (SC) layer of the skin, leading to increased fluidity of the bilayer, as well as interruption of the aqueous channels in the SC. These effects may result in the enhanced transdermal permeation of drugs.Citation13–Citation15 However, very few studies have been performed on the transport mechanism underlying microemulsion permeation through the SC into the dermis.
In animal tissue, fibroblasts are the most common cells in connective tissue.Citation16 Dermal fibroblasts have been used extensively for a wide range of cellular and molecular studies,Citation17 such as those on the mechanisms underlying skin aging,Citation18–Citation20 restoration of dermal wounds,Citation21 dermal radiation injury,Citation22 and construction of tissue-engineered skins.Citation23–Citation25
The purpose of this study was to investigate the cellular uptake of evodiamine and rutaecarpine in a microemulsion, as compared to that in aqueous suspensions and tinctures. Mouse skin fibroblasts were cultured in vitro and the amount of cellular uptake was measured using different concentrations, different drug administration times, and different formulations (ie, microemulsion, tincture, and suspension). These results may aid in determining the fate of microemulsions during dermal penetration.
Materials and methods
Cell line
Mouse skin fibroblasts (NIH/3T3) were purchased from the Shanghai institute of biochemistry and cell biology (Shanghai, China).
Materials
Evo and Rut (98% purity, as determined by high-performance liquid chromatography [HPLC]) were provided by Linuo Biotechnology Co, Ltd (Zhengzhou, China). Ethyl oleate was purchased from Shanghai Yunhong Chemical Preparation Auxiliary Technology Co, Ltd (Shanghai, China). Polyethylene glycol PEG-35 castor oil (Cremophor® EL) was obtained from BASF (Ludwigshafen, Germany). Rhodamine B was obtained from Sigma-aldrich (St Louis, MO). High-glucose Dulbecco’s Modified Eagle’s Medium (DMEM/High, Fisher Scientific Worldwide [Shanghai] Co Ltd, Shanghai, China), 0.25% trypsin, 0.02% ethylenediaminetetraacetic acid (EDTA), fetal calf serum, and phosphate buffered solution (PBS) were obtained from Shanghai Usen Biotechnology (Shanghai, China). All other chemicals were obtained from Sinopharm Chemical Reagent Co Ltd (Shanghai, China) and were of HPLC or analytical grade.
HPLC analysis of Evo and Rut
The LC-2010 A HT Liquid Chromatograph system (Shimadzu Corporation, Kyoto, Japan) was used for the dialysate sample analysis to detect the presence of Evo and Rut and to determine their concentrations. The HPLC system consisted of a double-plunger pump (Shimadzu Corporation), an autosampler (Shimadzu Corporation), an online degasser (Shimadzu Corporation), a Diamonsil C18 reverse phase column (5 μm, 4.6 mm [inner diameter] × 25 cm; Dikma Technologies, Inc, Beijing, China), a column oven (Shimadzu Corporation), an ultraviolet detector (Hamamatsu Photonics, Hamamatsu, Japan), and a recording integrator (Shimadzu Corporation). The mobile phase was acetonitrile:water (43:57, v/v) containing 0.04% (w/v) sodium 1-octanesulfonate with a flow rate of 1 mL/minute. The column temperature was constant at 35°C and the detection wavelength was 225 nm.
Preparation of microemulsion
The microemulsion used in this study contained 0.1% (w/w) Evo and 0.1% (w/w) Rut and was prepared using Cremophor EL (33.8%, w/w) as the surfactant, PEG-400 (11.2%, w/w) as the cosurfactant, and ethyl oleate (5.0%, w/w) as the oil phase. Evo and Rut were added to the ethyl oleate and stirred until they completely dissolved. The solution was then added to the mixture of Cremophor EL and PEG-400 and then stirred. The mixture was placed on a magnetic stirrer (RCT B S25; IKA, Staufen, Germany), at 300 r/minute, and purified water (50%, w/w) was added dropwise. During this process, the appearance of the mixture turned from opaque to limpid, and the final preparation appeared opalescent-white when seen through light – an important feature of microemulsions.
Characterization of microemulsion
The average droplet size of the microemulsion was measured using the NanoSight LM seriesCitation26 (NanoSight Ltd, Amesbury, UK). The viscosity of the prepared microemulsions was measured using a DV-I + Digital Viscometer (Brookfield Engineering Laboratories Inc, Middleboro, MA), with the No 1 rotor set at 100 rpm. Both measurements were performed in triplicate, and the final values were expressed in terms of mean ± standard deviation. The appearance of the microemulsion was observed using a transmission electron microscope (Philips/FEI Tecnai 12, Amsterdam, The Netherlands). The sample was prepared with negative staining: the copper net was supported by Formvar film on a stencil plate, the microemulsion was dropped gently on the film, and the film was allowed to dry for approximately 20 minutes. A drop of 0.5% uranyl acetate was then added to the film and allowed to dry for 10 minutes. The sample was then observed and the image was captured.
Cell culture
The cell line was removed from storage in liquid nitrogen and placed in a 37°C water bath for 1 minute. Then, 10 mL of fresh culture medium (DMEM/High) was added to the culture dish with a transfer pipette and it was mixed uniformly. The culture dish was placed in a CO2 incubator (Forma 3111; Thermo Fisher Scientific, Walther, MA) for 24 hours (5% CO2, incubator at 37°C). Subsequently, the culture medium was extracted using a vacuum pump; 2 mL PBS was added to clean the dish and was then removed by the vacuum pump. Zymine solution (1 mL) was added and mixed, and the excess zymine solution was poured out. The cells in the dish were digested at 37°C for 3 minutes, until they floated, and 4 mL of culture medium was used to clean the cells. The cell suspension was distributed into a new culture dish and 8 mL of fresh culture medium was added for subcultivation. Cultures were maintained at 37°C under humidified conditions with 5% CO2. All procedures were performed on a super-clean bench (VCM-620; Dabao Instrument Company, Suzhou, China) and aseptic techniques were maintained.
Preparation of formulations for comparison
The aqueous suspension was prepared with pure water and the tincture with 70% (w/w) ethanol. The concentrations of Evo (0.1%, w/w) and Rut (0.1%, w/w) in the aqueous suspension and the tincture were identical to those in the microemulsion.
Cellular uptake of Evo and Rut in vitro
Mouse skin fibroblasts in the log phase were transferred to a six-well plate culture dish at 5 × 10⁵ cells/unit. An atmosphere of 5% CO2 was maintained for 12 hours at 37°C. The prepared formulations were injected into the holes, replacing equal volumes of culture fluid, at 37°C in an atmosphere of 5% CO2. After incubation, the culture fluid was removed and the holes were washed three times with 1 mL of PBS and 0.5 mL of normal saline. The cells were then carefully scraped and transferred into centrifuge tubes that were placed in an icewater bath for ultrasonication with a ultrasonic cell disruptor (JY99-IIDN; LifeScientz Bio-tech Co Ltd, Ningbo, China) at 900 w for 10 seconds. Acetic ether (200 μL) was then added and the mixture was shaken carefully, followed by extraction of the supernatant liquid. This process was performed in triplicate and the supernatant liquids were combined. The combined supernatant liquid was volatilized through nitrogen using a pressured gas-blowing concentrator (Shanghai Anpel Scientific Instrument Co Ltd, Shanghai, China) in a draught cupboard. After the liquid dried, 100 μL methanol was added to dissolve the components using a vortex mixer (XW-80A; Shanghai Jingke Scientific Instrument Co Ltd, Shanghai, China), vibrated for 5 minutes, and analyzed with HPLC after centrifugation (5452; Eppendorf AG, Hamburg, Germany) at 10,000 r/minute for 5 minutes.
Cellular uptake of fluorescence-labeled microemulsion
Evo and Rut were replaced with rhodamine B methanol solution (1.0 mg/mL:10.0 mg rhodamine B dissolved in 10 mL methanol), and the concentration of rhodamine B in the prepared microemulsion was 10 μg/mL. Some volume of culture medium in the glass culture dish (used for LSCM) was pipetted and replenished with an equal volume of rhodamine B-labeled microemulsion solution. The cells were then incubated in a CO2 incubator, with an atmosphere of 5% CO2 maintained for 8 hours at 37°C. The culture fluid was then removed and the culture dish was washed 3 times with 1 mL PBS. The cells were optically scanned at different increments through the z-axis of an LSCM (Tcs Sp2; Leica Microsystems, Wetzlar, Germany). Optical excitations were performed with a 554 nm argon laser beam and fluorescence emission was detected at 575 nm.Citation27
Results and discussion
Preparation and characterization of microemulsions
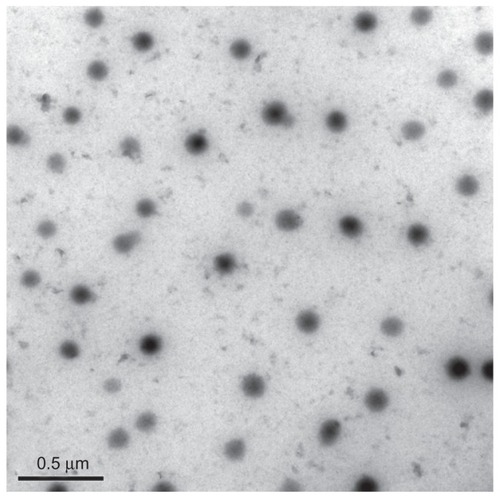
With the dropwise addition of water, the mixture underwent a phase transition from gel to microemulsion. The microemulsion was diluted to 1000 × (w/w) and the mean droplet size was 74 ± 7.07 nm, as measured by NanoSight (). The viscosity of the microemulsion was 37.65 ± 0.14 mPa · s. The microemulsion showed adequate fluidity, which ensured free movement of the nanoparticles in the microemulsion fluid. The droplets were spherical and remained separate when observed by transmission electron microscopy ().
Figure 1 Microemulsion droplet size measured by NanoSight (NanoSight Ltd, Amesbury, UK). (A) Droplet size and relative intensity. (B) Still frame of a video of microemulsion droplets.
Note: The droplets appear as bluish-green spots (taken using NanoSight).
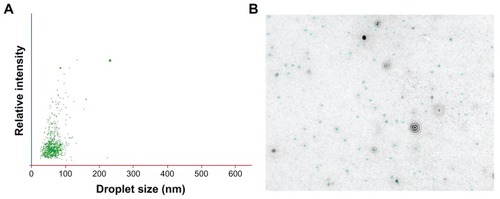
Figure 2 Transmission electron microscopy image of Evo- and Rut-loaded microemulsion (stained with uranyl acetate).
Cellular uptake of Evo and Rut in vitro
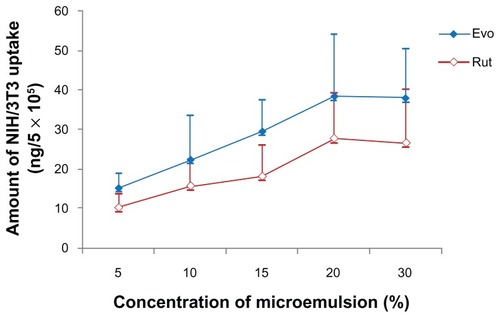
Five concentrations of microemulsion liquid (5%, 10%, 15%, 20%, and 30%; v/v) were evaluated in this study. The results showed that the amount of uptake increased with increases in the microemulsion concentration and began to taper after the microemulsion accounted for 20% of the culture fluid (). Within a concentration range of 5%–20%, the uptake amounts for Evo and Rut were dose dependent, indicating that cellular uptake may occur via passive transport. High microemulsion concentrations increased the concentration of the drugs in the culture fluid, but an excess of microemulsion components (eg, surfactant and cosurfactant) may hinder cellular uptake.
Figure 3 Effect of microemulsion concentration on the amount of Evo (blue) and Rut (red) uptake by mouse skin fibroblasts.
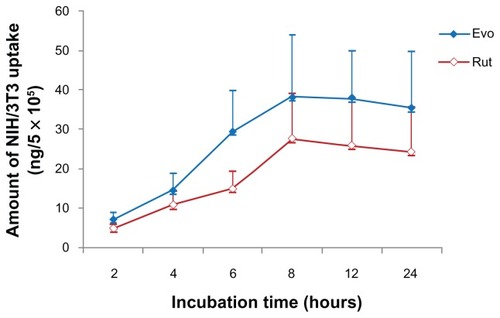
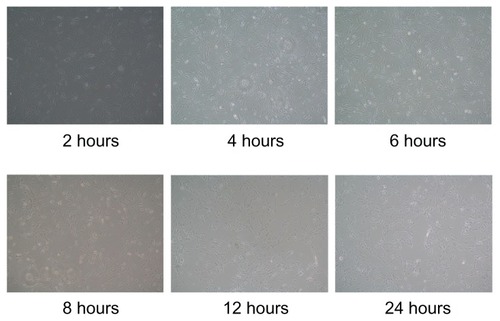
As a 20% microemulsion concentration represented uptake saturation, the effect of incubation time on the amount of cellular uptake was investigated at this concentration (). The amount of cellular uptake increased with the time from 2 to 8 hours of incubation. Uptake for both drugs reached a maximum at 8 hours, changed little until 12 hours, and then decreased slightly.
Figure 4 Effect of microemulsion incubation time on the amount of Evo and Rut uptake by mouse skin fibroblasts.
A tincture and an aqueous suspension were used as comparative formulations for further study. Under the same conditions (20% concentration of each formulation, 8 hour incubation time), the results () showed that the uptake amounts for the microemulsion were the smallest and those for the aqueous suspension were the largest. Evo and Rut are small molecules and highly lipid soluble. When dispersed in water, they are likely to be absorbed by cells. However, high amounts of alcohol in the tincture caused massive cellular necrocytosis, which resulted in a considerably lower drug uptake in this group, as compared with the aqueous suspension group. The mechanisms of nanoparticle-cell interaction are still not completely understood. dos Santos et al indicated that the internalization of (nano)particles was highly size dependent for all the cell lines studied, and that (nano)particle uptake may not follow the commonly defined size limits for uptake processes.Citation28 Their results highlight the variability of uptake kinetics for one material in different cell types.Citation28 In general, extracellular matrix proteins have a negative charge, and the particles with a positive charge can adhere to the cell membrane. On the contrary, particles with a positive charge may weaken the adhesivity of the cell.Citation29,Citation30 Other reportsCitation31,Citation32 have shown that nanoparticles have a positive surface charge that can attract and combine nonspecific static from the negative charges of glycoprotein, proteoglycan, and phospholipid on the cell surface, and that this effect depends on the quantity of positive charges on the surface of the nanoparticle and on the negatively charged macromolecules from the cytomembrane. For example, liposomes have a positive surface charge that can increase the affinity between nanoparticles and cells.Citation33–Citation35 The microemulsion with the zeta potential −1.02 ± 0.18 was expected to have a negative surface charge on the basis of the presented composition, which may have adversely affected the adhesivity of the cell, further decreasing cellular uptake. Research has also shown that the incubation temperature can influence the cellular uptake of nanoparticles, as the uptake efficiency at 37°C is higher than that at 4°C, which indicates that the uptake process is energy dependent.Citation36 The microemulsion used in this study consisted of droplets with an average size of 74 ± 7.07 nm, but the amount of cellular uptake was lower than that with the aqueous suspension. It is possible that a large distribution of droplet sizes hindered cellular uptake ().
Table 1 Size distribution and droplet concentration statistics of microemulsion by NanoSight
Figure 5 Effect of different formulations (A) microemulsion, (B) tincture, and (C) aqueous suspension, on the amount of Evo and Rut uptake by mouse skin fibroblasts.
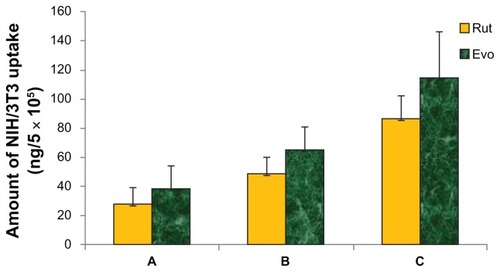
Previous studies have shown that microemulsions cause significantly enhanced Evo and Rut permeation through the skin, as compared to conventional preparations such as tincture and aqueous suspension.Citation10 However, in the current study, the in vitro uptake of Evo and Rut in mouse skin fibroblasts was smaller for the microemulsion than for the tincture and the aqueous suspension. These results suggest that most of the drugs loaded in a microemulsion are transported via intercellular spaces, while a small quantity of free drug may be released from the vehicle and ingested through transmembrane transport. In light of the results from previous in vivo studies,Citation10 a possible route of microemulsion-enhanced percutaneous absorption is as follows: the microemulsion increases the fluidity of the bilayer and interrupts the aqueous channels in the SC, leading to ingestion by cells in the SC; the accumulated microemulsion then creates a high drug-concentration gradient, which causes diffusion into the dermal intercellular spaces, thereby enhancing transdermal drug permeation.Citation37,Citation38
Influence of microemulsion on cellular appearance
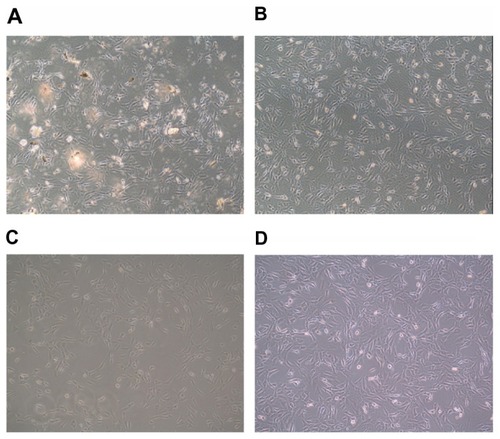
Various vehicles loaded with Evo and Rut affected cellular morphology (). For all formulations, a concentration of 20% and an incubation time of 8 hours were used. Compared to normal cells, cells incubated with microemulsion (whether or not the microemulsion was loaded with drugs; –) showed no obvious changes. In addition, no morphologic change was noted in cells incubated with the aqueous suspension (). The drugs (Evo and Rut) had no apparent effect on the cells at the dosage used, as shown by the similar cellular morphology seen in cells incubated with the microemulsion vehicle without drugs (–). However, cells incubated with the tincture shrank sharply and underwent necrocytosis (), as indicated by the amount of cellular debris observed floating in the culture fluid. This effect may have been due to the high alcohol content of the tincture.
Figure 6 Influence of incubation with different formulations: (A) tincture; (B) aqueous suspension; (C) microemulsion; and (D) microemulsion without Evo and Rut on cellular morphology.
In comparison with normal cellular morphology (), it was found that microemulsion administration did not lead to transformation of the cellular morphology. Furthermore, the cellular morphology did not obviously transform with an increase in the microemulsion concentration. Pharmaceutical adjuncts of the prepared microemulsion, such as PEG-400 (11.2%, w/w)Citation39 and Cremophor EL (33.8%, w/w), are used extensively in the pharmaceutical industry. Cremophor EL use has been reported, up to the 50% level, as a solubilizer in preparations of paclitaxel injections,Citation40 and when used in this study, no obvious transformation of cellular morphology was observed with an inverted microscope. Ethyl oleate is extensively used in topical medications and is designated by the US Food and Drug Administration as harmless, which is supported by the results of a 91-day feeding study in rats.Citation41 This evidence supports the finding that the microemulsion has little cellular toxicity.
Figure 7 Influence of microemulsion concentration on cellular morphology.
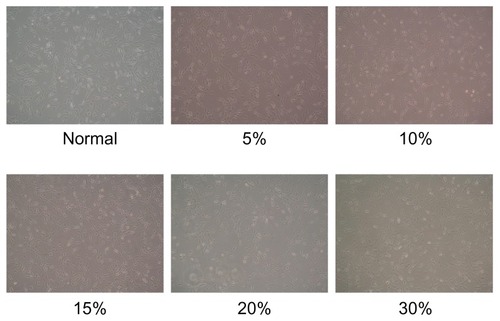
Figure 8 Influence of microemulsion incubation time on cellular morphology.
Cellular uptake of fluorescence-labeled microemulsion
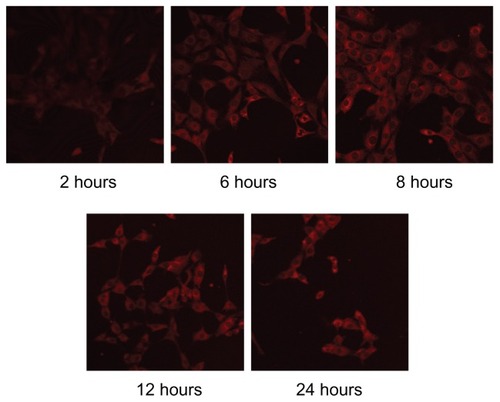
Using LSCM, orange fluorescence was observed in the cytoplasm of mouse skin fibroblasts, clearly showing that, after uptake, the fluorescein was distributed in the cytoplasm of these cells. The fluorescence increased with the microemulsion concentration, as well as with incubation time ( and , respectively). Interestingly, a variation in the amount of orange fluorescence was seen in accordance with the uptake amounts of Evo and Rut, as determined by HPLC.
Figure 9 LSCM images showing different concentrations of rhodamine B-labeled microemulsion incubated with mouse skin fibroblasts.
Abbreviation: LCSM, laser scanning confocal microscopy.
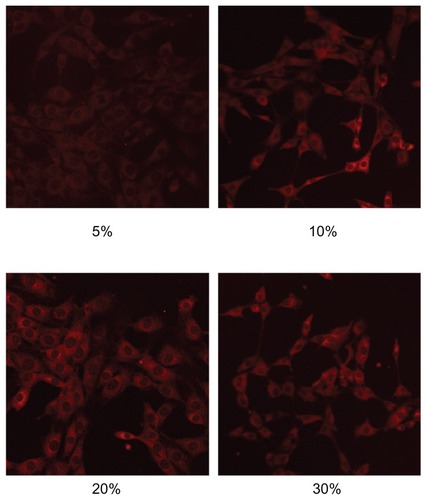
Figure 10 LSCM images showing mouse skin fibroblasts incubated with rhodamine B-labeled microemulsion for different incubation times.
Abbreviation: LCSM, laser scanning confocal microscopy.
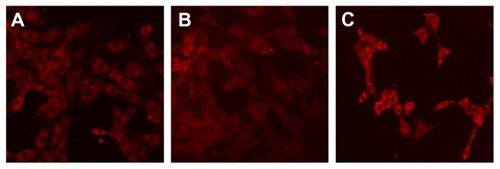
The fluorescence intensity of the microemulsion group was relatively lower than that of the tincture and aqueous suspension groups (), which may be related to the lowest uptake amount of rhodamine B with microemulsion as the vehicle. When the lipophilic rhodamine B was loaded in the microemulsion, it was difficult to release and, therefore, difficult for cells to ingest, while the free molecules of rhodamine B in the aqueous suspension were easily captured. Cells from the tincture group showed small, diffuse, and indistinct fluorescence, which may be due to the fact that the high alcohol content led to extensive cellular death and rupture, resulting in the leakage of fluorochrome out of the cells, staining the background.
Figure 11 LSCM images showing rhodamine B-labeled formulations (A) microemulsion; (B) tincture; and (C) aqueous suspension.
Abbreviation: LCSM, laser scanning confocal microscopy.
Conclusion
The amount of cellular uptake with microemulsion was relatively lower than with tincture and aqueous suspension, which may be due to the fact that most of the drug loaded in the microemulsion vehicle was transported via the intercellular space, while a small quantity of free drug (released from the vehicle) was ingested through transmembrane transport. The prepared microemulsion was harmless to mouse skin fibroblasts, while tincture administration led to obvious cellular toxicity. This research may provide the foundation and inspiration for understanding the absorption mechanism of microemulsion as a transdermal delivery system.
Acknowledgments
This work was financially supported by grants J50302 and 09JW10 from the Shanghai Education Committee, program 10XD14303900, from the Science and Technology Commission of Shanghai Municipality, and projects NCET08-0898 and IRT1071 from the State Education Ministry of the PR China.
The authors would like to thank Professor Wu-Xiong Zhou for taking LSCM photos and Zhong-Hua Wu for culturing cells.
Disclosure
The authors report no conflicts of interest in this work.
References
- YuPLChaoHLWangSWWangPSEffects of evodiamine and rutaecarpine on the secretion of corticosterone by zona fasciculata-reticularis cells in male ratsJ Cell Biochem2009108246947519639602
- ZhaoMYYangXWOptimization of the extraction conditions and simultaneous quantification by RP-LC of six alkaloids in Evodiae fructusChromatographia2008677–8543550
- YangXWTengJChemical constituents of the unripe fruits of Evodia rutaecarpaJ Chin Pharm Sci20071612023
- MatsudaHYoshikawaMIinumaMKuboMAntinociceptive and anti-inflammatory activities of limonin isolated from the fruits of Evodia rutaecarpa var bodinieriPlanta Med19986443393429619117
- KobayashiYThe nociceptive and anti-nociceptive effects of evodiamine from fruits of Evodia rutaecarpa in micePlanta Med200369542542812802723
- MoonTCMurakamiMKudoIA new class of COX-2 inhibitor, rutaecarpine from Evodia rutaecarpaInflamm Res1999481262162510669112
- YaroshDBGalvinJWNaySLPenaAVCanningMTBrownDAAnti-inflammatory activity in skin by biomimetic of Evodia rutaecarpa extract from traditional Chinese medicineJ Dermatol Sci2006421132116423507
- KoHCWangYHLiouKTAnti-inflammatory effects and mechanisms of the ethanol extract of Evodia rutaecarpa and its bioactive components on neutrophils and microglial cellsEur J Pharmacol20075552–321121717109845
- ChoiYHShinEMKimYSCaiXFLeeJJKimHPAnti-inflammatory principles from the fruits of Evodia rutaecarpa and their cellular action mechanismsArch Pharm Res200629429329716681034
- ZhangYTZhaoJHZhangSJEnhanced transdermal delivery of evodiamine and rutaecarpine using microemulsionInt J Nanomedicine201162469248222072882
- TenjarlaSMicroemulsions: an overview and pharmaceutical applicationsCrit Rev Ther Drug Carrier Syst199916546152110635455
- LawrenceMJReesGDMicroemulsion-based media as novel drug delivery systemsAdv Drug Deliv Rev20004518912111104900
- HathoutRMMansourSMortadaNDGeneidiASGuyRHUptake of microemulsion components into the stratum corneum and their molecular effects on skin barrier functionMol Pharm2010741266127320545350
- DreherFWaldePWaltherPWehrliEInteraction of a lecithin microemulsion gel with human stratum corneum and its effect on transdermal transportJ Control Release1997452131140
- GloorMGehringWEffects of emulsions on the stratum corneum barrier and hydrationHautarzt2003544324330 German12669203
- Weissman-ShomerPFryMChick embryo fibroblasts senescence in vitro: pattern of cell division and life span as a function of cell densityMech Ageing Dev1975421591661152547
- PiérardGEPiérard-FranchimontCFrom cellular senescence to seven ways of skin agingRev Med Liege1997524285288 French9273623
- GentileMLatonenLLaihoMCell cycle arrest and apoptosis provoked by UV radiation-induced DNA damage are transcriptionally highly divergent responsesNucleic Acids Res200331164779479012907719
- ChungJHSeoJYChoiHRModulation of skin collagen metabolism in aged and photoaged human skin in vivoJ Invest Dermatol200111751218122411710936
- TsukaharaKTakemaYMoriwakiSSelective inhibition of skin fibroblast elastase elicits a concentration-dependent prevention of ultraviolet B-induced wrinkle formationJ Invest Dermatol2001117367167711564175
- LiuCJTaharaSGaoSPhosphorylation of extracellular signal-regulated protein kinase in cultured keloid fibroblasts when stimulated by platelet-derived growth factor BBScand J Plast Reconstr Surg Hand Surg200337632132415328769
- YuWNaimJOLanzafameRJThe effect of laser irradiation on the release of bFGF from 3T3 fibroblastsPhotochem Photobiol19945921671708165235
- NolteSVXuWRennekampffHORodemannHPDiversity of fibroblasts – a review on implications for skin tissue engineeringCells Tissues Organs2008187316517618042973
- KrejciNCCuonoCBLangdonRCMcGuireJIn vitro reconstitution of skin: fibroblasts facilitate keratinocyte growth and differentiation on acellular reticular dermisJ Dermatol1991975843848
- HersonMRMathorMBAltranSCapelozziVLFerreiraMCIn vitro construction of a potential skin substitute through direct human keratinocyte plating onto decellularized glycerol-preserved allodermisArtif Organs2001251190190611903144
- FilipeVHaweAJiskootWCritical evaluation of Nanoparticle Tracking Analysis (NTA) by NanoSight for the measurement of nanoparticles and protein aggregatesPharm Res201027579681020204471
- DubeyVMishraDAsthanaAJainNKTransdermal delivery of a pineal hormone: melatonin via elastic liposomesBiomaterials200627183491349616513163
- dos SantosTVarelaJLynchISalvatiADawsonKAQuantitative assessment of the comparative nanoparticle-uptake efficiency of a range of cell linesSmall20117233341334922009913
- DaviesJECaustonBBovellYDavyKSturtCSThe migration of osteoblasts over substrata of discrete surface chargeBiomaterials1986732312333719043
- HughesRCPenaSDClarkJDourmashkinRRMolecular requirements for adhesion and spreading of hamster fibroblastsExp Cell Res19791212307314446537
- KircheisRWightmanLWagnerEDesign and gene delivery activity of modified polyethyleniminesAdv Drug Deliv Rev200153334135811744176
- ItoAMatsuokaFHondaHKobayashiTAntitumor effects of combined therapy of recombinant heat shock protein 70 and hyperthermia using magnetic nanoparticles in an experimental subcutaneous murine melanomaCancer Immunol Immunother2004531263214551746
- ChenTWongKFFenskeDBPalmerLRCullisPRFluorescent-labeled poly(ethylene glycol) lipid conjugates with distal cationic headgroupsBioconjug Chem200011343343710821661
- PalmerLRChenTLamAMTransfection properties of stabilized plasmid-lipid particles containing cationic PEG lipidsBiochim Biophys Acta200316111–220421612659962
- FenskeDBPalmerLRChenTWongKFCullisPRCationic poly(ethyleneglycol) lipids incorporated into pre-formed vesicles enhance binding and uptake to BHK cellsBiochim Biophys Acta20011512225927211406103
- QaddoumiMGUedaHYangJDavdaJLabhasetwarVLeeVHThe characteristics and mechanisms of uptake of PLGA nanoparticles in rabbit conjunctival epithelial cell layersPharm Res200421464164815139521
- ChenHChangXWengTA study of microemulsion systems for transdermal delivery of triptolideJ Control Release200498342743615312998
- KoganAGartiNMicroemulsions as transdermal drug delivery vehiclesAdv Colloid Interface Sci2006123–126369385
- SmythHFJrCarpenterCPWeilCSThe chronic oral toxicology of the polyethylene glycolsJ Am Pharm Assoc Am Pharm Assoc (Baltim)1955441273013233090
- HuizingMTRosingHKoopmansFPBeijnenJHInfluence of Cremophor EL on the quantification of paclitaxel in plasma using high-performance liquid chromatography with solid-phase extraction as sample pretreatmentJ Chromatogr B Biomed Sci Appl199870911611659653939
- BookstaffRCStuardSBWardSRPesikPKHenwoodSMThe safety of ethyl oleate is supported by a 91-day feeding study in ratsRegul Toxicol Pharmacol200439220221315041149