Abstract
Purpose
We evaluated the delivery efficiency of intravenously injected large molecular agents, before and after disruption of the blood–brain barrier (BBB-D), induced by focused ultrasound (FUS) using various acoustic parameters.
Materials and methods
Male Sprague-Dawley rats were injected intravenously with Evans blue (EB) before or after BBB-D induction by pulsed FUS. We used a 1.0 MHz pulsed FUS with four acoustic power settings and an ultrasound contrast agent (UCA) at four different doses to induce BBB-D resulting from cavitation. The permeability of the BBB was assessed quantitatively based on the extravasation of EB. Contrast enhanced magnetic resonance imaging (MRI) was used to monitor the gadolinium deposition associated with FUS. Histological analysis was performed to examine tissue damage.
Results
The accumulation of EB in rat brain was found to be dependent on acoustic power and UCA dosage, regardless of whether EB administration occurred before or after FUS-induced BBB-D. Administration of EB followed by sonication resulted in greater EB extravasation than that for rats subjected to sonication prior to EB injection. To reduce tissue damage, EB extravasation was enhanced by first administering EB by intravenous injection, followed by sonication at reduced acoustic power or UCA dosage. The normalized signal intensity change in rat brains that received the same dose of UCA and sonicated after gadolinium injection was significantly greater than in rats undergoing sonication followed by gadolinium administration. Moreover, contrast enhanced MRI showed a more precise distribution of gadolinium in the brain when gadolinium was administered before sonication.
Conclusion
We demonstrated that a compound administered prior to sonication treatment promotes extravasation of the sonicated region. Thus, it is possible to optimize ultrasound parameters for lower sonication and reduced UCA doses, to induce BBB-D while minimizing damage to normal brain tissue.
Introduction
Therapeutic agents are often difficult to administer to the brain because the blood–brain barrier (BBB) has low permeability to ionized water-soluble molecules with a molecular mass greater than 180 Da.Citation1 Many approaches have been developed to enhance drug delivery to the brain, but these may involve increasing the dosage of drugs throughout the brain or may increase the risk of sustaining neurological damage. Recent experiments have shown that local and reversible BBB disruption (BBB-D) can be accomplished noninvasively using pulsed focused ultrasound (FUS) in the presence of microbubbles; pulsed FUS produces mechanical effects such as radiation forces, microstreaming, and cavitation that enhance the permeability of the BBB in a nondestructive manner. The degree of BBB-D is dependent on various ultrasound parameters including acoustic power, dosage of ultrasound contrast agent (UCA), and the number of sonications that are carried out.Citation2
Many chemotherapy treatments are ineffective because drugs fail to reach therapeutic levels in the target brain tumor due to limited permeability of the BBB.Citation3 Previous works have reported that first-line high-dose chemotherapy provides a potential survival benefit compared to historical control patients receiving standard-dose therapies.Citation4,Citation5 Traditional high-dose chemotherapy can improve treatment efficacy, but its clinical application is often limited by systemic toxicity. Therefore, it is important to find methods to deliver sufficient quantities of drugs to the target region, without increasing systemic dosage. We previously reported that the concentration of Evans blue (EB) in tumors and the tumor-to-normal brain ratio of EB in the brain are elevated after BBB-D induction by pulsed FUS. Moreover, repeated pulsed FUS exposure further increases the efficiency of EB delivery to the brain.Citation6–Citation9
One study demonstrated that FUS exposure following EB injection provides nearly a threefold increase in the amount of EB extravasated in sonicated hepatocellular carcinoma compared with that from carcinoma sonicated prior to EB administration.Citation10 Interestingly, the enhanced efficacy of FUS was absent when EB was administered after sonication. This result is consistent with a previous report of cardiac protein delivery.Citation11 Fluid microjets are responsible for the increased capillary permeability and transient nanopores observed in cell membranes following FUS destruction of microbubbles.Citation12,Citation13 These reports suggest that the drug administration procedure must be considered when applying FUS treatment with therapeutic agents. Furthermore, FUS has been used to enhance local drug delivery and increase the antitumor effects in the treatment of brain tumors.Citation14–Citation16
In this study, we evaluated the delivery efficiency of EB administration before and after BBB-D induced by FUS. In addition, we studied the effects of various ultrasound parameters on the efficacy of extravasation. Our aim was to optimize FUS mediated drug delivery to the brain, to minimize tissue damage.
Materials and methods
Experimental animals
Male Sprague–Dawley rats weighing from 280 to 350 g were used in this study. All experiments were performed according to the approved protocols of our institutional animal care and use committee. Rats were anesthetized with chloral hydrate by intraperitoneal injection (400 mg/kg), and body temperature was maintained at 37°C using a heating pad. The top of the cranium was shaved and the scalp overlying the skull was incised to facilitate use of the bregma as an anatomic landmark for targeting. The rat heads were mounted on stereotaxic apparatus (Stoelting, Wood Dale, IL) with the nose bar positioned 3.3 mm below the interaural line. Ultrasound transmission gel (Pharmaceutical Innovations, Newark, NJ) was used to cover the area between the transducer and the skull to maximize ultrasound transmission. In this study, three rats were employed in each group except the magnetic resonance imaging (MRI) analysis group which used four rats.
Pulsed ultrasound equipment
FUS exposure was provided by a 1 MHz focused transducer (A392S; Panametrics, Waltham, MA) with a diameter of 38 mm and radius of curvature of 63.5 mm. The half-maximum of the pressure amplitude at the focal zone was 3 mm in diameter and 26 mm in length. The acoustic power output was measured with a radiation force balance (RFB-2000; Onda, Sunnyvale, CA). The transducer was mounted on a removable cone filled with deionized and degassed water, and a polyurethane membrane capped its tip; the center of the focal spot was approximately 5.7 mm from the cone tip. FUS was precisely targeted using stereotaxic apparatus that utilized the bregma as the anatomical target. Pulsed FUS was applied with 50 millisecond burst lengths at a 5% duty cycle and repetition frequency of 1 Hz. Pulsed FUS was delivered to the right hemisphere at a site 3.5 mm posterior and 2.5 mm lateral to the bregma, and 5.7 mm below the skull surface. UCA (SonoVue; Bracco International, Amsterdam, Netherlands), comprising phospholipid-coated microbubbles with mean diameter of 2.5 μm at a concentration of between 1 × 10⁸ and 5 × 10⁸ bubbles/mL, was intravenously administered via the femoral vein approximately 15 seconds before sonication.
Experimental protocols
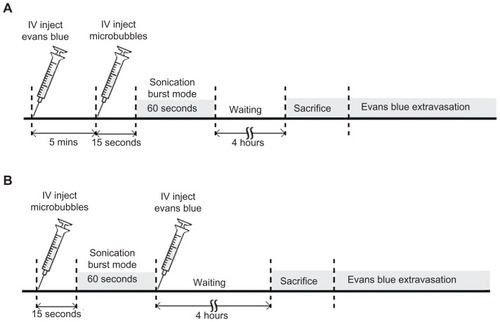
To evaluate the degree of BBB permeability, we compared two procedures for EB (100 mg/kg) injection into the rats’ femoral vein (). The animals received EB injection about 5 minutes before or immediately after FUS exposure. In the first set of experiments, rats were sonicated with FUS in the presence of microbubbles for sonication durations of 0 to 60 seconds. In the experiments that followed, we quantified EB accumulation in rat brains after sonication for 60 seconds. In the second set of experiments, rats were injected with UCA at 300 μL/kg approximately 15 seconds prior to FUS exposure at various acoustic powers (0, 1.43, 2.86, and 4.29 W). In the third set of experiments, rats were exposed to a sonication power of 2.86 W in the presence of microbubbles at four doses (0, 150, 300, and 450 μL/kg). In the final experiment, rats received an injection of gadolinium about 5 minutes before or immediately after FUS exposure, for MRI analysis.
Figure 1 Experimental timeline for pulsed FUS-induced BBB disruption. EB was injected intravenously before (A), or after (B), FUS exposure.
Note: Sonication was applied 15 seconds after microbubble administration to the brain.
Abbreviations: BBB, blood–brain barrier; EB, Evans blue; FUS, focused ultrasound.
Quantification of EB accumulation
The permeability of the BBB can be quantified based on the extravasation of EB (Sigma, St Louis, MO), which acts as a marker of albumin extravasation.Citation9,Citation17,Citation18 EB-treated rats were sacrificed approximately 4 hours after sonication. The rats were perfused with saline via the left ventricle, until a colorless perfusion fluid appeared from the right atrium. After perfusion and brain removal, the brain was sectioned into three slices from 0 mm to 6 mm posterior to the bregma, and these were mounted on glass slides. The coronal sections were then divided into right and left hemispheres before measuring the amount of EB extravasated. The rats’ nonsonicated left hemispheres acted as the control. Samples were weighed and then soaked in 50% trichloroacetic acid solution. After homogenization and centrifugation, the extracted dye was diluted with ethanol (1:3), and the amount of EB present determined using a spectrophotometer (PowerWave 340; BioTek, Winooski, VT) at 620 nm.Citation19 The EB present in the tissue samples was quantified using a linear regression standard curve derived from seven concentrations of the dye; the amount of dye was expressed in absorbance per gram of tissue.
MRI
Contrast enhancement of the T1-weighted MRI was used to monitor the BBB-D permeability. Following FUS sonication, MRI was performed using a 3T MRI system (TRIO 3-T MRI; Siemens AG MAGNETOM, Erlangen, Germany). Rats were anesthetized with 1.5% isoflurane mixed with oxygen gas, and maintained at 1% isoflurane throughout the imaging procedure. A small loop coil (Loop Flex Coil; Siemens) approximately 4 cm in diameter was used for radio frequency reception. A multislice spin echo sequence was performed to obtain 20 slices of the T1-weighted MRI covering the whole brain to image the BBB-D (repetition time/echo time = 435/12 milliseconds; matrix = 154 × 256; section thickness = 1.5 mm). The imaging plane was located across the center of the focal zone, perpendicular to the axis of ultrasound beam. The MRI contrast agent gadolinium (Omniscan; GE Healthcare, Cork, Ireland) was injected intravenously (1 mmol/kg) about 5 minutes before or immediately after sonication. MRI contrast enhancement was analyzed 60 minutes after gadolinium administration. Contour maps describing the spatial distribution of contrast enhancement were quantified for the BBB-D. Regions of contrast enhancement greater than 1.5, 3.0, 4.5, and 6.0 standard deviations of the averaged spatial normal brain regions were color-coded to facilitate identification.
Histological examination
Rats were sacrificed approximately 24 hours after sonication for histological assessment. Rats were perfused with saline and 10% neutral buffered formalin. The brains were removed and embedded in paraffin, and then serially sectioned into 30 μm thick slices. The slices were stained with hematoxylin and eosin (H&E; Thermo-Scientific, Waltham, MA) and TUNEL staining (DeadEnd Colorimetric TUNEL system, G7130; Promega, Madison, WI). The photomicrographs of 5 μm thickness for the H&E and TUNEL-stained tissues were obtained using a Mirax Scan digital microscope slide scanner (Mirax 3D Histech; Carl Zeiss, Rochester, NY) with a Plan-Apochromatic 20/0.8 objective lens. The total area of each tissue section and the areas showing apoptosis were measured using the Image-Pro Plus software package (Media Cybernetics, Silver Spring, MD) in a blinded manner. The percentage of the tissue exhibiting apoptosis was calculated as follows: (area of the tissue containing apoptotic cells/total area of the tissue sections measured) × 100. In total, six tissue sections from each brain were analyzed.
Statistical analysis
All values are shown as means ± standard error of mean (SEM). Statistical analysis was performed using the unpaired Student’s t-test. Statistical significance was defined as P value ≤0.05.
Results
Effect of sonication duration on BBB-D
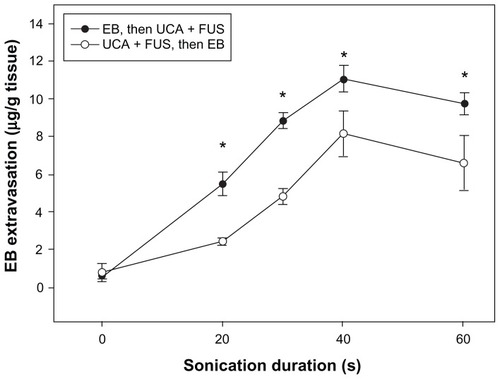
shows that BBB permeability was dependent on the duration of sonication, whether performed before or after EB administration. Moreover, it shows a significant increase in EB accumulation for the group of rats that received EB injection before sonication, at every time point, compared to the EB accumulation in rats that received EB after sonication. Both groups showed an absorption phase from 0 to 40 seconds, and then exhibited a plateau in EB concentration between 40 and 60 seconds.
Figure 2 The amount of EB extravasation in brain tissue was assessed as a function of sonication time after FUS exposure following (solid circle), and followed by (open circle), EB injection at UCA dosage 150 μL/kg.
Note: *Significant difference between the two groups for the same specific sonication duration at a sonication power of 2.86 W (P < 0.05).
Abbreviations: EB, Evans blue; FUS, focused ultrasound; UCA, ultrasound contrast agent.
Procedure of EB administration for doxorubicin accumulation
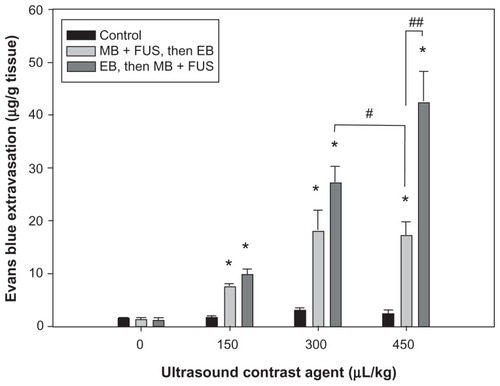
shows the mean extravasation of EB per unit mass of brain tissue from the sonicated site for four sonication powers, for the same dose of UCA. The degree of EB extravasation increased with acoustic power. Additionally, the amount of EB extravasation was greater in the group injected before sonication than it was in the group receiving EB after sonication; this difference was particularly evident for the lowest sonication power of 1.43 W (P < 0.05). shows that the amount of EB extravasated from sonicated brains increased with increasing UCA dose from 0 to 450 μL/kg at 2.86 W sonication power. Moreover, these concentrations were greater in the group receiving EB injection before sonication than they were in the group that received EB administration after sonication, particularly for the highest UCA dose of 450 μL/kg (P < 0.01). Importantly, however, the EB extravasation was significantly greater in brains with the EB injection followed by sonication for UCA at 300 μL/kg than it was for brains with EB administration following sonication for UCA at 450 μL/kg (P < 0.05). In contrast to EB concentration values for the sonicated brains, only insignificant differences were found for the values of control brains at the various acoustic powers and UCA doses.
Figure 3 Relationship between EB extravasation and sonication power after microbubble and FUS treatment, following and followed by, EB injection at the UCA dose of 300 μL/kg. EB extravasation as a function of the acoustic power in the presence of microbubbles.
Notes: *Significant difference compared to the contralateral nonsonicated hemisphere; #Significant difference between two sonicated groups. (* and #, P < 0.05).
Abbreviations: EB, Evans blue; FUS, focused ultrasound; MB, microbubble; UCA, ultrasound contrast agent.
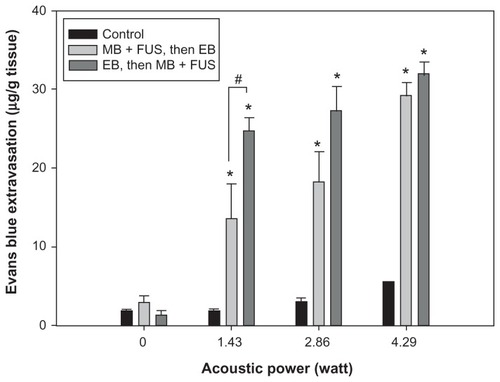
Figure 4 Relationship between EB extravasation and UCA dosage after FUS treatment, following and followed by, EB injection at a sonication power of 2.86 W.
Notes: *Significant difference compared with the contralateral nonsonicated hemisphere; #Significant difference between two sonicated groups. (* and #, P < 0.05; ##, P < 0.01).
Abbreviations: EB, Evans blue; FUS, focused ultrasound; MB, microbubble; UCA, ultrasound contrast agent.
MRI analysis
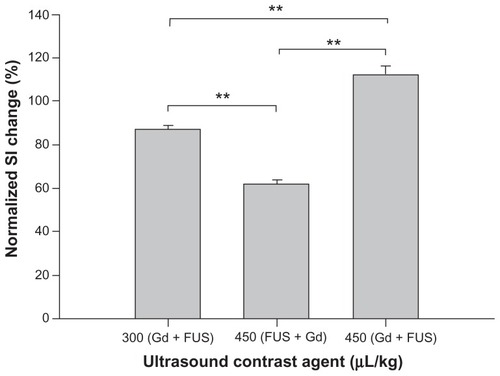
and C shows MRIs depicting the spatial distribution of gadolinium deposition in rats receiving administration of gadolinium followed by sonication at a power of 2.86 W, for UCA doses of 300 and 450 μL/kg. The intensity of the contrast enhancement was greater after injecting UCA at 450 μL/kg than it was for UCA at 300 μL/kg. shows the distribution of gadolinium deposition from rats receiving gadolinium injection following sonication at an acoustic power of 2.86 W, for the UCA dose of 450 μL/kg. Interestingly, there was less intensity in the contrast enhancement after injecting UCA at 450 μL/kg () than the intensity resulting from 300 μL/kg UCA (). The contour maps in this figure show the extent of gadolinium deposition; there is clearly a better focused gadolinium distribution (red and blue regions) in brains receiving sonication following gadolinium administration in and C compared to brains that received sonication followed by gadolinium injection (). Following gadolinium administration, the normalized signal intensity change in focal volume was significantly greater after injecting UCA at 450 μL/kg than it was at 300 μL/kg for the same sonication power (). The normalized signal intensity change in rat brains that received a UCA dose of 450 μL/kg and sonicated after gadolinium injection was significantly greater than in rats undergoing sonication followed by gadolinium administration. It was also found that the normalized signal intensity change in the rats that received UCA at 300 μL/kg and sonication following gadolinium administration was significantly greater than in rats that received a UCA dose of 450 μL/kg with sonication followed by gadolinium administration.
Figure 5 Distribution of BBB disruption for gadolinium administration (A) followed by sonication at 2.86 W with UCA doses of 300 μL/kg and (B) following sonication at 2.86 W with the UCA dose of 450 μL/kg and (C) 450 μL/kg.
Notes: The right hemisphere was treated with FUS, and the left was the control. Regions with contrast enhancement are shown as >1.5 (green), >3.0 (yellow), >4.5 (blue), and >6.0 (red) standard deviations above the average MRI signal intensity of the contralateral normal tissue in the left hemisphere are shown.
Abbreviations: BBB, blood–brain barrier; FUS, focused ultrasound; MRI, magnetic resonance imaging; UCA, ultrasound contrast agent.
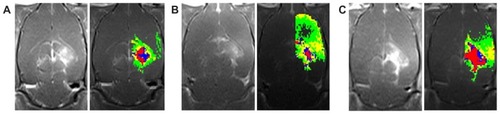
Figure 6 Normalized signal intensity change of the contrast-enhanced T1 weighted MRIs in sonicated brains derived from .
Note: **P < 0.01.
Abbreviations: FUS, focused ultrasound; Gd, gadolinium; MRI, magnetic resonance imaging; SI, signal intensity.
Histological evaluation
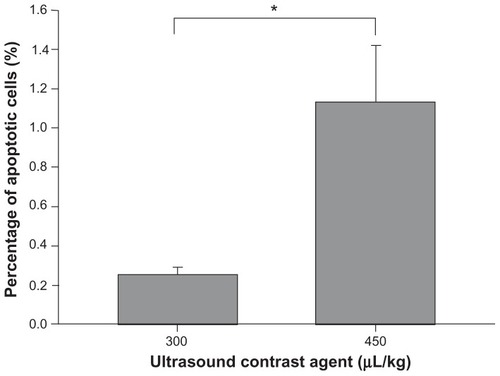
shows representative H&E-stained sections for UCA treatments at 300 and 450 μL/kg at sonication power of 2.86 W. The corresponding TUNEL-stained sections were prepared for histopathologic examination and apoptotic evaluation (). Red blood cells were present in sonicated brain tissue in and around the focal region, and were more severe for the higher dose (450 μL/kg) samples. This observation is consistent with the finding that more apoptotic cells were present in sonicated UCA 450 μL/kg samples than they were in UCA 300 μL/kg samples. indicates that there were significant differences between these two groups.
Figure 7 Hematoxylin and eosin staining of transverse brain sections sonicated at 2.86 W with UCA doses of (A–C) 300 μL/kg and (D–F) 450 μL/kg.
Notes: The affected brain structures include the hypothalamus, thalamus, and hippocampus. Local displacement and increased extravasation of red blood cells were more obvious in specimens treated at the greater UCA dosage of 450 μL/kg than in specimens treated with UCA doses of 300 μL/kg.
Abbreviation: UCA, ultrasound contrast agent.
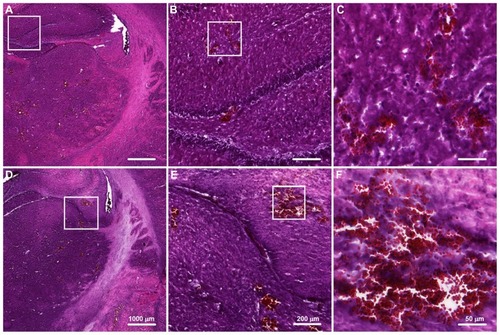
Figure 8 Examples of histological observations of TUNEL-stained sections treated with UCA doses of (A–C) 300 μL/kg and (D–F) 450 μL/kg sonicated at 2.86 W.
Note: Many cells appear to be undergoing apoptosis in the sonicated brains.
Abbreviation: UCA, ultrasound contrast agent.
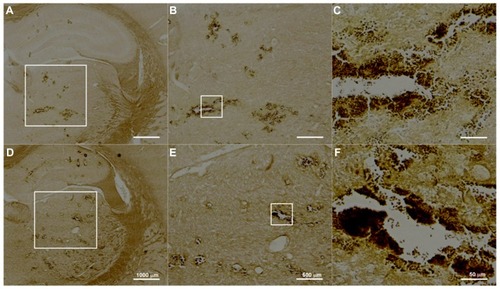
Figure 9 Percentage of apoptotic cells counted in microscopic fields (total area: 4000 × 9000 μm) of the sonicated brains during histological observations of TUNEL-stained sections.
Note: *P < 0.05.
Discussion
This study demonstrated that drug administration strategy has an impact on the efficacy of FUS induced BBB-D, and on the resulting efficiency of drug delivery. Interactions between sonication and microbubbles can further promote extravasation in sonicated regions of the brain. EB extravasation in the group of rats injected with EB before sonication was significantly greater than in the group injected with EB after sonication at every time point (). These results indicate that a phenomenon other than diffusion, such as cavitation, microstreaming, and oscillation, increases extravasation when EB is injected prior to sonication. This is in agreement with a previous report,Citation10 where significantly increased extravasation occurred in hepatomas that were sonicated after administration of EB, but not in hepatomas sonicated before EB injection.
Our results indicate that the promoted extravasation by EB injection before sonication was most significant at the lowest acoustic power of 1.43 W and at the highest UCA dose of 450 μL/kg. In particular, EB extravasation for EB injection before sonication for the UCA 300 μL/kg group was significantly greater than for EB injection after sonication for the UCA 450 μL/kg group. The implication of this finding is that sonication after drug administration is associated with further increases in drug accumulation even though UCA is administered at a lower dose. A greater UCA dosage provides more microbubbles in blood vessels to serve as nuclei for cavitation, thus augmenting extravasation.Citation18,Citation20 However, increased numbers of microbubbles can induce extravasation of erythrocytes and increase the numbers of apoptotic cells.Citation17 This might explain why the apoptotic cells were mainly localized to the microvascular walls, with only a few apoptotic cells observed outside the focal regions. Therefore, it is essential to optimize ultrasound parameters for lower sonication powers and reduced UCA doses, to induce BBB-D while minimizing damage to normal brain tissue.
The exact mechanism of BBB-D induction by FUS remains unclear. Several studies report that the BBB-D is probably the result of mechanical effects associated with interactions between ultrasound and microbubbles. Microbubbles have potential therapeutic application in causing tissue damage and increasing blood vessel permeability in muscle.Citation21,Citation22 Furthermore, our previous works found that higher doses of UCA, or increased FUS sonication power produced longer lasting disruption of the BBB.Citation7,Citation9 Safety may become a concern if BBB-D is prolonged, because an impermeable BBB is vital to maintaining normal brain physiology. Thus, the procedure for drug administration is another potentially important factor in enhancing drug delivery by FUS under mild sonication conditions to minimize adverse effects. In addition to assessing histology, we also monitored patterns of contrast enhancement. The MRIs shown in are contour maps revealing that gadolinium deposition in rats injected with gadolinium prior to sonication is more concentrated in the focal region than the gadolinium concentration that occurs when gadolinium injection follows sonication. One explanation could be that cavitation activity enhances the accumulation of gadolinium in the focal region when gadolinium is administered prior to sonication.
In conclusion, this study demonstrates that cavitation induced by FUS in the presence of microbubbles significantly increases the delivery efficiency of EB to the brain, if sonication is carried out after EB administration. Our findings will aid the development of an optimal procedure for FUS assisted drug delivery to the brain while minimizing brain tissue damage.
Acknowledgments
This study was supported by grants from the National Science Council of Taiwan (no NSC 100-2321-B-010-010 and NSC 99-2321-B-010-017), Department of Health of Taiwan (DOH101-TD-PB-111-TM012 and DOH101-TDC-111-007), Veterans General Hospitals University System of Taiwan Joint Research Program (#VGHUST100-G1-3-3), Yen Tjing Ling Medical Foundation (grant CI-100-17), and Cheng Hsin General Hospital Foundation (no 100F117CY25 and 101F195CY18).
Disclosure
The authors report no conflicts of interest in this work.
References
- KrollRANeuweltEAOutwitting the blood-brain barrier for therapeutic purposes: Osmotic opening and other meansNeurosurgery19984210831099 discussion 1099–11009588554
- McDannoldNVykhodtsevaNHynynenKEffects of acoustic parameters and ultrasound contrast agent dose on focused-ultrasound induced blood-brain barrier disruptionUltrasound Med Biol20083493093718294757
- Cordon-CardoCO’BrienJPCasalsDMultidrug-resistance gene (p-glycoprotein) is expressed by endothelial cells at blood-brain barrier sitesProc Natl Acad Sci U S A1989866956982563168
- MotzerRJMazumdarMGulatiSCPhase ii trial of high-dose carboplatin and etoposide with autologous bone marrow transplantation in first-line therapy for patients with poor-risk germ cell tumorsJ Natl Cancer Inst199385182818357693955
- MotzerRJMazumdarMBajorinDFBoslGJLynPVlamisVHigh-dose carboplatin, etoposide, and cyclophosphamide with autologous bone marrow transplantation in first-line therapy for patients with poor-risk germ cell tumorsJ Clin Oncol199715254625529215823
- YangFYWangHELinGLMicro-spect/ct-based pharmacokinetic analysis of 99mtc-diethylenetriaminepentaacetic acid in rats with blood-brain barrier disruption induced by focused ultrasoundJ Nucl Med20115247848421321259
- YangFYHorngSCLinYSKaoYHAssociation between contrast-enhanced mr images and blood-brain barrier disruption following transcranial focused ultrasoundJ Magn Reson Imaging20103259359920815056
- YangFYLinYSKangKHChaoTKReversible blood-brain barrier disruption by repeated transcranial focused ultrasound allows enhanced extravasationJ Control Release201115011111621070825
- YangFYLiuSHHoFMChangCHEffect of ultrasound contrast agent dose on the duration of focused-ultrasound-induced blood-brain barrier disruptionJ Acoust Soc Am20091263344334920000948
- BekeredjianRKrollRFeinEUltrasound targeted microbubble destruction increases capillary permeability in hepatomasUltrasound Med Biol2007331592159817618040
- BekeredjianRChenSGrayburnPAShohetRVAugmentation of cardiac protein delivery using ultrasound targeted microbubble destructionUltrasound Med Biol20053168769115866418
- BrujanEAThe role of cavitation microjets in the therapeutic applications of ultrasoundUltrasound Med Biol20043038138715063520
- MillerDLQuddusJSonoporation of monolayer cells by diagnostic ultrasound activation of contrast-agent gas bodiesUltrasound Med Biol20002666166710856630
- YangFYTengMCLuMTreating glioblastoma multiforme with selective high-dose liposomal doxorubicin chemotherapy induced by repeated focused ultrasoundInt J Nanomedicine2012796597422393293
- YangFYWangHELinGLLinHHWongTTEvaluation of the increase in permeability of the blood-brain barrier during tumor progression after pulsed focused ultrasoundInt J Nanomedicine2012772373022359451
- YangFYWongTTTengMCFocused ultrasound and interleukin-4 receptor-targeted liposomal doxorubicin for enhanced targeted drug delivery and antitumor effect in glioblastoma multiformeJ Control Release332012 [Epub ahead of print.]
- YangFFuWChenWYehWLinWQuantitative evaluation of the use of microbubbles with transcranial focused ultrasound on blood-brain-barrier disruptionUltrason Sonochem20081563664317910929
- YangFFuWYangRLiouHKangKLinWQuantitative evaluation of focused ultrasound with a contrast agent on blood-brain barrier disruptionUltrasound Med Biol2007331421142717561334
- SharmaHSDeyPKInfluence of long-term immobilization stress on regional blood-brain barrier permeability, cerebral blood flow and 5-ht level in conscious normotensive young ratsJ Neurol Sci19867261762936871
- McDannoldNVykhodtsevaNHynynenKTargeted disruption of the blood-brain barrier with focused ultrasound: Association with cavitation activityPhys Med Biol20065179380716467579
- UngerECMcCreeryTPSweitzerRHCaldwellVEWuYAcoustically active lipospheres containing paclitaxel: A new therapeutic ultrasound contrast agentInvest Radiol1998338868929851823
- BednarskiMDLeeJWCallstromMRLiKCIn vivo target-specific delivery of macromolecular agents with mr-guided focused ultrasoundRadiology19972042632689205257