 ?Mathematical formulae have been encoded as MathML and are displayed in this HTML version using MathJax in order to improve their display. Uncheck the box to turn MathJax off. This feature requires Javascript. Click on a formula to zoom.
Abstract
Auscultation of the heart is accompanied by both electrical activity and sound. Heart auscultation provides clues to diagnose many cardiac abnormalities. Unfortunately, detection of relevant symptoms and diagnosis based on heart sound through a stethoscope is difficult. The reason GPs find this difficult is that the heart sounds are of short duration and separated from one another by less than 30 ms. In addition, the cost of false positives constitutes wasted time and emotional anxiety for both patient and GP. Many heart diseases cause changes in heart sound, waveform, and additional murmurs before other signs and symptoms appear. Heart-sound auscultation is the primary test conducted by GPs. These sounds are generated primarily by turbulent flow of blood in the heart. Analysis of heart sounds requires a quiet environment with minimum ambient noise. In order to address such issues, the technique of denoising and estimating the biomedical heart signal is proposed in this investigation. Normally, the performance of the filter naturally depends on prior information related to the statistical properties of the signal and the background noise. This paper proposes Kalman filtering for denoising statistical heart sound. The cycles of heart sounds are certain to follow first-order Gauss–Markov process. These cycles are observed with additional noise for the given measurement. The model is formulated into state-space form to enable use of a Kalman filter to estimate the clean cycles of heart sounds. The estimates obtained by Kalman filtering are optimal in mean squared sense.
Introduction
The heart is divided into four chambers. The upper chambers are called atria and lower chambers are called ventricles. The heart muscles squeeze blood from chamber to chamber. At each squeeze, the valve opens to let blood move backward. In this way, the valve keeps blood moving as efficiently as possible through the heart and out to the body.Citation1 Heart sounds result from the interplay of dynamic events associated with the contraction and relaxation of the atria’s and ventricles’ valve movements and blood flow. The heart can emit normal heart sounds or murmurs. The positioning of the stethoscope at the auscultatory area plays a significant role in diagnosis of heart murmurs.
Nanomedicine is an emerging field, with nanotechnology concepts for diagnosis and treatment of cardiovascular disease.Citation2 Heart-sound data depend on the electronic stethoscope, which is bulky, and the mechanism to extract the data depends on the movement of the diaphragm of the heart. The oscillations of the diaphragm are converted to the heart-sound signal, and this approach is sensitive to artifacts and external noise. There is a possibility that the use of nanomedicine also involves applications of nanoparticles or nanoneedles, both of which are currently under development and could completely change the way physicians detect and treat cardiac patients. For example, in nanomedicine, iron oxide nanoparticles can be used to improve magnetic resonance imaging of cancer tumor. Peptide-coated nanoparticles can bind to a cancer tumor; once the nanoparticles are attached to the tumor, the magnetic property of the iron oxide enhances the images from a magnetic resonance imaging scan. In related work,Citation3,Citation4 characterization of cellular mechanics of cast cells was carried out using nanoneedles inside an environmental scanning electron microscope. The nanoneedles are used to measure local stiffness characteristics of single cells. Important in estimating the stiffness of the cell is choosing the correct tip geometry, such as conical, spherical, or cylindrical. Two important steps have to be carried out before nanoneedles are used to measure cell stiffness: fabrication of soft and hard nanoneedles, and calibration of soft nanoneedles.Citation5,Citation6 In related work, a finite element method–code Abaqus was used for numerical analysis to ensure that only good-quality nanoneedles were selected for measurement of reliable data. In this research,Citation3 it was possible to detect defective nanoneedles, which should not be used to measure stiffness variation among single cells. This work is important; previous work did not use finite element method analysis during calibration of the soft nanoneedle. The above research clearly indicates the possibility of designing better and less bulky sensors to measure heart sounds. The Center for Biomedical Engineering is currently pursuing the idea of beam deformation using piezoresistance as a measure of heart murmurs.
Auscultation area
Auscultation sites may vary according to the patient’s anatomy. In studying heart sound, emphasis should be placed on its intensity (faint/moderate/loud), which greatly depends on the location of the stethoscope on the precordium (skin). Those who intend to study heart auscultation should consult the experts (cardiologists) regarding correct positioning of the stethoscope. Auscultation of the heart should take place in a quiet room, with the patient’s chest exposed if necessary. The stethoscope should be equipped with a stiff diaphragm and shallow bell. The principal area of interest is shown in . As an example, placing the stethoscope at the semilunar valve (aortic and pulmonary) provides better S2 sound. The S1 heart sound can be heard more clearly in the atrioventricular (AV) area known as the AV valve.
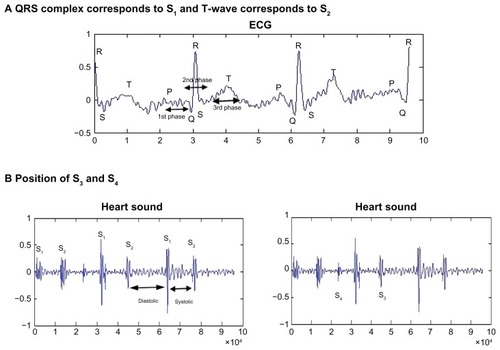
Figure 1 Auscultation area: listening positions for S1, S2, S3, and S4 heart sounds. (A) QRS complex corresponds to S1, and T-wave corresponds to S2. (B) Position of S3 and S4.
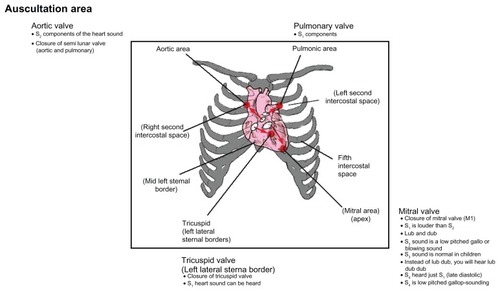
shows stethoscope positions to listen to normal S1, S2, S3, and S4 sounds. The intensity of S1 depends on the rate of pressure development in the ventricle, the structure of the valve leaflets, and the position of the AV valves at the beginning of the ventricle contraction. The goal is to listen to the four areas corresponding to the valves, which provide valuable information to GPs and can be a very valuable diagnostic tool to examine the hearts of patients. If the stethoscope is placed at the apex (mitral valve), the normal “lub dub” sounds can be heard during the closure of this valve. The S2 sound corresponds to the closure of the aortic and pulmonary valves. At the mitral valve (apex), the S3 sound, as shown in , can be heard as a low-pitched or blowing sound during the mid-diastolic stage. In the same position, S4 can be heard just before S1 during the late-diastolic stage as a low-pitched gallop sound. S3 can be normal for children, while S4 is not normally present in healthy persons.Citation1 Normally, the S1 sound is louder than S2 at the base of the heart. In certain conditions, S1 can decrease in intensity when S2 is louder than S1 at the cardiac apex.Citation7 This happens in states of impaired ventricular contractibility and decreased myocardial tension development, which is known as congestive heart failure. Another factor can be mitral valve immobility. This occurs in severe cases of mitral stenosis. In normal conditions, S2 is produced by the closure of the aortic and pulmonary valves. S2 is higher-pitched and shorter in duration than S1. In this case, S2 is louder than S1 at the cardiac base (second intercostal space, as in ). This is associated with the closure of the aortic valve A1 and followed by closure of the pulmonic valve P2.
Figure 2 (A and B) Relationship of ECG and the four heart sounds.
Abbreviation: ECG, electrocardiogram.
Denoising of heart sound
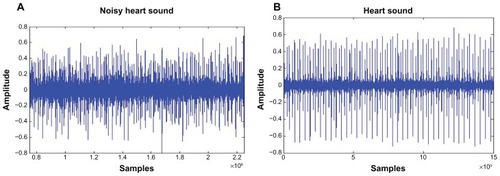
The simplest model for any biomedical signal is the summing of an invariant signal and random noise. A common method to measure these parameters is the averaging technique, which may be reasonable for one type of signal but not for all cases. shows heart-sound signal with some interference such as background noise and artifacts, and shows normal heart-sound signal. The characteristics of heart sound can be faint, moderate, or loud, and the intensity does seriously affect the trial case. The use of average statistics may not be suitable for this case, as they can distort the information. The stethoscope can detect high-frequency sounds, such as systolic murmurs, and detect low-frequency sounds, such as S3 and S4. Analyzing such data requires a quiet environment with minimum ambient noise. A heart murmur is defined according to its intensity, frequency, quality, configuration, duration, and radiation.
Figure 3 (A and B) Average signal of normal patient. (A) Noisy heart signal; (B) clean heart signal.
Normally, the performance of the filter naturally depends on prior information related to the statistical properties of the signal and the background noise. Digital filters such as finite impulse response filters are time-invariant and have the drawback whereby the spectrum of the biomedical signals overlaps with the background noise. In a related area of signal processing,Citation8 Wiener filters are another denoising approach with a specific filter structure that provides optimal filtering in the mean-squared error sense. The drawback of this approach is that if the signal is time-frequency variable and the assumption mode based on stationary process, then they do not give optimal results. One solution to the denoising problem is the use of the Kalman filter (KF). It provides a mean-squared value that can minimize the error. The KF supports estimates of past, present, and even future states, even when the precise nature of the modeled system is unknown.
On the other hand,Citation9 a single-trial dynamical estimation is also used for event-related potentials (ERP). This is based on recursive Bayesian mean-square estimation, which in turn is based on the KF procedure. This proposed method gives excellent estimates for single trials. The design filters give reasonable estimates, even with poor signal-to-noise ratio (SNR). The Bayesian aspects of the method are another benefit of the KF, and it allows a feasible modeling of prior knowledge about the parameters. There are limited applications of using the KF for denoising of the hybrid spatial spectra. To the best of our knowledge, there are no studies on this filter for HSS. In this study, for every cycle of HSS, the KF is applied for denoising to recover a cleaner estimation of the signal. The recursive mean-square estimate for the state is given by KF.
Methods
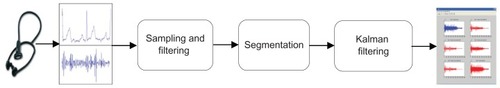
The signal analysis framework used in this study is illustrated in . HSS and the electrocardiogram (ECG) signals were identified and extracted from the acquired data. As mentioned before, auscultations of the heart provide clues to the diagnosis of many cardiac abnormalities. Thus, a heart-sound database is important in the development of an automatic heart diagnosis system. The database can be used in clinical work, research, and teaching of cardiac auscultation. The heart sounds were transduced using phonocardiography sensors and amplified with a preprocessing circuit. These signals were then digitized and stored. However, during collection of data, it was ensured that the data were not corrupted with unwanted noise or artifacts that would affect the performance of the system.
Figure 4 Processing of the HSS and ECG signals.
Abbreviations: HSS, hybrid spatial spectra; ECG, electrocardiogram.
Even though the data were collected in a controlled environment under normal clinical conditions, it was still difficult to collect data free from all the above problems. The heart signals were recorded using a Welch Allyn (Skaneateles, NY) Meditron Electronic stethoscope placed on the chest of the patient. There were ten sets (five normal and five abnormal) of data collected at Fakulti Perubatan, Universiti Teknologi MARA, Kampus Selayang, Hospital Selayang. Each patient’s sound samples were recorded for a duration of 1 minute. shows the different number of cycles collected over the different patients. The average number of cycles for the ten patients was 159. Patients with mild murmurs were grouped with the normal subjects. The need for computer-aided auscultation of the heart and for having a standard clinical practice for the recording of heart sounds are discussed in this investigation. Currently, there is no widely available large-scale database for development, evaluation purpose, and comparison of ECG and HSS algorithm. In addressing these issues, the standard practice carried out in this research was as follows: (1) in detecting heart murmurs, there are variations in the placement of the stethoscope, though for general examinations the standard location provides a useful reference point; (2) data collected must be under realistic conditions; and (3) preprocessing done to remove motion artifacts, breath noise, and background noise.
Table 1 Types of murmurs and number of cycles of heart sound per patient
The collected sample of the heart sound can be corrupted by sudden movement of the stethoscope and from background noise such as conversation, as in . KF can be used to estimate the underlying nonstationary process for given observation in a minimum mean-squared error sense. This type of filter can be used in many applicationsCitation10–Citation12 and has proven to be a powerful filter. The region of electromagnetic spectrum whereof biomedical signals overlaps with background noise have been described in an earlier section. The next section address the use of the KF to estimate the underlying nonstationary process.
As disease cells show different cell mechanical properties as compared to normal cells, fast disease detection is required. A number of researchers are working on cell attachment to substrate in order to understand the sticky force and the surface of substrate. It has been observed that if the sticky force is strong, the cell is healthy, and for weak sticky force the cell is damaged.Citation12 The current work measured the beam deformation using piezoresistance of a single cell. We believe a similar approach can be used to measure vibration of heart sound from the surface of the skin.
State-space formulation and KF
This paper applied the state-space formulation originally proposed by ShindleCitation7 for ERP estimation of heart-sound denoising.
y 1 : tt denotes sequence of single cycle of heart-sound signal.
The M signal measurement at the t-trial cycle is represented as a column vector yt,
if we assume θt is the denoised version of yt, which is hidden behind the background noise Vt and is to be estimated by KF. The observation equation of the signal is given by
where Vt is the independent and identical distribution (IID) Gaussian noise with zero mean and covariance Vt~IID N (O, R).
The dynamics of θt represent cycle-to-cycle variations that are assumed to follow first-order Gauss–Markov process, as shown in Equationequation 3(3) .
where Wt~IID N(O, Q).
The observation noise covariance, R, and state noise covariance, Q, are assumed to be diagonal with identical values, ie, R =σv2I and Q= σw2I.
All the model parameters are denoted by
The measurement sequence yt = T, and if
and
are the mean and covariance, respectively, representing one-step-ahead prediction density, and
and
are the mean and covariance of the filtered density P y (θ | 1:t). The objective is to uncover the underlying clean cycle of heart sounds given the noise measurement; this can be obtained by estimating the filtered distribution of state θt given observation Y1:tY, P(θt|y1:t), using KF.
First, we initiate
and
.
By denoting (θt|t|Pt|t) and ().
The mean and covariance filtering distribution, prediction distribution are described as respectively follows. The KF algorithm can be summarized as
For t = 1:T
Prediction step
Computer Kalman gain
Correction step
Prediction error and prediction error covariance.
The prediction error can be as
and the prediction error covariance as
In this paper, instead of using measurement samples for yt, we use its wavelet coefficients, wherein the dimension of the state vector is greatly reduced, and hence the computational effort. The noisy heart-sound measurements, yt, are first transformed into a vector of wavelet coefficients before estimation of the θt, which is its denoised version. The estimation θt is used to reconstruct the clean heart-sound signal. This method has been usedCitation10,Citation11 for ERP estimation using particle filtering. Discrete wavelet transformation of biorthogonal 5.5 is used with an approximation coefficient of level −2.
Results and discussion
Effect of varying noise variance
In this section, the effects of variation in the parameters σ v2 and σw2 and comparison of these signals between normal and abnormal heart sound are studied. Selection of the optimal valves for noise variances σv2 and σw2 is important for KF. The ability to track the change of the state parameters is related to the ratio of state noise to observed variance σw2. A large value of noise is estimated at a stationary point, while small valves are unable to follow the abrupt changes and suffer a tracking lag.
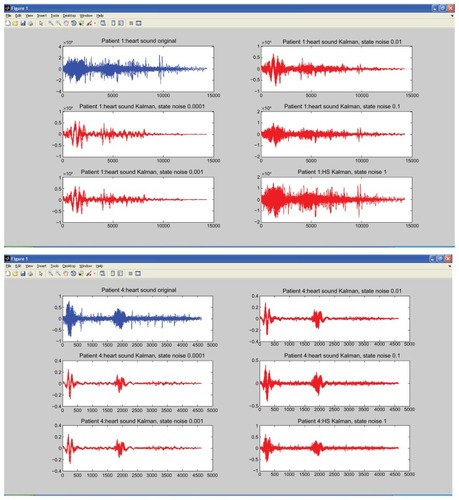
We fixed σv2 = 1, and allowed observation noise σw2 to change. The selection of optimal parameters involved only σv2. shows a patient with murmurs, while 6B shows a normal healthy person. In this experiment, σv2 was kept constant, and σw2 was varied, with values of 0.0001, 0.001, 0.01, 0.1, and 1.0. The figure clearly shows that as the value of σw2 gets bigger, the amplitude of the signals gets smaller, significant levels of the noise are removed, and a clear estimate of the underlying clean heart sound can be obtained. SNR is measured to compare the level of a desired signal to the level of background noise. It is defined as the ratio of signal power to the noise power. A ratio higher than 1:1 indicates more signal than noise.
To quantify the estimation performance, we used SNR for heart sound, defined as follows
where σN2 and σS2 are the noise and signal power estimated using averages over trial as
where
is the ensemble average of trials.
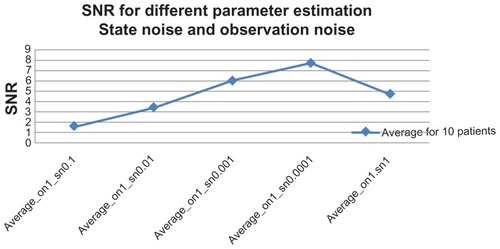
The goal of this study was to maximize the SNR so that accurate conclusions could be drawn. The experiment was carried out in order to obtain a good quality of heart-sound signal. Actual implementation of the system in a hospital may be met with a noisy environment. The patient may move during recording, causing impulse-like noise in the recorded heart sound due to friction between the stethoscope’s chest piece and the patient’s chest. In this experiment, the robustness of the system against noise was tested. shows SNR average over ten patients. The best performance was with σw2 = 0.0001, where SNR (decibels [dB]) gave a value of 10.3, and the worst value came from σw2 = 1.0 with SNR = 1.1 (dB) for normal. The SNR with abnormal patients provided the best results, with values of 5.4 and 0.3, respectively, with σw2 = 0.0001. shows the overall average result of the SNR with different variations over the ten patients.
Table 2 Normal and abnormal patients’ signal-to-noise ratio (SNR)
Figure 5 Overall average signal-to-noise ratio (SNR) of the ten patients.
The goal of this research was to improve the quality and maximize the SNR for the respective heart sounds. shows the SNR of the original noisy heart-sound cycles and after the KF process. The SNR cycles after the KF show significant improvement over the original noisy cycles, which shows a significant reduction in noise. shows less turbulence for normal heart sound (rise and fall) at the systolic and diastolic areas, while 6A shows high turbulence for abnormal heart sound in these areas. Heart murmurs are related to valvular heart disease and typically diagnosed by examining the spectral characteristics of the heart sound with additional information such as amplitude and timing. The preprocessing of this filtered signal plays a significant role before any features can be extracted from the signal.
Figure 6 (A) Abnormal heart sound from a patient after the filtering process; (B) normal heart sound from a patient after the filtering process.
Conclusion
This work addressed the need for a framework that provides tools to automatically segment heart sounds into individual cardiac cycles. The relative contribution of each analytical stage to identify murmurs has been evaluated. Since heart murmurs can be systolic, diastolic, or continuous, they are accompanied by different intensity grades. Some systolic murmurs have proven to be clinically innocent, while all the diastolic and continuous murmurs are classified as abnormal.Citation6,Citation13–Citation15 The KF is proposed as a preprocessed signal to evaluate system performance based on mel-frequency cepstral coefficients and Gaussian mixture model classifiers. Accessing a heart-murmur analysis system is complicated in terms of its effect on the preprocessing stage, feature extraction, and classification of the heart. First, the types of features used in this area to analyze the acoustic cardiac signals are extensive and followed by performance measures on the classification scheme. Normally, the raw data, yt, of the heart murmurs depends on θt, the denoted version of Vt, which is hidden behind the background noise. In this research, an estimation has been used to reconstruct the clean heart sound and to improve the quality, with a view to maximizing the SNR of the heart-sound signals.
Acknowledgments
We would like to thank the Centre of Biomedical Engineering, University Technology Malaysia research grant (GUP-flagship Q.J130000.2436.00G31), the Institute of Advanced Photonic Science, and the Ministry of Higher Education research grant to support this research. We are also thankful to the King Mongkut Institute of Technology, Thailand, for providing the research facilities.
Disclosure
The authors report no conflicts of interest in this work.
References
- BrownEMLeungWCTSalmonAPHeart Sounds Made EasyEdinburghChurchill Livingstone2002
- GodinBSakamotoJHSerdaREGrattoniABouamraniAFerrariMEmerging applications of nanomedicine for the diagnosis and treatment of cardiovascular diseasesTrends Pharmacol Sci201031519920520172613
- AhmadMRNakajimaMKojimaSHommaMFukudaTIn situ single cell mechanics characterization of yeast cells using nanoneedles inside environmental SEMIEEE Trans Nanotechnol200875607616
- AhmadMRNakajimaMKojimaSHommaMFukudaTThe effects of cell sizes, environmental conditions, and growth phases on the strength of individual W303 yeast cells inside ESEMIEEE Trans Nanobioscience20087318519318779098
- AhmadMRNakajimaMKojimaSHommaMFukudaTBuckling nanoneedle for characterizing single cells mechanics inside environmental SEMIEEE Trans Nanotechnol2011102226236
- AhmadMRNakajimaMKojimaSHommaMFukudaTNanoindentation methods to measure viscoelastic properties of single cells using sharp, flat, and buckling tips inside ESEMIEEE Trans Nanobioscience201091122319887332
- ShindleDMPractical cardiac auscultationCrit Care Nurs Q200730216618017356358
- CeruttiSBersaniVCarraraALiberatiDAnalysis of visual evoked potentials through Wiener filtering applied to a small number of sweepsJ Biomed Eng1987913123795902
- GeorgiadisSDRanta-ahoPOTarvainenMPKarjalainenPASingle-trial dynamical estimation of event-related potentials: a Kalman filter-based approachIEEE Trans Biomed Eng20055281397140616119235
- MohseniHRNazarpourKWildingELSaneiSThe application of particle, filters in single trial event-related potential estimationPhysiol Meas200930101101111619759402
- ArnoldMMiltnerWHWitteHBauerRBraunCAdaptive AR modeling of nonstationary time series by means of Kalman filteringIEEE Trans Biomed Eng19984555535629581053
- TingCMSallehSHZainuddinZZBaharASpectral estimation of nonstationary EEG using particle filtering with application to event-related desynchronization (ERD)IEEE Trans Biomed Eng201158232133121257361
- ReedTRReedNEFritzsonPHeart sound analysis for symptom detection and computer-aided diagnosisSimul Model Pract Theory20031112144
- MohamedASARaafatHMRecognition of heart sounds and murmurs for cardiac diagnosisPattern Recognition: Proceedings of the 9th International Conference on Pattern RecognitionNovember 14–17, 1988Rome, ItalyWashingtonIEEE Computer Society Press1988
- LessardEGlickMAhmedSSaricMThe patient with a heart murmur: evaluation, assessment and dental considerationsJ Am Dent Assoc2005136334735615819349