Abstract
Background
This study explored the pharmacokinetics, tissue distribution, and excretion profile of zinc oxide (ZnO) nanoparticles with respect to their particle size in rats.
Methods
Two ZnO nanoparticles of different size (20 nm and 70 nm) were orally administered to male and female rats, respectively. The area under the plasma concentration-time curve, tissue distribution, excretion, and the fate of the nanoparticles in organs were analyzed.
Results
The plasma zinc concentration of both sizes of ZnO nanoparticles increased during the 24 hours after administration in a dose-dependent manner. They were mainly distributed to organs such as the liver, lung, and kidney within 72 hours without any significant difference being found according to particle size or rat gender. Elimination kinetics showed that a small amount of ZnO nanoparticles was excreted via the urine, while most of nanoparticles were excreted via the feces. Transmission electron microscopy and x-ray absorption spectroscopy studies in the tissues showed no noticeable ZnO nanoparticles, while new Zn-S bonds were observed in tissues.
Conclusion
ZnO nanoparticles of different size were not easily absorbed into the bloodstream via the gastrointestinal tract after a single oral dose. The liver, lung, and kidney could be possible target organs for accumulation and toxicity of ZnO nanoparticles was independent of particle size or gender. ZnO nanoparticles appear to be absorbed in the organs in an ionic form rather than in a particulate form due to newly formed Zn-S bonds. The nanoparticles were mainly excreted via the feces, and smaller particles were cleared more rapidly than the larger ones. ZnO nanoparticles at a concentration below 300 mg/kg were distributed in tissues and excreted within 24 hours. These findings provide crucial information on possible acute and chronic toxicity of ZnO nanoparticles in potential target organs.
Introduction
Zinc oxide (ZnO) is one of the most commonly utilized materials in diverse industrial fields such as dyes, paints, pigments, metallurgy additives, rubber, alloys, ceramics, chemical fibers, electronics, catalyst, medical diagnosis, sunscreens, cosmetics, personal care products, and food additives.Citation1–Citation3 The wide range of applications of ZnO is attributed to their unique characteristics, including semiconducting, electrical, optical, catalytic, magnetic, antimicrobial and ultraviolet light absorption properties.Citation3–Citation6 Recently, rapid advances in nanotechnology have contributed to manufacture and control of engineered nanoparticles, which are generally defined as particles in the size range of 1–100 nm in one dimension. To date, a great deal of attention has been focused on nanosized ZnO particles because they possess unique features, which are completely different from bulk-sized ZnO nanoparticles. As the particle size of ZnO decreases, its chemical reactivity, transparency, ultraviolet-filtering efficiency, and dispersion properties also increase, which are favorable features for commercial application.Citation7,Citation8
However, study of the toxicological effects of ZnO nanoparticles in biological systems has lagged behind the speed of their mass production and applications in various fields. Furthermore, ZnO is generally considered to be a material with low toxicity, because zinc is an essential trace element in the human body and is commonly present in foods or added as a nutritional supplement, so zinc attracts little attention during assessment of toxicity of nanoparticles.Citation9 It should be noted that small-sized particles have a higher proportion of atoms on their surfaces than do bulk-sized particles, so the former is more reactive and responsive than the latter. However, this raises concern about the possible biological activity of nanosized particles that may behave differently from their bulk-sized counterparts, which may have an adverse effect by interfering with biological functions, presumably due to their large surface area and enhanced reactivity.Citation10
Along with extensive application of ZnO nanoparticles in the industrial field, it is conceivable that the human body may be intentionally or unintentionally exposed to nanoparticles via several possible routes, including oral ingestion, inhalation, intravenous injection, and dermal penetration. Among these, uptake of nanoparticles by the gastrointestinal tract is one of the most important routes.Citation11 To date, almost all in vivo studies of the toxicity of nanoparticles have been focused on acute toxicity or repeated-dose toxicity evaluation via different routes.Citation9,Citation12–Citation15 A few studies have investigated the pharmacokinetics of nanoparticles in whole animals, including absorption, distribution, metabolism, and excretion patterns at the systemic level. Pharmacokinetic study includes the evaluation of accumulating or remaining nanoparticle concentrations in all major tissues after exposure for a certain period of time until all nanoparticles are eliminated.Citation16 Thus, pharmacokinetic study of nanoparticles is of importance in the context of understanding the amount absorbed which enters the systemic circulation and the kinetic profile of clearance by the excretory system following exposure, thus providing clues for the underlying debate on the safety of nanoparticles. Such research can also identify potential target organs for accumulation of ZnO nanoparticles, providing a further tool for investigating toxicity and its mechanism in vivo. To the best of our knowledge, no information is currently available on the pharmacokinetics of ZnO nanoparticles.
The pharmacokinetic profile, biological response, and toxicity of nanoparticles are also strongly affected by their physicochemical properties, such as particle size, surface area, surface chemistry, chemical composition, and stability. One of the critical factors for toxicity is the size of nanoparticles. Citation17 Indeed, recent studies have been focused on the relationship between the size of ZnO nanoparticles and their toxicological effects.Citation9,Citation12,Citation13,Citation18–Citation20 However, most studies have focused on comparing the toxic effects of nanosized particles with those of micron-sized ones, providing less information about toxicity per se, particularly for nanoparticles below 100 nm. Moreover, many researchers have published toxicity data only from in vitro studies, so the impact of particle size on systemic toxicity in vivo remains to be clarified.
This paper describes a series of pharmacokinetic, biodistribution, and elimination studies on ZnO nanoparticles of two different sizes (20 nm and 70 nm) after oral administration to male and female rats, in an attempt to identify the potential target organs relevant for a safety evaluation as well as mechanistic investigation, and to predict any potential harmful effects in the human body. Moreover, their fates in tissues following oral administration, determined by x-ray absorption spectroscopy (XAS) and transmission electron microscopy (TEM), are reported in order to offer new insights into the absorption and distribution of ZnO nanoparticles in target organs.
Materials and methods
Preparation of nanoparticle suspension
ZnO particles 20 nm and 70 nm in size were purchased from Sumitomo (Tokyo, Japan) and American Elements (Los Angeles, CA), respectively. For oral administration of ZnO nanoparticles with a negative surface charge, the nanoparticles were suspended in 20 mM HEPES buffer containing 1% sodium citrate and then dispersed by vortexing for one minute. The final pH of the suspension was 7.3, and 20% of the surface-modified ZnO nanoparticles were used as a stock solution. Before administration, the suspension was vortexed for 10 seconds and then diluted with distilled water.
Characterization of nanoparticles
Powder x-ray diffraction (XRD) patterns for the ZnO nanoparticles, both surface-modified and unmodif ied, were measured using an x-ray diffractometer (D2phaser, Bruker AXS Inc, Madison, WI) with Ni-filtered CuKα radiation. Particle size was determined by scanning electron microscopy (SEM: Hitachi S-4300, Tokyo, Japan) and TEM (JEM-1010, JEOL, Tokyo, Japan). The surface charge (zeta potential) of the ZnO nanoparticles was determined using a zeta potentiometer (Zetasizer Nano ZS system, Malvern Instruments, Worcestershire, UK).
Animals
Five-week-old male and female Sprague-Dawley rats weighing 120–140 g were purchased from G-Bio (Seoul, South Korea). The animals were housed in plastic laboratory animal cages in a ventilated room. The room was maintained at 20°C ± 2°C and 60% ± 10% relative humidity on a 12-hour light/dark cycle. Water and commercial laboratory complete food for rats were available ad libitum. They were acclimatized to this environment for 7 days before receiving experimental treatment. All animal experiments were performed in compliance with the animal and ethics review committee of the Seoul Women’s University.
Dosing and sample collection
Three groups of male and female rats (n = 6 per group) received a single dose of 50, 300, or 2000 mg/kg of ZnO nanoparticles by oral gavage, and one additional group of six rats received an equivalent volume of citrate/HEPES buffer as controls for all the experiments. Changes in body weight and behavior, and possible appearance of symptoms in the rats were carefully recorded every day after administration of the ZnO nanoparticles.
Blood samples were collected via the tail vein at several time points (time zero and hours 0.5, 1, 2, 4, 6, 10, 24, 48, 72, and 96) after oral administration to evaluate the plasma ZnO nanoparticle concentration. The blood samples were centrifuged at 3000 rpm for 15 minutes at 4°C to obtain the plasma. Several pharmacokinetic parameters were estimated using the Kinetica program (version 4.4, Thermo Electron Corporation, Waltham, MA), ie, maximum concentration (Cmax), time to maximum concentration (Tmax), area under the plasma concentration-time curve (AUC), half-life (T1/2), and mean residence time (MRT).
For the tissue distribution study, tissue samples of the brain, heart, kidney, liver, lung, spleen, and testis or ovary were collected at designated times (hours 1 and 6, and days 1, 2, 3, and 7) following euthanasia by CO2. To evaluate the excretion profile, urine and feces were collected using a metabolic cage at hours 4 and 10, and at days 1, 2, 3, 4, 5, 6, 7, 8, 9, 10, and 14 after oral administration.
Sample preparation for ICP-AES analysis
Homogenized biological samples (0.2 g of plasma, total amount of all tissues except liver, and 1 g of liver, urine, and feces) were predigested in 3–10 mL of ultrapure nitric acid overnight and heated at about 160°C. Next, 0.5–1.0 mL of H2O2 was added according to the proportional weight of the samples. Each sample mixture was heated until completely digested. The remaining solution was then removed by heating until the solutions were colorless and clear. The solution were finally diluted to 5 mL with ultrapure water for the plasma sample and 10 mL for the other samples, and filtered at 0.45 μm. The total zinc content was determined using inductively coupled plasma-atomic emission spectroscopy (ICP-AES).
Accuracy and quality control by ICP-AES analysis
In addition to the control of chemical blanks, the zinc concentration in biological samples was checked accurately by assessing the matrix effects, in other words, by standard addition experiments and calculation of recovery, because any representative reference material is not commercially available for ZnO nanoparticles in biological samples. All the tissues, plasma, urine, and feces were spiked with known concentrations of standard zinc solution (0, 1, 5, 10, 30 and 80 μg/mL, Sigma-Aldrich, St Louis, MO) which were also used for the external calibration. The same concentrations of standard ZnO nanoparticles (20 nm and 70 nm) were also added to reference biological samples for the spiking experiments prior to treatment and analysis of the samples, and finally, recovery was calculated.
ICP-AES analysis
Quantitative analysis was carried out using external five-point calibration with internal standard correction spiking experiments. Stock solutions were diluted with 20% ultrapure nitric acid to designated concentrations. Analysis of standards and biological samples was undertaken using ICP-AES (Jobin Yvon Horiba, JY 2000 Ultrace). The instrument operating conditions were as follows: RF power and nebulizer gas flow were set at 1000 W and 0.02 mL per minute of argon, respectively.
TEM study
Representative organs, including the liver and kidney, were collected from three male rats 24 hours after administration of 2000 mg/kg of ZnO nanoparticles. Three rats treated with citrate/HEPES buffer was used as controls. The samples were fixed with modified Karnovsky’s fixative, ie, 2% paraformaldehyde and 2% glutaraldehyde in 0.05 M sodium cacodylate buffer (pH 7.2), post-fixed with 1:1 mixed solution of 2% osmium tetraoxide and 0.1 M sodium cacodylate at 4°C for 2 hours, and then stained with uranyl acetate. The samples were dehydrated with ethanol and subjected to block preparation with Spurr’s resin. The blocks prepared were sectioned using an ultramicrotome (MT-X, RMC, Tucson, AZ). TEM images were observed using a Tecnai F20 instrument at the Korean Basic Science Institute, Gwangju Branch, Korea.
XAS analysis
XAS experiments at the Zn K edge were performed using an extended x-ray absorption fine structure (EXAFS) facility installed at beamline 7C in the Pohang Accelerator Laboratory, Korea. Twenty-four hours after oral administration of 2000 mg/kg of the two different-sized ZnO nanoparticles to three male rats, their kidneys, livers, and spleens were collected. Three rats administered citrate/HEPES buffer were used as controls. All the freeze-dried and homogenized tissue samples and the reference ZnO nanoparticles for comparison were finely ground and packed into a cell 0.2 mm thick with Kapton tape. The XAS data were collected at room temperature in fluorescence mode to detect very small amounts of zinc species in the samples. All the spectra were calibrated by measuring the spectra of zinc metal foil simultaneously with those of the samples. The data analyses were conducted using a standard procedure, as described elsewhere.Citation21 Briefly, the inherent background in the XAS data was removed by fitting a polynomial to the pre-edge region and extrapolating it through the entire spectrum, from which it was subtracted. Next, the resulting EXAFS raw data were Fourier-transformed to obtain the radial distribution function.
Statistical analysis
The data were expressed as the mean ± standard deviation. For statistical analysis, the experimental values were compared with their corresponding controls. One-way analysis of variance in SAS software (Tukey’s test, version 11.0, Cary, NC) was used to illustrate any statistically significant differences between the experimental group and the control group. Statistical significance for all tests was set at P < 0.05.
Results
Characterization of ZnO nanoparticles
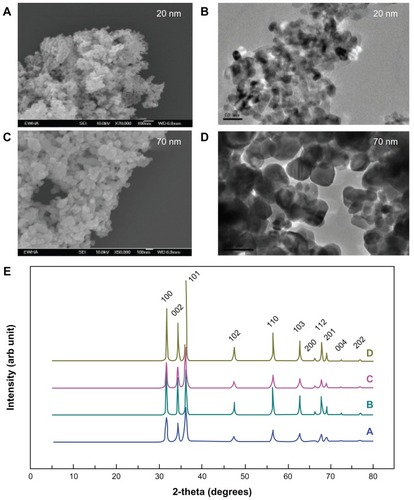
The pharmacokinetics of two different sizes of ZnO nanoparticles (20 nm and 70 nm) were evaluated. The ZnO nanoparticles were capped with citrate molecules, widely used as capping agents, so had a negative surface charge as shown in . The surface charges for the citratemodified nanoparticles were measured at −28.1 mV for the 20 nm size and −33.3 mV for the 70 nm size. SEM and TEM images indicated that they were spherical-shaped, with average diameters of 21 ± 6 nm and 71 ± 19 nm, respectively, and had a narrow size distribution ( and ). XRD patterns for the 20 nm and 70 nm ZnO nanoparticles, whether surface-modified or surface-unmodified showed peaks characteristic of those found in wurtzite-type ZnO structures (PCPDF 05-0664, ). As expected from the particle size, 70 nm ZnO was better crystallized than the 20 nm size, which was further confirmed by sharper powder XRD peaks. Upon citrate coating, no significant change in crystallinity was detected for either the 20 nm or the 70 nm ZnO nanoparticles.
Table 1 Particle size and zeta potential of ZnO nanoparticles
Figure 1 SEM (A and C) and TEM (B and D) images of 20 nm and 70 nm ZnO nanoparticles, respectively. XRD patterns (E) for pristine 20 nm (A), pristine 70 nm (B), citrate-modified 20 nm (C), and citrate-modified 70 nm (D) nanoparticles.
Effects of ZnO nanoparticles on body weight and symptoms
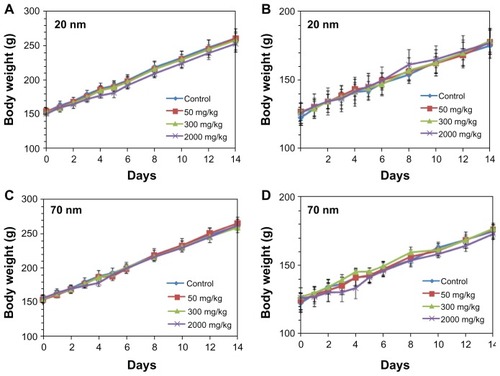
After single-dose oral administration of the different sizes of ZnO nanoparticles, changes in body weight, mortality rate, behavior, and appearance of symptoms were observed for 14 days. The male and female rats administered low (50 mg/kg) and medium (300 mg/kg) doses of ZnO nanoparticles showed no mortality, body weight changes, or abnormal behavior when compared with the control group (). On the other hand, slight loss of body weight and diarrhea were observed in some rats receiving high (2000 mg/kg) doses. However, no statistically significant difference in body weight was found between the controls and the groups administered either size of ZnO nanoparticles.
Figure 2 Body weight gain in male (A and C) and female (B and D) rats treated with 20 nm and 70 nm ZnO nanoparticles, respectively.
Note: The data show no significant difference from the control group (P < 0.05).
Plasma concentration-time curve
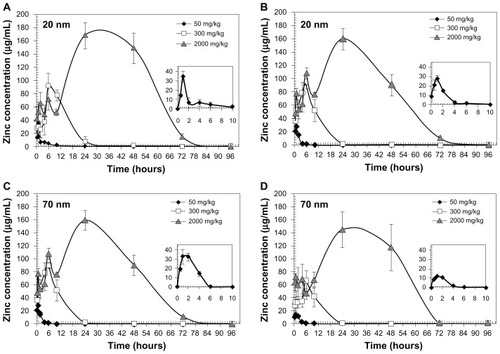
Plasma ZnO nanoparticle concentrations after oral administration to male or female rats were calculated by measuring the zinc level using ICP-AES, as shown in . The plasma concentration-time curve was highly dependent on the dose administered. When 50 mg/kg of 20 nm particles were administered, the arithmetic mean plasma zinc concentration increased slightly at 0.5–2.0 hours post-dosing, followed by decreases in plasma zinc levels. On the other hand, the highest plasma zinc levels were observed at 6 and 24 hours in rats receiving the 300 and 2000 mg/kg doses, but decreased within 24 and 72 hours, respectively. Almost the same results were obtained in rats administered the 70 nm nanoparticles, showing peaks at hours 1, 6, and 24 for the 50, 300, and 2000 mg/kg doses, respectively.
Figure 3 Plasma concentrations of ZnO nanoparticles after single-dose oral administration in male (A and C) and female (B and D) rats.
Notes: ZnO nanoparticle levels were measured by ICP-AES. The data are presented as increased zinc levels after subtraction of the basal zinc level in the control group. Insert: higher magnification of plasma concentration-time curve for the 50 mg/kg dose.
The pharmacokinetic parameters following oral administration are presented in . All parameters increased as the dose administered increased. When the Tmax values for the 20 nm and 70 nm ZnO nanoparticles were compared, their value increased in a dose-dependent manner, but no correlation with particle size or gender was observed. Values of the other parameters, such as Cmax, AUC, MRT, and T1/2, for the two different-sized nanoparticles were determined to be slightly greater for male rats than for female rats. When only the effect of particle size was compared, it was estimated that AUC and MRT values for the 20 nm nanoparticles were slightly higher than those for the 70 nm nanoparticles. There was no clear effect of particle size or gender on pharmacokinetics in any of the study groups.
Table 2 Pharmacokinetic parameters of different-sized ZnO nanoparticles in rats
Based on AUC values calculated from the increases in zinc levels, the total amount of ZnO nanoparticles in the blood circulation could be determined (). Absorption (%) was calculated as follows. AUC values in the total volume of plasma were divided by the total amount of zinc administered (converted from ZnO dose). About 6.48%–32.49% of the total amount of administered ZnO nanoparticles was absorbed into the blood stream. As expected, the amount absorbed increased as the dose administered increased. In all the treatment groups, absorption of ZnO nanoparticles was slightly higher in male rats than in female rats, although this difference was not statistically significant. In terms of particle size, absorption for the 20 nm size nanoparticles was slightly higher than that for the 70 nm nanoparticles in all groups.
Table 3 Absorption of different-sized ZnO nanoparticles in rats
Tissue distribution
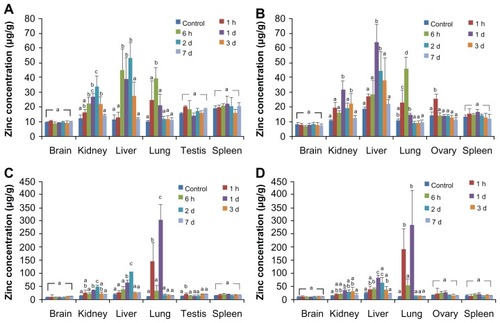
The tissue distribution of ZnO nanoparticles was determined in the brain, kidney, liver, lung, spleen, and ovary or testis by measuring the total zinc level with ICP-AES ( and Supplementary Figure S1). When the concentrations of total zinc levels were compared between the experimental groups and the controls, no statistically significant increases were observed in the brain or spleen at all time points regardless of the nanoparticle size administered. When 50 mg/kg and 300 mg/kg ZnO nanoparticle doses were administered, elevated zinc levels were observed in the liver, lung, and kidney in 6–24 hours, but returned to normal levels afterwards (Supplementary Figure S1). However, high accumulation of ZnO nanoparticles was evident in the liver and kidney within 2 and 3 days, respectively, when 2000 mg/kg of either ZnO nanoparticle size was administered, but were not detected at 7 days after administration (). No remarkable difference in distribution in the liver and kidney was seen according to particle size or gender. In the lung, high amounts of ZnO nanoparticles of both sizes were found within 24 hours, especially at the 2000 mg/kg dose, but the elevated zinc level decreased after 2 days. In the reproductive system, zinc levels were elevated in the testis or ovary at one hour after administration in some cases ( and Supplementary Figure S1). Twenty-four hours after administration, about 8.15% and 11.22% of 20 nm ZnO nanoparticles were detected in the esophagus, stomach, and intestine in males and females, respectively, while 7.44% and 13.37% of the 70 nm particles were found in the digestive system in males and females, respectively. Less than 0.1% of ZnO nanoparticles were detected in these organs at 7 days after administration, regardless of size.
Figure 4 Tissue distribution of ZnO nanoparticles in rats after single-dose oral administration of 2000 mg/kg 20 nm and 70 nm in male (A and C) and female (B and D) rats, respectively.
The total increase in tissue zinc levels is summarized in . Significantly elevated zinc levels were observed in the kidney, liver, and lung after administration of the 2000 mg/kg dose compared with controls. A slightly higher amount of ZnO nanoparticles was detected in all organs in the male rats compared with that in the female rats, but the difference did not reach statistical significance. The difference in tissue ZnO nanoparticle distribution according to particle size was also not statistically significant.
Table 4 Tissue distribution of different-sized ZnO nanoparticles
Fate of ZnO nanoparticles in tissues
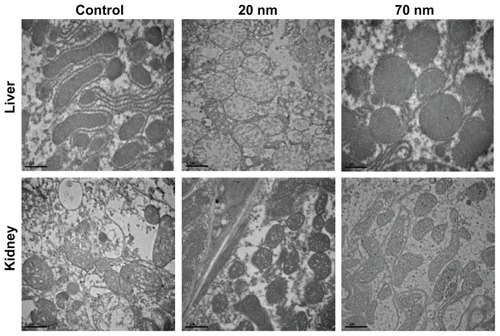
In order to evaluate and confirm the tissue accumulation and distribution of orally administered ZnO nanoparticles, we carried out TEM analysis on organs dissected from the rats administered ZnO. A high dose of the two different sizes of ZnO nanoparticles was administered to ensure their distribution in the liver and kidney, as shown in and . Accumulation, dissolution, and phase-transformation of the ZnO nanoparticles were captured in TEM images. As shown in , all the TEM images of organs treated with ZnO nanoparticles looked similar to the control groups, and no ZnO nanoparticles were found.
Figure 5 TEM images of the liver and kidney collected 24 hours after oral administration with two different-sized ZnO nanoparticles.
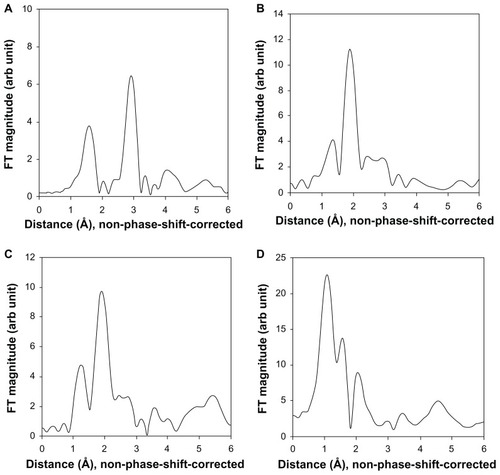
We also examined the XAS of representative organ samples including from the liver, kidney, and spleen after oral administration, in comparison with the reference ZnO nanoparticles, because XAS analysis could provide useful information on the local structure around the zinc atoms in each organ. The XAS data for each organ using ZnO nanoparticles as a reference are shown in . The radial distribution function was obtained by Fourier transformation of extended x-ray absorption fine structure spectra. ZnO nanoparticles 20 nm in size showed well developed Fourier transform peaks at 1.5 Å and 3.0 Å in radial distribution function (nonphase shift-corrected), which can be attributed to the Zn-O and Zn-Zn bonds in the wurtzite structure, respectively. This finding is in good agreement with XRD data for the ZnO nanoparticles (). In the radial distribution function of the liver sample after oral administration, two characteristic Fourier transform peaks were observed at around 1.5 Å and 2.0 Å. The first and second peaks can be indexed to Zn-O and Zn-S bonds, respectively. The spectral features for the kidney sample were very similar to those observed in the liver sample, where the two Fourier transform peaks are attributed to Zn-O and Zn-S bonds. In the radial distribution function of the spleen, the first two peaks below 2.0 Å and at 2.0 Å are assigned as Zn-O neighbors and Zn-S bonds, respectively. It is noteworthy that the organ samples did not show the Zn-Zn bonds which were clearly found in the reference ZnO nanoparticles. In the radial distribution function of all the biological samples, Fourier transform peaks observed above 2.5 Å were from the background and/or multiple scatterings.
Figure 6 Fourier transform XAS spectra (radial distribution function) for 20 nm ZnO nanoparticles before oral administration (A), and liver (B), kidney (C), and spleen (D) at 24 hours after oral administration.
Excretion
The excretion profiles for the ZnO nanoparticles via urine and feces were studied by measuring total zinc levels on ICP-AES, as shown in . When 50 mg/kg and 300 mg/kg of ZnO nanoparticles were administered, elevated zinc levels were found in the urine 4–24 hours after oral treatment, followed by dramatic decreases in zinc levels in the samples. However, the highest zinc level was detected in the urine after 2–3 days, then gradually decreased at 6–7 days when 2000 mg/kg of the 20 nm and 70 nm ZnO nanoparticles were administered, regardless of gender. On the other hand, a significant increase in zinc levels was observed in the feces 4–24 hours after treatment when 50 mg/kg and 300 mg/kg doses were administered. In rats treated with 2000 mg/kg of 20 nm ZnO nanoparticles, a massive amount of zinc was detected primarily in the feces for 1–2 days after administration, while excretion via the feces continued for 3 days in rats administered a 2000 mg/kg dose of 70 nm ZnO nanoparticles.
Figure 7 Excretion profile of 20 and 70 nm ZnO nanoparticles via urine and feces; 20 nm and 70 nm ZnO nanoparticles in urine in male (A and C) and female (B and D) rats, respectively; 20 nm and 70 nm ZnO nanoparticles in feces in male (E and G) and female (F and H), respectively.
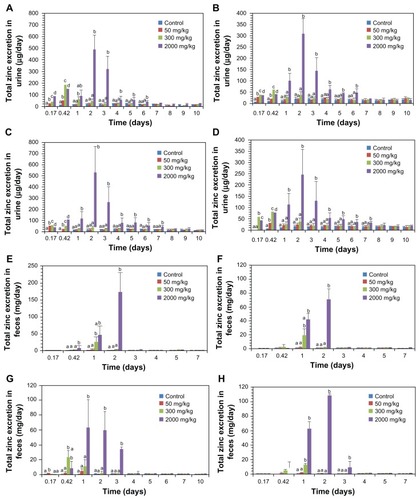
Excretion values for ZnO nanoparticles based on these results are presented in . The percentage excretion was calculated by dividing the total increased zinc level in urine or feces by the total amount of administered zinc converted from the ZnO dose. Of the total amount of ZnO nanoparticles administered, 0.32%–1.47% was cleared via the urine, while most was excreted via the feces. The ZnO nanoparticle excretion rate via the urine decreased as the dose administered was increased, while excretion via the feces increased in a dose-dependent manner. Noteworthy is that a slightly higher rate of ZnO nanoparticle excretion via the urine was observed in male rats than in female rats, independent of particle size.
Table 5 Excretion values of different-sized ZnO nanoparticles via urine and feces in rats
Discussion
This study describes the absorption, tissue distribution, and excretion of orally administered ZnO nanoparticles of two different sizes in male and female rats. ZnO nanoparticles sized 20 nm and 70 nm were selected because nanoparticles are generally defined as being in the size range of 1–100 nm. The ZnO nanoparticles were capped with citrate to obtain nanoparticles with an evenly modified negatively charged surface, thereby minimizing the effect of surface charge on kinetic behavior. Citrate was also used to obtain a well dispersed suspension of ZnO nanoparticles for oral administration.Citation22 It is well known that citrates and citric acid are important ligands for metal ions in biological systems, forming strong bonds with various ions, such as Zn2+, Fe3+, Ca2+, Mg2+ and Ag+.Citation23 In particular, citrate ions are characterized by three negatively charged centers under normal physiological conditions (pH about 7.4), so zinc citrate complexes on the surfaces of the ZnO nanoparticles result in a negative surface charge,Citation24 while the zeta potentials of the pristines in our study were slightly positive (). The two ZnO nanoparticles of different sizes could be easily distinguished from one to another, validating the particle sizes of samples selected for the study.
Body weight change, mortality, behavior, and symptoms were observed after single-dose oral administration for 14 days, and no mortality was found in any of the treated groups. Moreover, no significant body weight loss or symptoms were observed in any of the rats receiving up to 300 mg/kg of 20 nm or 70 nm ZnO nanoparticles, indicating their low in vivo toxicity. In some cases, slight body weight loss was observed in rats administered the 2000 mg/kg dose of ZnO nanoparticles, but this did not reach statistical significance. Therefore, it seems that the two different sized ZnO nanoparticles did not cause any serious oral toxicity after single-dose administration.
After oral administration, a rapid decrease in the plasma zinc concentration over 6 hours was noted in rats receiving the 50 mg/kg dose, but the plasma zinc level in rats treated with the 300 mg/kg and 2000 mg/kg doses gradually decreased within 24 and 72 hours, respectively, indicating that high-dose ZnO nanoparticles were slowly distributed to the tissues. This result also suggests that the 2000 mg/kg dose could be retained for longer in the body than the lower doses, as indicated by MRT and T1/2 values (). Thus, dose is an important factor influencing absorption, tissue distribution, and residence time. In terms of gender differences, both sizes of ZnO nanoparticles seemed to be slightly better absorbed in male rats than in female rats (). In addition, small particles in the order of 20 nm were likely to reach the circulation more easily than the 70 nm particles (). Absorption for the 20 nm and 70 nm ZnO nanoparticles was in the range of 6.48%–32.49%. The capacity of the body to absorb ZnO nanoparticles may be limited because absorption of approximately 30% appeared to be maximal regardless of gender or particle size when the high dose of 2000 mg/kg was administered. This is probably due to the fact that the uptake of zinc is controlled by specific receptors such as metal-binding proteins, as explained in XAS study session.
The plasma concentration-time curve is consistent with the tissue distribution profile for both particle sizes. As shown in Supplementary Figure 1, significantly increased zinc levels were detected in the rat kidney, liver, and lung within 6 hours of administration for the 50 mg/kg dose, followed by a decrease in zinc levels, suggesting that a low dose of ZnO nanoparticles is rapidly distributed to the organs and does not accumulate in these tissues. When the medium 300 mg/kg dose was administered, zinc levels increased in the kidney, liver, and lung within 6–24 hours, but returned to normal 24 hours after administration (Supplementary Figure 1), indicating pharmacokinetic behavior quite similar to that of the low dose of 50 mg/kg. On the other hand, the tissue distribution kinetic profile of the low dose was found to be different from that in rats given the 2000 mg/kg dose. As shown in , zinc levels were highest in the lung, liver, and kidney at 24 hours and at 2 and 3 days, respectively, following oral administration, without any apparent effect of particle size. Therefore, the results can be summarized as follows. No statistically significant difference in tissue distribution was found between the groups treated with 20 nm and 70 nm ZnO nanoparticles, although the 70 nm particles seemed to accumulate more and be retained for longer in the lung than were the 20 nm particles (). The kidney, liver, and lung would be the possible target organs for accumulation of ZnO nanoparticles in the cases of the two different sizes, ie, 20 nm and 70 nm. Also, an increased zinc level in the kidney indicates that the renal pathway might play a role in their clearance. ZnO nanoparticles were detected in the reproductive organs only one hour after administration, but not found afterwards, so their toxicity in the ovary and testis seems to be low. The zinc level in all organs from male rats was found to be slightly higher than that in the organs from female rats (), which is consistent with the plasma concentration-time curve () and AUC values (). However, no statistically significant gender difference in tissue distribution was seen, indicating that there is no gender effect of ZnO nanoparticles in terms of absorption and distribution. It is important to note that the zinc level in all the organs decreased to normal levels, 7 days after administration. Furthermore, ZnO nanoparticles were not detected in the gastrointestinal system after the same observation period, suggesting that even a 2000 mg/kg dose of ZnO nanoparticles does not accumulate in any specific tissue after 7 days.
Most tissue distribution studies of other nanoparticles have demonstrated that nanoparticles are distributed to the liver and spleen. For example, the tissue distribution of silver nanoparticles after intravenous injection was recently shown to occur in a size-dependent manner, with 20 nm particles distributed primarily to the liver, followed by the kidney and spleen, whereas those with 80 nm and 110 nm were mainly found in the spleen, followed by the liver and lung.Citation25 PEG-coated gold nanoparticles 5 nm and 10 nm in size accumulated in the liver, but 30 nm particles were distributed in the spleen after intraperitoneal injection.Citation26 Magnetic iron oxide nanoparticles are also distributed to the liver and spleen after intragastric administration.Citation27 For titanium dioxide with a rutile-type structure, particles 20 nm in size accumulate mainly in the liver and spleen after intravenous injection.Citation28 Fluorescence dye-labeled silica nanoparticles have also been reported to become trapped in the liver and spleen in a size-dependent manner.Citation29 Both mesoporous silica and PEGylated silica nanoparticles of different particle sizes (80–360 nm) were also found to be distributed mainly in the liver and spleen.Citation30 Summarizing all these findings, it seems likely that phagocytosis by macrophages occurring actively in these two organs plays an important role in the uptake of these nanoparticles in vivo. However, the fact that ZnO nanoparticles were detected in the liver, lung, and kidney, but not in the spleen, suggests that the macrophage is not the only entry route for ZnO nanoparticles into the tissues. This is likely to be closely related to the ionization properties of ZnO nanoparticles following oral administration as observed by TEM () and XAS (), which showed no ZnO-like nanoparticles and formation of new Zn-S bonds, respectively, in the tissues. It has been reported that citrate-coated silver nanoparticles accumulate mainly in the liver, lung, and kidney after intravenous injection, which is consistent with our results.Citation31 Even with oral administration, silver nanoparticles accumulate mostly in the liver and kidney after 28 days of repeated oral exposure.Citation32 The tendency of ZnO nanoparticles to distribute in tissue in a manner similar to that of silver nanoparticles might be associated with the enhanced dissolution of nanoparticles, thereby forming metal ions in a living system.Citation33 According to radioactive ZnO experiments, nanoparticles primarily showed retention in the lung, followed by retention in the liver and kidney after intravenous administration,Citation34 which again is very consistent with our results.
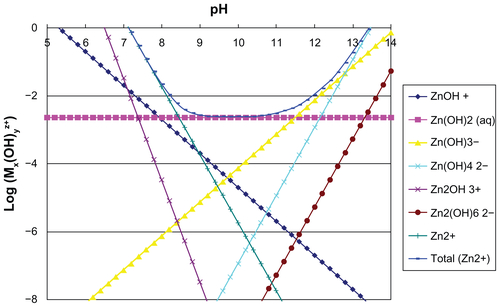
Given that zinc oxide is rather soluble in neutral and weakly acidic conditions (Supplementary Figure S2), it would be expected that orally administered ZnO nanoparticles are readily dissolved under gastric conditions, producing zinc cations. Although the dissolved amount of ZnO nanoparticles depends on experimental conditions such as particle size, specific surface area, dose, and retention time in the stomach or intestine, ZnO nanoparticles to a certain degree can be expected to dissolve during the digestion process. On the other hand, it has also been reported that particulate uptake in the intestinal tract can be mediated by M cells (specialized phagocytic enterocytes) and normal intestinal enterocytes,Citation35 so the possibility of ZnO particle uptake cannot be excluded. However, ZnO nanoparticles could not be observed in the TEM images of the liver and kidney (), whereas accumulation of ZnO nanoparticles was evident on ICP-AES analysis (), implying an ionized fate in the tissues.
Our XAS results in rats suggest that the ZnO nanoparticles dissolved into zinc ions after oral administration because all the Zn-Zn bonds were not detected in organs such as the liver, kidney, and spleen. If the ZnO nanoparticle maintains its crystal lattice structure in the organs, the Zn-Zn peak should be observed at around 3.0 Å in the radial distribution function (). Therefore, it is highly plausible that ZnO nanoparticles are dissolved in the stomach to form Zn2+ ions given the pH value in the stomach is acidic enough to dissolve them. New peaks in radial distribution function due to the formation of Zn-S bonds could be assigned as zinc-ligand interactions between zinc ions and proteins, such as metallothionein, with sulfur-rich ligands, which is consistent with previous evidence for zinc ions bonding to sulfur in the liver as determined by XAS analysis.Citation36 It is generally known that metallothionein, a cysteine-rich metal-binding protein, is assigned a role in zinc absorption and excretion.Citation37 The absence of Zn-Zn bonds in the radial distribution function clearly indicates that ZnO nanoparticles with a wurtzite structure are absent in each organ, which is consistent with the TEM studies (). It is worth highlighting that a Zn-S peak was also found in spleen tissue treated with ZnO nanoparticles, whereas no significant accumulation was confirmed in the tissue distribution study ( and Supplementary Figure S1). This new result suggests that Zn-S interaction plays an important role in the uptake of ZnO nanoparticles in all tissues, although their increase was not significantly different from that in the control group. Therefore, it can be concluded that orally administered ZnO nanoparticles are mostly dissolved in the stomach to form Zn2+ ions, and are then taken up in the tissues by interaction between zinc and sulfur-containing ligands in proteins. The role of dissolved zinc ions in the toxicity assessment of ZnO nanoparticles has already been reported by many researchers, even under cell culture conditions,Citation38–Citation41 and support our results.
The excretion kinetics profile for ZnO nanoparticles showed that only a small amount (0.32%–1.47%) of the nanoparticles administered were excreted via the urine, and that the majority (48.55%–97.12%) was excreted directly via feces without any significant gender difference (). In particular, urinary excretion was still determined to be low at 1.02%–13.39% when the excretion rate was calculated on the basis of the total amount of ZnO nanoparticles absorbed (AUC values). This finding suggests that not only does fecal excretion play an important role in elimination, but also that biliary excretion may be involved in the clearance of ZnO nanoparticles from the body when they are administered orally. This result also confirms that a small amount of orally administered ZnO nanoparticles are absorbed into the body, implying that most of them were not able to be absorbed and were cleared directly from the body. Meanwhile, the amount of ZnO nanoparticles excreted via the urine was slightly higher in male rats than in female rats (). It has been reported that most orally administered silver nanoparticles are not absorbed in the gastrointestinal tract and are excreted directly via the feces, showing extremely low silver levels in the urine,Citation31,Citation32 which is in good agreement with our results. It seems that the dissolution property of both ZnO and silver nanoparticles into ions contributes to the similar pattern of tissue distribution as well as the excretion pathway. On the other hand, the kidney was found to be the main excretion pathway for 20 nm titanium dioxide nanoparticles rather than fecal excretion.Citation28 Rhodamine B isothiocyanate-labeled silica nanoparticles were found to be cleared via the urine and bile.Citation29
In terms of the excretion profiles for the two differentsized ZnO nanoparticles, the 20 nm particles were cleared through the urine and feces over 6 and 2 days, respectively, while excretion of the 70 nm particles via urine and feces continued for 7 and 3 days, respectively, suggesting that the small ZnO nanoparticles tend to be more rapidly cleared than the larger ones. A difference in clearance profile depending on particle size has been reported elsewhere, ie, 50 nm fluorescently labeled silica nanoparticles were reported to be excreted more rapidly via the urine and feces than were 100 nm and 200 nm particles.Citation29 Based on our findings and previous results reported in the literature, the size-dependent elimination kinetics of these particles is closely associated with the nanosize effect, such as high dissolution, large surface area, and high reactivity.
Conclusion
The 20 nm and 70 nm citrated-capped ZnO nanoparticles used in this study were not easily absorbed into the bloodstream via the gastrointestinal tract after single-dose oral administration. A tissue distribution study showed accumulation of both sizes of ZnO nanoparticles in the liver, lung, and kidney, without any statistically significant association with gender or particle size, even when a high dose of 2000 mg/kg was administered. According to our TEM and XAS studies in tissues following oral administration, ZnO nanoparticles appear to be absorbed into organs in the form of zinc ions rather than in particulate form as a result of forming new Zn-S bonds, suggesting not only a role of interaction between zinc ions and sulfur-containing ligands in their absorption, but also a toxic potential of zinc ions when administered in large doses. The nanoparticles used in this study were excreted mainly via the feces, suggesting the possibility of biliary excretion, and smaller particles were cleared more rapidly than larger ones. ZnO nanoparticle doses below 300 mg/kg were distributed in the tissues and excreted within 24 hours, implying low toxicity. These findings provide crucial information for estimating the potential acute and chronic toxicity of ZnO nanoparticles in likely target organs.
Acknowledgment
This research was supported by a grant (10182 KFDA991) from the Korea Food and Drug Administration in 2010.
Disclosure
The authors report no conflicts of interest in this work.
Supplementary figures
Figure S1. Tissue distribution of ZnO nanoparticles in rats after single dose oral administration of 50 mg/kg and 300 mg/kg. 50 mg/kg and 300 mg of 20 nm in male (A and B) and female (C and D). 50 mg/kg and 300 mg of 70 nm in male (E and F) and female (G and H) rats, respectively.
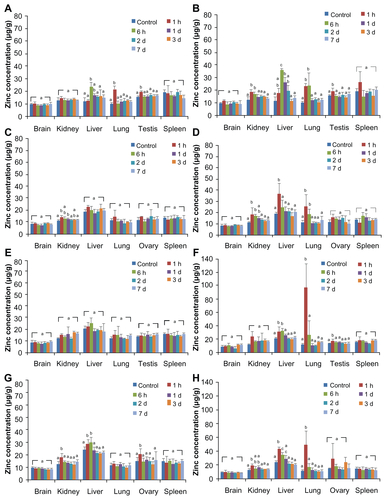
Figure S2. Solubility diagram of zinc cations in aqueous solution with respect to pH.
References
- DjurisicABLeungYHOptical properties of ZnO nanostructuresSmall2006294496117193149
- De BerardisBCivitelliGCondelloMExposure to ZnO nanoparticles induces oxidative stress and cytotoxicity in human colon carcinoma cellsToxicol Appl Pharmacol2010246116127
- FanZLuJGZinc oxide nanostructures: synthesis and propertiesJ Nanosci Nanotechnol200551561157316245516
- QianJLThe surface properties and photocatalytic activities of ZnO ultrafine particlesAppl Surf Sci2011180308314
- SuYKPengSMJiLWUltraviolet ZnO nanorod photosensorsLangmuir20092660360619894681
- KumariLLiWZSynthesis, structure and optical properties of zinc oxide hexagonal microprismsCryst Res Technol201045311315
- BaekMKimMKChoHJFactors influencing the cytotoxicity of zinc oxide nanoparticles: particle size and surface chargeJ Phys Conf Ser2011304012044
- SokoharaSIshidaMVisible luminescence and surface properties of nanosized ZnO colloids prepared by hydrolyzing zinc acetateJ Phys Chem B19981021016910175
- WangBFengWWangMAcute toxicological impact of nano- and submicro-scaled zinc oxide powder on healthy adult miceJ Nanopart Res200810263276
- OberdorsterGOberdorsterEOberdorsterJNanotoxicology: an emerging discipline evolving from studies of ultrafine particlesEnviron Health Perspect200511382383916002369
- HillyerJFAlbrechtRMGastrointestinal persorption and tissue distribution of differently sized colloidal gold nanoparticlesJ Pharm Sci2001901927193611745751
- PasupuletiSAlapatiSGanapathySToxicity of zinc oxide nanoparticles through oral routeToxicol Ind Health10272011 [Epub ahead of print.]
- WangBFengWYWangTCAcute toxicity of nano- and micro-scale zinc powder in healthy adult miceToxicol Lett200616111512316165331
- FabianELandsiedelRMa-HockLTissue distribution and toxicity of intravenously administered titanium dioxide nanoparticles in ratsArch Toxicol20088215115718000654
- KimYSKimJSChoHSTwenty-eight-day oral toxicity, genotoxicity, and gender-related tissue distribution of silver nanoparticles in Sprague-Dawley ratsInhal Toxicol20082057558318444010
- LiSDHuangLPharmacokinetics and biodistribution of nanoparticlesMol Pharm2008549650418611037
- ChoiSJHCJEffect of physico-chemical parameters on the toxicity of inorganic nanoparticlesJ Mater Chem20112155475554
- NairSSasidharanADivya RaniVVRole of size scale of ZnO nanoparticles and microparticles on toxicity toward bacteria and osteoblast cancer cellsJ Mater Sci Mater Med200920S235S24118716714
- MoosPJChungKWoessnerDZnO particulate matter requires cell contact for toxicity in human colon cancer cellsChem Res Toxicol20102373373920155942
- LinWXuYHuangCCToxicity of nano- and micro-sized ZnO particles in human lung epithelial cellsJ Nanopart Res2009112539
- PaekSMJungHParkMAn inorganic nanohybrid with high specific surface area: TiO2-pillare MoS2Chem Mater20051734923498
- LeeuwenburghSCAnaIDJansenJASodium citrate as an effective dispersant for the synthesis of inorganic-organic composites with a nanodispersed mineral phaseActa Biomater2010683684419751849
- ParkinsonJASunHNew approach to the solution chemistry of bismuth citrate antiulcer complexesChem Commun19988881882
- XuXWangZLOne-dimensional ZnO nanostructures: solution growth and functional propertiesNano Res2011410131098
- LankveldDPOomenAGKrystekPThe kinetics of the tissue distribution of silver nanoparticles of different sizesBiomaterials2010318350836120684985
- ZhangXDWuDShenXSize-dependent in vivo toxicity of PEG-coated gold nanoparticlesInt J Nanomedicine201162071208121976982
- WangJChenYChenBPharmacokinetic parameters and tissue distribution of magnetic Fe(3)O(4) nanoparticles in miceInt J Nanomedicine2010586186621042548
- XieGWangCSunJZhongGTissue distribution and excretion of intravenously administered titanium dioxide nanoparticlesToxicol Lett2011205556121600967
- ChoMChoWSChoiMThe impact of size on tissue distribution and elimination by single intravenous injection of silica nanoparticlesToxicol Lett200918917718319397964
- HeQZhangZGaoFIn vivo biodistribution and urinary excretion of mesoporous silica nanoparticles: effects of particle size and PEGylationSmall2011727128021213393
- ParkKParkEJChunIKBioavailability and toxicokinetics of citrate-coated silver nanoparticles in ratsArch Pharm Res20113415315821468927
- LoeschnerKHadrupNQvortrupKDistribution of silver in rats following 28 days of repeated oral exposure to silver nanoparticles or silver acetatePart Fibre Toxicol201181821631937
- LubickNNanosilver toxicity: ions, nanoparticles – or both?Environ Sci Technol200842861719192768
- ChenJKShihMHPeirJJThe use of radioactive zinc oxide nanoparticles in determination of their tissue concentrations following intravenous administration in miceAnalyst20101351742174620505857
- HussainNJaitleyVFlorenceATRecent advances in the understanding of uptake of microparticulates across the gastrointestinal lymphaticsAdv Drug Deliv Rev20015010714211489336
- BeaucheminSHesterbergDNadeauJSpeciation of hepatic Zn in trout exposed to elevated waterborne Zn using X-ray absorption spectroscopyEnviron Sci Technol2004381288129515046328
- StarcherBCGlauberJGMadarasJGZinc absorption and its relationship to intestinal metallothioneinJ Nutr1980110139113976991653
- SongWZhangJGuoJRole of the dissolved zinc ion and reactive oxygen species in cytotoxicity of ZnO nanoparticlesToxicol Lett201019938939720934491
- BrunnerTJWickPManserPIn vitro cytotoxicity of oxide nanoparticles: comparison to asbestos, silica, and the effect of particle solubilityEnviron Sci Technol2006404374438116903273
- XiaTKovochichMLiongMComparison of the mechanism of toxicity of zinc oxide and cerium oxide nanoparticles based on dissolution and oxidative stress propertiesACS Nano200822121213419206459
- DengXLuanQChenWNanosized zinc oxide particles induce neural stem cell apoptosisNanotechnology20092011510119420431