 ?Mathematical formulae have been encoded as MathML and are displayed in this HTML version using MathJax in order to improve their display. Uncheck the box to turn MathJax off. This feature requires Javascript. Click on a formula to zoom.
Abstract
Background
The objective of this study was to clarify the intermolecular interaction between antibacterial copper nanoparticles (Cu NPs) and sodium alginate (NaAlg) by Fourier transform infrared spectroscopy (FT-IR) and to process the spectra applying two-dimensional infrared (2D-IR) correlation analysis. To our knowledge, the addition of NaAlg as a stabilizer of copper nanoparticles has not been previously reported. It is expected that the obtained results will provide valuable additional information on: (1) the influence of reducing agent ratio on the formation of copper nanoparticles in order to design functional nanomaterials with increased antibacterial activity, and (2) structural changes related to the incorporation of Cu NPs into the polymer matrix.
Methods
Cu NPs were prepared by microwave heating using ascorbic acid as reducing agent and NaAlg as stabilizing agent. The characterization of synthesized Cu NPs by ultraviolet visible spectroscopy, transmission electron microscopy (TEM), electron diffraction analysis, X-ray diffraction (XRD), and semiquantitative analysis of the weight percentage composition indicated that the average particle sizes of Cu NPs are about 3–10 nm, they are spherical in shape, and consist of zerovalent Cu and Cu2O. Also, crystallite size and relative particle size of stabilized Cu NPs were calculated by XRD using Scherrer’s formula and FT from the X-ray diffraction data. Thermogravimetric analysis, differential thermal analysis, differential scanning calorimetry (DSC), FT-IR, second-derivative spectra, and 2D-IR correlation analysis were applied to studying the stabilization mechanism of Cu NPs by NaAlg molecules. The minimum inhibitory concentration (MIC) and minimum bactericidal concentration (MBC) of stabilized Cu NPs against five bacterial strains (Staphylococccus aureus ATCC 6538P, Escherichia coli ATCC 25922 and O157: H7, and Salmonella enterica serovar Typhimurium ATCC 13311 and 14028) were evaluated with macrodilution, agar dilution plate count, and well-diffusion methods.
Results
On the basis of the semiquantitative analysis, there was a direct correlation between the reducing agent ratio and the percentage of zerovalent Cu. This was confirmed with the statistical analysis of population of Cu NPs from TEM micrographs. At lower reducing agent ratios, two phases coexist (Cu2O and zerovalent Cu) due to incomplete reduction of copper ions by the reducing agent; however, at higher reducing agent ratios, the Cu NPs consist mainly of zerovalent Cu. Crystallite size and relative particle size of stabilized Cu NPs showed considerable differences in results and tendencies in respect to TEM analysis. However, the relative particle size values obtained from FT of XRD data agreed well with the histograms from the TEM observations. From FT results, the relative particle size and reducing agent ratio of stabilized Cu NPs showed an inverse correlation. The incomplete reduction of copper ions at lower reducing agent ratios was also confirmed by DSC studies. FT-IR and 2D-IR correlation spectra analysis suggested the first event involved in the stabilization of Cu NPs is their electrostatic interaction with –C=O of carboxylate groups of NaAlg, followed by the interaction with the available O–C–O−, and finally with the –OH groups. Bacterial susceptibility to stabilized nanoparticles was found to vary depending on the bacterial strains. The lowest MIC and MBC of stabilized Cu NPs ranged between 2 mg/L and 8 mg/L for all studied strains. Disk-diffusion studies with both E. coli strains revealed greater effectiveness of the stabilized Cu NPs compared to the positive controls (cloxacillin, amoxicillin, and nitrofurantoin). S. aureus showed the highest sensitivity to stabilized Cu NPs compared to the other studied strains.
Conclusion
Cu NPs were successfully synthesized via chemical reduction assisted with microwave heating. Average particle size, polydispersity, and phase composition of Cu NPs depended mainly on the reducing agent ratio. Likewise, thermal stability and antibacterial activity of stabilized Cu NPs were affected by their phase composition. Because of the carboxylate groups in polymer chains, the structural changes of stabilized Cu NPs are different from those of NaAlg. NaAlg acted as a size controller and stabilizing agent of Cu NPs, due to their ability to bind strongly to the metal surface. Our study on the stabilizing agent–dependent structural changes of stabilized NPs is helpful for wide application of NaAlg as an important biopolymer.
Introduction
A major topic in the synthesis of inorganic-organic compounds is the combination of active components. A hybrid material is a material that includes two moieties blended on the molecular scale.Citation1 Polymer nanocomposites obtained on the basis of polymers and metal nanostructures are of practical interest today. The integration of nanotechnology and biology provides the opportunity for the development of new nanoscale materials that can be applied to many potential applications in biological science, clinical medicine, and packaging technologies. The post-synthesis stability in terms of shape and size of metal nanoparticles is crucial because the agglomeration of nanoparticles may affect the outcome and interpretation of antibacterial activity results. Dispersed or weakly aggregated nanoparticles in suspension have a more distorted internal structure and different reactivity and rates of surface reactions than strongly aggregated nanoparticles.Citation2,Citation3 Such changes in physicochemical properties may alter the interaction of nanoparticles with bacteria, the bactericidal efficiency, viability, and the minimum inhibitory concentration (MIC)/minimum bactericidal concentration (MBC) values. The immobilization of colloidal metal nanoparticles is not only necessary to prevent aggregation but to provide positional stability to the nanoparticles on a surface, or in a structure, after they have been reduced. Polymer matrices would facilitate efficient immobilization of nanoparticles in order to render composite materials with exceptional properties for a wide range of applications. Stabilization with naturally occurring polymers (also called biopolymers) is an alternative in order to avoid, prevent, or mitigate the agglomeration of nanoparticles (controlling the particle size distribution by steric effect) and promote their long-term air and water stabilities.Citation4–Citation7
Alginate is a naturally occurring polysaccharide obtained from marine brown algae, comprising the linear chain of (1,4)-β-d-mannuronic acid and (1,3)-α-l-guluronic acid,Citation8 which vary in composition and sequence depending on the source of the alginate. Because of its unique properties, including inexpensiveness, biocompatibility, a relatively inert hydrogel environment within the matrix, and a mild room temperature encapsulation process, alginate has attracted intense attention as an important class of biomaterial in recent years.Citation9 Alginate could facilitate the complexation of copper ions to their matrix (by decreasing the mobility of the molecular chains), because of the extensive hydroxyl groups on their structure, which provide more inter- and intramolecular interstices that can selectively trap metal nanoparticles. Therefore, the nanoparticles’ release and mobility will depend (to some extent) on how these particles are associated to biopolymer.
We therefore performed a study aimed at proposing a correlation between infrared (IR) spectra and molecular structure of stabilized copper nanoparticles (Cu NPs) with sodium alginate (NaAlg). Two-dimensional infrared correlation spectroscopy (2D-IR COS) is a well-established analytical technique that provides considerable utility and benefit in various spectroscopic studies of complex systems. Some of the notable features of generalized 2D correlation spectra are: simplification of complex spectra consisting of many overlapped peaks; enhancement of spectral resolution by spreading peaks along the second dimension and establishment of unambiguous assignments through correlation of bands selectively coupled by various interaction mechanisms.Citation10 As well, this paper presents a statistical study based on average nanoparticle size and oxidation states of stabilized Cu NPs, likewise, comparison between average particle size, crystallite size and relative particle size confirms that the synthesis of NPs assisted with microwave heating yields a size weighted smaller particles, in the order of 3–10 nm.
Recent advances in the design and study of metal nanoparticles have revealed biological activity and structural and functional changes induced in bacterial cells. Particular progress has been made in understanding the size, shape, and surface chemistry of metal nanostructures and their influence on biocidal activity.Citation11 It has emerged that multiple factors cooperate to establish a specific antibacterial activity, mainly dependent on the high surface atom density of the nanoparticles, which includes their size and shape,Citation12–Citation14 particle internalization,Citation15,Citation16 agglomeration of metal nanostructures over time on in vitro assays,Citation3,Citation13,Citation17 chemical functionalization of nanoparticles,Citation18,Citation19 concentration of metal,Citation3 types of microorganism and initial number of bacterial cells,Citation3,Citation20,Citation21 and type of assay.Citation22 A secondary aim of this study was to compare the bactericidal effects of stabilized Cu NPs using various bacterial strains, to reveal strain specificities, and to correlate the phases of composition of Cu NPs with antibacterial activity, eventually leading to better utilization of nanoparticles for specific applications.
Materials and methods
Preparation of stabilized Cu NPs
Copper nitrate (Cu[NO3]2) and ascorbic acid (C6H8O6) were obtained from Winkler (Santiago, Chile). Sodium alginate (NaAlg) was obtained from Sigma Aldrich (St Louis, MO). All the reagents were used as received, without further purification, and all the water was nanopure. The synthesis of copper NPs was performed according to Blosi et alCitation23 with modifications, which are reported for the first time herein. The precursor (0.1 M, Cu[NO3]2) was completely dissolved in 100 mL of nanopure water under magnetic stirring. Then this solution was heated to the synthesis temperature (95°C) in a Thomas microwave oven (TH-17DM, 560 W; Rotho, Würenlingen, Switzerland). Once the synthesis temperature was reached, 50 mL of ascorbic acid solution (containing the proper quantities of reducing agent) was added to the hot solution and stirred continuously at 60 rpm. After ascorbic acid addition, the blue solution turned dark green, thus indicating the immediate nucleation of Cu NPs. Finally, the colloidal dispersions were deposited onto NaAlg by microwave heating for 1 hour (88°C). The Cu(NO3)2 and NaAlg amount were kept constant for all stabilized Cu NPs at a molar ratio of 1. The weight loss of stabilized Cu NPs was measured upon drying until constant weight at 110°C. Equilibrium moisture content (%) was calculated as follows:
The synthesis conditions used for producing the different Cu NPs and stabilized Cu NPs are summarized in .
Table 1 Synthesis conditions, average particle size from TEM (nm) and statistical analysis
Characterization of Cu NPs and stabilized Cu NPs
TEM micrographs were obtained using a Jeol (Tokyo, Japan) JEM 1200EXII TEM microscope with 4-Å resolution. Average particle size, standard deviation, and error shown in were calculated on 200 particles by analyzing different micrographs. Histograms were obtained using the OriginLab (Northampton, MA) 8.0 v8.0724 software. An analysis of variance was performed to determine whether the NPs’ size differed significantly. A multiple comparison procedure (multiple range test) was then used to find which means were significantly different at the 95% confidence level. The method used to discriminate among the means was Fisher’s least significant difference procedure. All statistics were obtained using Statgraphics Plus 3.1 software (Manugistics, Rockville, MD). X-ray diffraction (XRD) analysis of the stabilized Cu NPs was performed using a Endeavor diffractometer (D4/MAX-B; Bruker, Karlsruhe, Germany), employing CuKα radiation (at 40 kV and 40 mA). Data were obtained over the range 2θ = 10°–80° using a step size of 0.02° and counting time of 25 seconds per step. Reference intensity ratios methodology from XRD was used in order to assign the phases observed in the X-ray pattern. The crystallite sizes of stabilized Cu NPs were calculated using the Scherrer equation as follows:
where λ is the wavelength of Cu Kα radiation (here λ = 0.1541 nm), B is the calibrated half-width of the peak in radians and θ is the diffraction angle of the three independent peaks of zerovalent Cu from the diffraction patterns. The calculated values of crystallite sizes are listed in . The Fourier method has been also applied to the diffraction data of stabilized Cu NPs in order to calculate the relative size of stabilized Cu NPs, according to the described by Hall et al.Citation24 FT P(r) was calculated using the Origin 8.0 v8.0724 software.
Table 2 Peak position, Miller indices (hkl) and semiquantitative weight percentage composition
Table 3 Crystallite size and relative particle size of stabilized copper nanoparticles (Cu NPs) calculated from Scherrer equation and Fourier transform (FT) of diffraction data
Optical absorption spectra were determined on a PerkinElmer (Waltham, MA) Lambda 35 ultraviolet-visible (UV-vis) spectrophotometer at room temperature. Thermogravimetric analysis (TGA) of stabilized Cu NPs was carried out using a TG 209F3 thermogravimetric analyzer (Netzsch, Selb, Germany). Stabilized Cu NPs were placed in appropriate pans and heated from 35°C to 600°C at 5°C/minute under N2 atmosphere. Differential scanning calorimetry (DSC) studies were conducted on a DSC 204F1 Phoenix differential scanning calorimeter (Netzsch) using an accurately weighed sample (10 mg) in a loosely covered aluminum pan and heated from 50°C to 250°C at 5°C/minute under N2 atmosphere. An empty, loosely covered aluminum pan was used as the reference. The metal content was determined by atomic absorption spectrometry, using a Thermo Solaar M Series AA spectrometer (Thermo Scientific, Waltham, MA).
Fourier transform-infrared (FT-IR), principal component analysis (PCA), and 2D 2D-IR correlation analysis
The FT-IR spectra (resolution of 4 cm−1) were recorded from 4000 to 450 cm−1 and scanned 64 times (transmittance mode), on a Nicolet Nexus spectrometer (Nicolet Instrument, Madison, WI) at room temperature. All spectra were baseline-corrected, smoothed, and normalized on the basis of the internal standard band nearest to 2929 cm−1 due to the –CH2 group, which is not affected by Cu NPs. The number of peaks involved was determined on the basis of the second-derivative FT-IR spectra for the stabilized Cu NPs, in the range 3600–800 cm−1. Curve fitting for the peak deconvolution was performed with OriginPro 8.5.1 software (Microcal, Piscataway, NJ) with the Multiple Peak Fit Tool. The shape of the peak from the absorption bands for NaAlg and stabilized Cu NPs was obtained using Gaussian fit. The reduced chi-squared value for all the deconvoluted curves was χ2 ≥ 0.1. Prior to PCA calculation, the mean centering operation was applied to the data matrix; only the range between 2000 and 800 cm−1 was considered. PCA was performed using Pirouette 3.11 (Infometrix, Tulsa, OK). The 2D correlation spectroscopy and synchronous and asynchronous maps were calculated according to algorithms described by NodaCitation26 and Jung and Noda.Citation25 Data processing and analysis were performed using MATLAB version 7.4.0.287 R2007a (MathWorks, Natick, MA).
Evaluation of antibacterial activity
Staphylococcus aureus (ATCC 6538P), Escherichia coli (ATCC 25922) and Salmonella enterica serovar Typhimurium (ATCC 13311 and 14028) were obtained from the American Type Culture Collection (Manassas, VA). E. coli O157: H7 was obtained from the collection at the Department of Microbiology, Faculty of Biological Sciences, University of Concepcion, Chile. Each strain was stored at −80°C in Luria Bertani broth (10 g of tryptone, 5 g of yeast extract, and 0.5 g of NaCl/L) supplemented with 20% glycerol.
Well-diffusion test
One milliliter of inocula at 107 colony-forming units (CFU)/mL was mixed with warm, melted, autoclaved Mueller Hinton agar and poured into separate plates under aseptic conditions. The plates were covered and allowed to cool. As soon as the agar was partly solidified, the plates were inverted and left for 2 hours. When cooled, three equidistant wells were made at the plate. The wells were made by using a 6-mm puncher that was sterilized with alcohol and flame. Stabilized Cu Nps were dissolved in sterile water (32 mg/L) and then pipetted into the different wells in a sterilized environment at 80 μL using a micropipette. Cloxacillin, nitrofurantoin, and amoxicillin were used as positive controls. Finally, the plates were incubated for 24 hours at 37°C. The inhibition effect was verified by the presence of inhibition zones around the well where the solution was deposited and sized for analysis and comparison.
Minimum inhibitory and bactericidal concentrations
The MIC and MBC were determined by the broth macrodilution methodCitation27 in 1 mL of Mueller Hinton broth. Stabilized Cu NPs were dissolved in sterile water and added to the broth at concentrations of 1, 2, 4, 8, 16, 32, and 64 mg/L. The starting bacterial inocula were 1–5 × 10⁵ CFU/mL, and bacterial populations were monitored at 24 hours by CFU counts on Mueller Hinton agar plates after incubation at 37°C ± 2°C. All tests were performed in duplicate.
Results and discussion
Morphology of Cu NPs
The average particle size distribution of Cu NPs was randomly measured, and the obtained data are represented by histograms in . In general, the morphology of the Cu NPs is of spherical shape.
Figure 1 TEM micrographs of Cu-AA1.0, Cu-AA1.5, Cu-AA2.0 and Cu-AA2.5 NPs, respectively (A, D, F and I); histograms and cumulative counts of particle size of Cu NPs (B, E, G and J); selected area electron diffraction of Cu-AA1.0, Cu-AA2.0, and Cu-AA2.5 NPs, respectively(C, H and K).
Abbreviation: Cu NP, copper nanoparticles.
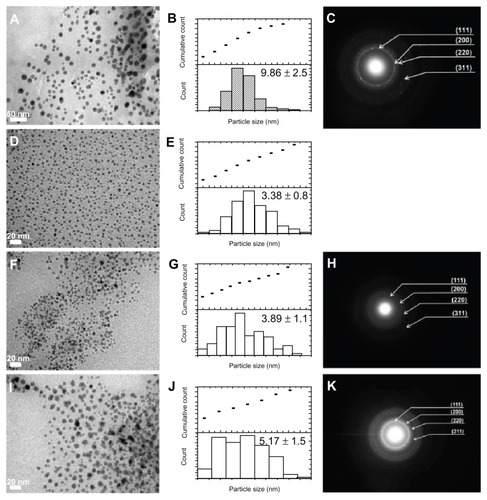
Cu-AA1.0 NPs showed a fairly uniform distribution of well-formed Cu NPs (). More than 50% of these nanoparticles fall within the size range of 3–9 nm in diameter (). The average particle size is around 9.86 nm with large dispersity (~49.0%). shows the corresponding selected area electron diffraction (SAED) of Cu-AA1.0 NPs. Four fringe patterns with plane distances of 2.080 (±0.003), 1.844 (±0.020), 1.262 (±0.013), and 1.091 (±0.011) Å can be observed in the SAED pattern (). They are related to the (1 1 1), (2 0 0), (2 2 0), and (3 1 1) planes of face-centered cubic copper.
As the reducing agent ratio increased to 1.5, the polydispersity decreased significantly to 15.5%. After this ratio, the average particle size and the size dispersion did not change very much. The TEM micrograph for Cu-AA1.5 NPs revealed well-distributed Cu NPs with sizes less than 3.4 nm (). It is important to note that the electron diffraction for the Cu-AA1.5 NPs () cannot be obtained probably due to their finer size.Citation28 The average particle size of the Cu-AA2.0 NPs () appears to be similar to Cu-AA1.5 NPs, ie, about 3.89 nm in diameter (~14.0% of dispersity, ); however, there is a statistically significant difference between the average particle size for all Cu NPs (P < 0.05).
The average particle size of Cu-AA2.5 NPs was found to be 5.17 nm (), with low dispersity (~12.5%). Similar behavior was observed for Cu-AA1.5 and Cu-AA2.0 NPs; almost 30% of the average particle sizes fell within the range of 3.3–4.4 nm. From the SAED patterns (2,065 [±0.0106], 1.817 [±0.0053], and 1.280 [±0.00149]), and it was confirmed that the Cu-AA2.5 NPs consist of face-centered cubic copper ().
The average size of the nanoparticle from TEM stayed within a very small range of the average, as indicated by the small error (). This indicates that the reducing agent provides good control over the average particle size, which is desired in nanoparticle synthesis. Statistical descriptive analysis of particle size of Cu NPs suggests that the statistical skewness (a measure of data asymmetry) was positively skewed. The positive skewness of data indicates an increased number of finer nanoparticles in the distribution. This result agrees with the results obtained by the semiquantitative weight percentage composition of copper species ().
Statistical kurtosis of particle size (a measure of peakedness of distribution), indicates that the distribution of Cu-AA1.0 NPs is extremely leptokurtic. A leptokurtic distribution suggests that the Cu NPs are more singular in size, that is, the range in size is small and the least dimension of the individual nanoparticle is closer to the average particle size. This distribution was not observed from the statistical kurtosis in the other Cu NPs, which have very platykurtic distributions. A platykurtic distribution indicates that the range between the smallest and largest average nanoparticle size becomes wider as the distribution becomes flatter. The least dimension of the individual nanoparticle deviates quite significantly from the average least dimension.
XRD of stabilized Cu NPs
XRD patterns of NaAlg and stabilized Cu NPs are shown in . Pure sodium alginate indicated the presence of a completely amorphous material. The broad characteristic diffraction peak of NaAlg appears at 2θ = 42.5° in all curves. The XRD results revealed that Cu-AA1.0 NPs consist of zerovalent Cu and Cu2O, in agreement with the SAED pattern of . The peaks at (111, 42.9132), (200, 50.0289), and (220, 73.7236) planes belong to the fcc Cu0 (JCPDS, PDF, file no 85-1326).Citation29 The other peaks at (111, 36.0921), (200, 49.9132), and (311, 73.7236) planes correspond to the primitive cubic Cu2O (JCPDS, PDF, File No 77-0199).Citation30 The coexisting Cu2O is considered to be due to the incomplete reduction of copper ions by the reducing agent. On the other hand, Cu-AA1.5, Cu-AA2.0, and Cu-AA2.5 NPs consist mainly of zerovalent Cu plus a small amount of Cu2O (). Note that the widths of the diffraction peaks of Cu0 increase with increasing the reducing agent ratio, which indicates a decreasing of the particle size of stabilized Cu NPs nanoparticles.
Figure 2 X-ray diffraction patterns of the stabilized copper nanoparticles.
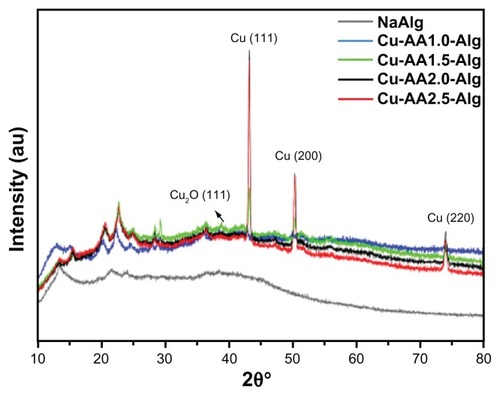
A semiquantitative analysis of the weight percentage composition of stabilized Cu NPs was performed with the software package X’pert HighScore v.1.0a (Philips Analytical, Almelo, Netherlands) by the reference intensity ratios method. This standardless method relies on the I/Icor values, which are unique to the individual phases and indicate the ability of the material to diffract X-rays with respect to that of corundum.Citation31 Indexing data and approximate compositions of the phases are summarized in . As can be seen in , there is a direct correlation between the reducing agent ratio and the percentage of zerovalent Cu. When the reducing agent ratio is more than 1.5, there are mostly zerovalent Cu diffraction peaks in the XRD patterns. However, at lower reducing agent ratios, the Cu2O percentage dominates over that of zerovalent copper. Thus, this can be a possible reason for the large polydispersity in the particle size of Cu-AA1.0.
The crystallite size and particle size of stabilized Cu NPs were also determined by using the Scherrer formulaCitation32 and the FTCitation26 from XRD data (). According to several authors,Citation33–Citation35 the Scherrer formula cannot be applied to nanoparticle samples, because of overlapping peaks of DRX, the presence of noncrystalline structures in the samples, and when the relative mean sizes of distributions of nanocrystals are broad.Citation34 As follows from , there is a discrepancy between the crystallite size values obtained from the Scherrer formula and histograms from TEM observations. However, the relative particle size values obtained from FT of XRD data agree well with the histograms from the TEM observations. From FT results, the stabilized Cu NPs varied approximately 5.4–7.5 nm in size by varying the reducing agent ratio. Moreover, from the FT results, it is possible to confirm the correlation between the decrease in particle size and the increase in reducing agent ratio. The slight differences in the particle size of Cu NPs when using NaAlg as stabilizer are probably due to the ability of NaAlg to bind strongly to the metal surface (interaction of –C–O groups of NaAlg with Cu0 and Cu2+) with the consequent inhibition of particle growth by collision.
Zhu et alCitation36 explained the influence of reducing agent ratio on the formation of copper nanoparticles. In this paper, the authors indicate that at low reducing agent ratios, the reduction rate of copper sulphate is slow and only few nuclei of copper can be formed in the early period of the reduction. The atoms formed at that period might participate mainly in collision with already formed nuclei, instead of the formation of new nuclei, so the particle size was larger. As the reducing agent is increased, the percentage of zerovalent copper increases. However at a lower reducing agent ratio, the Cu2O percentage dominates over that of zerovalent copper. During the reduction with lower reducing agent ratio (1.0%), the particles had large size dispersion (49%). Increasing the ratio of ascorbic acid to 1.5% decreased polydispersity significantly to 15.5%. After this ratio, the average particle size and the size dispersion did not change very much.
According to Bönnemann et alCitation37 and Patakfalvi et alCitation38, the nucleation of metal nanoparticles by reduction technique is an autocatalytic process: a slow, continuous nucleation is followed by rapid, autocatalytic particle growth. The steric stabilization by the large molar ratio of NaAlg (supersaturation) at the first step in the chemical reduction is the probable reason for the formation of Cu NPs of smaller size. The extensive carboxylate and hydroxyl groups on the polymer matrix could provide more inter- and intramolecular interstices, which will selectively trap the Cu NPs formed.
UV-vis absorption
The UV-vis absorbance spectra of Cu NPs in water are shown in . At first, the precursor solution was blue, a typical feature of copper nitrate, with a weak and narrow visible absorption peak at 559 nm. For the Cu NPs, no absorption in the visible range is observed, while distinct broad bands are observed at ~264, 280, 288, and 295 nm, according to Mie’s theory (dipole oscillation).Citation39 The increase in the intensity of the peak around the maximum value could be attributed to the increasing concentration of the reducing agent. The exact position of the plasmon absorption depends on stability (pH, solvent type, and stabilizing agent) and particle size.Citation4,Citation40 In this case, Cu NPs showed no surface plasmon resonance, as shown in . This could be a consequence of a combination of small particle size or a thin copper oxide layer around the copper nanoparticles.Citation41,Citation42 Usually, for Cu NPs ranging between 10 and 40 nm in diameter, the plasmon resonance appears around 560 nmCitation4,Citation40; however, the absorption spectra of small metal particles (diameter < 20 nm) depend only on the dipole oscillation and do not evidence surface plasmon resonance. These results are consistent with reports for the Cu NPs in polar solvents.Citation43,Citation44
Figure 3 Ultraviolet-visible (UV-vis) spectra of copper nanoparticles (NPs) (A); UV-vis spectra of stabilized copper NPs (B).
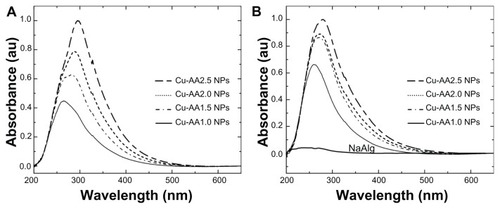
With the stabilizing agent (), the UV spectra were shifted to lower wavelengths (~260, 272, 273, and 279 nm). This shift is probably due to the slight reduction of particle size by using NaAlg as stabilizer. NaAlg has the structure of pyranose skeleton with carboxylate ions and oxygen polar groups, which donate lone-pair electrons forming a coordinative interaction with the zerovalent Cu, inhibiting the particle growth by collision. NaAlg acts as size controller, hindering the metal nuclei from the aggregation.
Thermal characterization
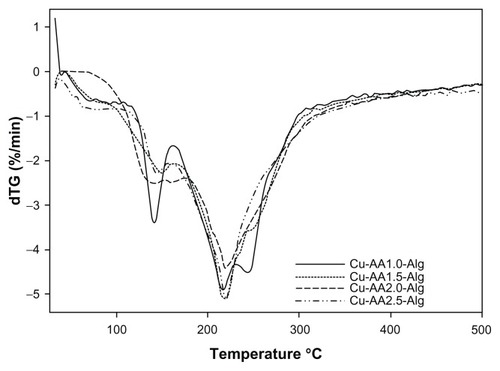
The results of thermogravimetric measurements carried out for stabilized Cu NPs are summarized in . All stabilized Cu NPs and NaAlg started decomposing below 100°C, but the rapid degradation was started at around 165°C. Two mass losses are identified, as reflected in two peaks in the differential thermal analysis curves (). The first thermal event over 100°C may be attributed to the vaporization of physisorbed water from stabilized Cu NPs.Citation45,Citation46 The second thermal event, starting over 160°C, was because of NaAlg degradation.Citation47,Citation48 The weight loss between 160°C and 230°C was very fast and may be related to the biopolymer degradation. It is noteworthy to say that Cu NPs did not increase the thermal stability of the stabilized Cu NPs. All stabilized Cu NPs showed a decrease of Td2 due to the loss of interpolymer chain interactions during the incorporation of Cu NPs in the polymer matrix. Similar findings were reported by Cárdenas et alCitation49 by incorporation of Cu NPs in chitosan matrix.
Table 4 Thermal behavior of stabilized copper nanoparticles
Figure 4 Differential thermal analysis curves of stabilized copper nanoparticles.
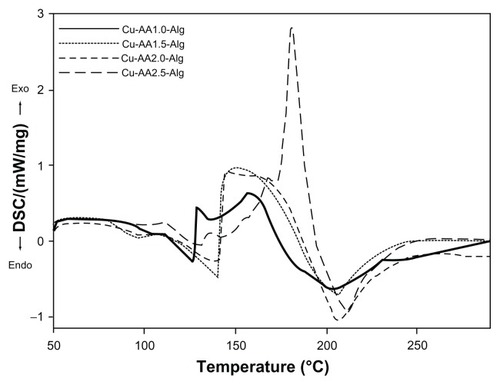
The differential scanning calorimetry (DSC) curves of stabilized Cu NPs are shown in , where two different peaks are observed. presents the endothermic and exothermic peaks and enthalpies associated with each peak for stabilized copper nanoparticles. Stabilized Cu NPs exhibited a weak endothermic transition (low energy) centered at about 100°C. This peak is attributed to the loss of water associated with the hydrophilic groups of the NaAlg and removal of residual water adsorbed to stabilized nanoparticles. This result was confirmed with the TGA experiments. The major intense peaks recorded in the DSC curves are exothermic transitions (150°C–210°C). The exothermic peaks resulted from decomposition reactions most probably to the partial decarboxylation of the mannuronic and gluluronic units of NaAlg, depolymerization, pyrolysis of the biopolymer, and oxidation reactions of the copper NPs. Pathak et alCitation47 and Soares et alCitation50 also reported that the thermal degradation of NaAlg begins at 220°C–240°C. As expected, the exothermic enthalpy values of stabilized nanoparticles increased as the reducing agent ratio was increased. Only Cu-AA1.0-Alg showed two exothermic transitions peaking at 129.7 and 158.7°C (). The first exothermic peak is probably attributed to the considerable oxidation process of Cu2O (major percentage of composition) to CuO, favored over the formation of copper carbonates. Similar findings were reported by Wang et al.Citation46 Also, the oxidation of NaAlg with or without ring opening could take place for all stabilized Cu NPs. This can be explained by the oxidation of secondary alcohol groups of NaAlg to keto groups (without ring opening) and to dialdehyde or dicarboxylate derivatives (with ring opening). These oxidations could be related to molecular rearrangements and to the high enthalpy values observed but not with weight loss ().
Table 5 Melting temperature and heat of fusion of the stabilized nanoparticles analyzed by DSC
Figure 5 DSC curves of stabilized copper nanoparticles.
One-dimensional FT-IR analysis
FT-IR spectra of stabilized Cu NPs are shown in . In an attempt to overcome the difficulties arising from the strong overlap of the bands of interest for elucidation of the molecular structure of stabilized Cu NPs, second-derivative spectra and curve-fitting (deconvolution) techniques have been used (). In the 3600–2800-cm−1 region, strong hydrogen-bonded (O–H) stretching absorptions and weak C–H stretching absorptions are observed in . Intermolecular (primary hydroxyl groups) and intramolecular hydrogen bonds are considered to cause the broadening of the –OH band in the FT-IR spectra. A broad band with a maximum around 3439 cm−1 was observed in the spectra of NaAlg (), corresponding to the stretching of –OH bond of mannuronic and gluluronic units (pyranose rings).Citation51,Citation52 A shift from 3439 to 3420 cm−1 is observed for stabilized Cu NPs; this decrease in frequency may occur due to the interaction of Cu0 with –OH groups ().
Figure 6 Fourier transform infrared spectroscopy spectra of NaAlg and stabilized copper nanoparticles.
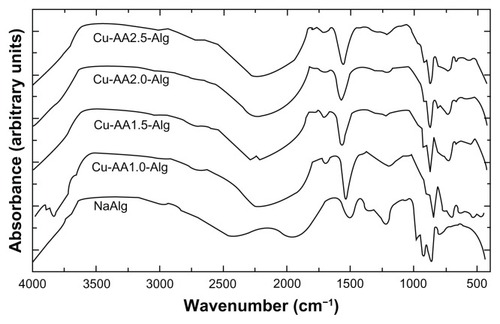
Figure 7 Second-derivative Fourier transform infrared spectroscopy spectra of NaAlg (A and B), Cu-AA1.0-Alg (C and D), and Cu-AA2.5-Alg (E and F).
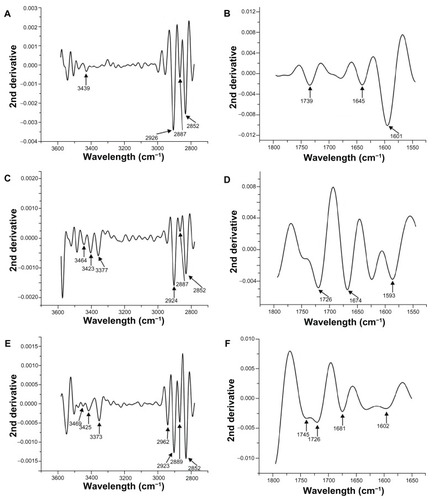
Bands at 2925 cm−1 and around 2850 cm−1 correspond to asymmetric and symmetric –C–H intramolecular bonds.Citation51,Citation52 The intensities of both bands increase with the increasing of reducing agent ratio. More intense –CH2 asymmetric bands are because of the dipole moment variation produced by electrostatic interaction of zerovalent Cu (electron acceptor) and oxygen (electron donor).
In accordance with the literature,Citation53,Citation54 deconvolution was made on the basis of a Gaussian shape. Bands corresponding to the stretching vibration of free –C=O groups and the asymmetric stretching of –O–C–O− in NaAlgCitation55 were deconvoluted into three bands by curve fitting. The peak positions of the three deconvoluted bands were 1739, 1645, and 1601 cm−1 (). A noticeable feature in the IR spectra of stabilized Cu NPs is the shift of 1645 cm−1 to higher frequencies (1681 cm−1) with increasing of the reducing agent ratio (). Frequencies below 1500 cm−1 in carbohydrates are due to mixed modes, and every band results from the contribution of more than one kind of motion.Citation56,Citation57 The second derivative spectra of the stabilized Cu NPs in the region of –C–OH deformation with contribution of –O–C–O− symmetric stretching showed two well-resolved bands, which were shifted to higher frequencies, around 1487 and 1425 cm−1. These bands occur at lower frequency for NaAlg (1464 and 1417 cm−1). This can result from the electrostatic interaction between carboxylate ions and Cu0 and the high electron density induced by Cu NPs onto the adjacent hydroxyl groups.Citation58 A weak shoulder in the normal mode corresponding to symmetric stretching of carboxylate ion was observed at 1373 cm−1 for NaAlg.Citation53 This peak was more prominent and was shifted to higher frequencies for all stabilized Cu NPs. The second-derivative spectra of stabilized Cu NPs suggest that there are at least two bands contributing to the profile, at 1383 and 1344 cm−1.
The –C–C–H deformation at 1302 cm−1, observed as a weak peak in the normal mode, was shifted to higher frequencies for stabilized Cu NPs in respect to the NaAlg. In the second-derivative spectra, this band was more prominent for NaAlg but remained weak for stabilized Cu NPs.
NaAlg was the only one that showed a weak band in the derivative spectra, corresponding to the –C–O– and –C–O–C– stretching at 1255 cm−1.Citation59 The –C–C– stretching and –C–C–C– bending at 1132 cm−1 in the FT-IR spectrum of NaAlgCitation60 was shifted to higher frequencies for stabilized Cu NPs; this implies that the relative intensity contributions of both overlapped bands are affected by the change in their population because of electrostatic interaction with Cu0.
Bands around 1150–810 cm−1 are representative of pyranose skeleton modes.Citation54,Citation60–Citation62 The –C–C– stretching vibrations of mannuronic and gluluronic units are pointed out around 1095 cm−1.Citation63 This band is overlapping with the band corresponding to –C–O– stretching, as shown in the second-derivative spectra, with two bands well defined at 1132 and 1095 cm−1.Citation63 When stabilization occurs, both bands appear shifted at higher frequency (around 1147 and 1107 cm−1). Jovanović et alCitation51 reported that one of the most likely reasons for such shift seems to be the coordination of both OH and ether groups of NaAlg to silver NPs, which weakened the strength of CO bond in these two functional groups. The –C–O– vibrations occurred as a band of high intensity around 1030 cm−1 for the NaAlg,Citation63 and stabilized Cu NPs were observed in the normal mode and second-derivative spectra. For stabilized Cu NPs, this band overlaps with the bands corresponding to –C–C– and –C–O– stretching of mannuronic and gluluronic units. No ring opening was suggested by the effect of the increasing of the reducing agent ratio.
Furthermore, in the anomeric or fingerprint region, the IR spectra of polymannuronate and mannopyranuronosyl residues of NaAlg show three bands at 947, 893, and 821 cm−1 in accordance with the second-derivative spectra. These band positions are in agreement with the values reported by Sartori et alCitation60 Chandía et alCitation61 and Mathlouthi et al.Citation63 These bands are mainly due to the out-of plane deformation of the glycosidic bond on the pyranose rings coupled with other deformation vibrations (C–H of the β-mannuronic acid residues and C–H of the α-gluluronic acid residues).Citation54,Citation57,Citation64,Citation65 For stabilized Cu NPs, these three bands were shifted to lower frequencies; this implies that the electrostatic interaction with Cu0 may affect the force constants and vibrational amplitudes of the nearest neighbor bonds by steric hindrance, causing the lower strength of the bending vibrations.
2D-IR correlation spectra
The reconstructed data matrix from the three principal components was used instead of the original raw spectral data for the subsequent 2D correlation analysis. PCA factor 1, factor 2, and factor 3 account for 73.0%, 17.4%, and 8.9%, respectively, of the total variance of spectral intensities.
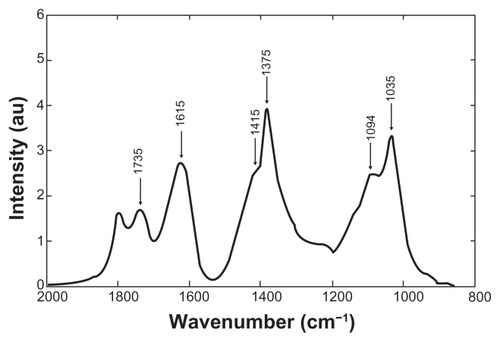
According to the Noda’s rule,Citation28 strong autopeaks are supposed to appear when any peak in the region of interest changes largely in intensity under a given perturbation. The synchronous plot in the 2000–800 cm−1 region () shows two strong autopeaks on the diagonal at approximately 1375 and 1035 cm−1 and four weak autopeaks around 1735, 1615, 1415, and 1094 cm−1, thus identifying the changes that occur simultaneously in the interaction of Cu NPs with NaAlg. In order to illustrate the extent of the intensity changes, a power spectrum corresponding to the synchronous correlation intensity along the diagonal line is shown in . In this power spectrum, peaks at 1375 and 1035 cm−1 are obviously stronger than peaks at 1735, 1615, 1415, and 1094 cm−1 (positions identified in the second-derivative spectra). The progress of the interaction between Cu0 and the oxygen of the –C=O group also affected the vibrations of the –C–O− group, the C–OH deformation, the –O–C–O− symmetric stretching and the C–C stretching of mannuronic and gluluronic units (pyranose rings) due to the high electron density of copper, which produces local bridging attraction depending on the strength and spatial range of de –C–O–Cu interaction.
Figure 8 (A and B) Synchronous and asynchronous two-dimensional correlation spectra in the 2000–800 cm−1 region constructed from the reducing agent–dependent infrared spectra.
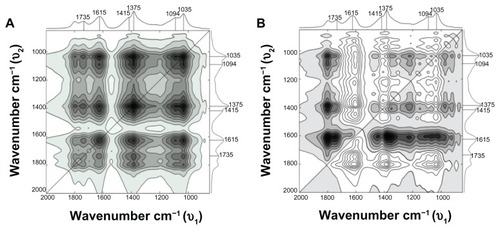
Figure 9 Power spectrum corresponding to the synchronous correlation intensity along the diagonal line in the region of 2000–800 cm−1.
The off-diagonal peaks are called cross peaks, and indicate that the two bands change at the same time, though not necessarily in the same direction. A positive synchronous cross peak (solid black area) indicates that the variations in intensity at corresponding frequencies proceed in the same direction during the observation period, while a negative synchronous cross peak shows that the changes are in opposite directions. The synchronous plot shows only positive cross peaks, which means that all peak intensities are changing in the same (positive) direction. This plot is in good agreement with the spectroscopic data shown in and substantiates the fact that in the synchronous plot the interaction of copper to carboxylate ion is apparent as the association of copper to oxygen of hydroxyl groups.
Two broad peaks around 1375 and 1035 cm−1 were observed, which reflect that the symmetric stretching of the carboxylate group (–C–O–O–) varies in the same direction with the –C–O– group according to the stabilization, as evidenced in the one-dimensional FT-IR spectra. There are two positive cross peaks in respect to a significant autopeak at 1615 cm−1 (1615/1375 cm−1 and 1615/1035 cm−1), confirming the synchronous changes in the –C=O stretching mode of the free –C–O–O− and –C–O stretching vibrations. Five weak cross peaks to a significant autopeak at 1735 cm−1 were also observed in the synchronous plot (1735/1615, 1735/1415, 1735/1375, 1735/1094, and 1735/1035 cm−1), indicating that these features are interconnected.
From the corresponding asynchronous plot (), several positive cross peaks can be identified at 1615/1415, 1615/1375, 1615/1094, 1615/1035, 1415/1094, and 1375/1094 cm−1. The presence of these cross peaks indeed indicates that the stabilization of Cu NPs involves sequential events. Negative cross peaks were observed at 1615/1415, 1615/1375, 1615/1094, 1615/1035, and 1415/1094 cm−1. Based on Noda’s ruleCitation28 for asynchronous spectra, the spectral intensity change at 1735 cm−1 occurs before 1615, 1415, 1375, 1094, and 1035 cm−1; and 1615 cm−1 occurs after 1415, 1375, 1094, and 1035 cm−1. Due to the absence of asynchronous peak at 1415/1375, 1415/1035, 1375/1094, 1375/1035, and 1094/1035 cm−1 we can only conclude that these pairs of bands vary together. These results suggest that the first event involved in the stabilization is the electrostatic interaction of Cu NPs with –C=O, followed by the interaction of copper NPs to the available O–C–O−, and finally the association of Cu NPs to –OH groups.
Evaluation of antibacterial activity
The responsibility of biocidal activity of copper and silver species (zerovalent nanoparticles and metal ions released from nanoparticles) has been the subject of considerable debate in recent years. Some studies have reported that the active agent appears to be the ionic species, critical in the electrostatic attraction between negative or positively charged cell membrane of the microorganism.Citation66–Citation68 The growth of all tested strains was inhibited by the stabilized Cu NPs, with both the MIC and MBC ≈ 4.0 mg/L (); however, Cu-AA2.0-Alg and Cu-AA2.5-Alg had the highest bactericidal activity. While the growth of most of the tested strains was inhibited by stabilized Cu NPs at 4.0 mg/L, S. enterica serovar Typhimurium had an MBC of 8.0 mg/L. This is only one tube dilution (twofold) different from 4.0 mg/L. In testing S. aureus ATCC 6538P, the MIC and MBC were 2.0 mg/L for Cu-AA2.5-Alg. A high percentage of zerovalent Cu resulted in higher MIC values; however, the extent of decreased activity of Cu-AA1.0-Alg and Cu-AA1.5-Alg was just slightly lower. A decrease in percentage of Cu0 results in approximately a twofold increase. The MBC values were mostly similar to the MIC values of all stabilized Cu NPs; however, the MBC values of Cu-AA2.0-Alg and Cu-AA2.5-Alg varied between 2 and 4 mg/L for all tested strains. The observed MIC values for stabilized Cu NPs were comparable to values previously reported by Du et alCitation69 for chitosan nanoparticle–loaded copper ions. From these results, it can be understood that the great antibacterial activity of Cu-AA2.0-Alg and Cu-AA2.5-Alg is caused by the presence of a large amount of Cu0 in dissolution. The dispersion and further oxidation of zerovalent copper to Cu2+ in liquid cultures could facilitate the continuous release of Cu2+ and ensure the delivery of copper ions in the nutrient media. On the other hand, the agglomeration may affect the outcome and interpretation of antibacterial activity results. This could be the reason for the lower antibacterial activity of Cu-AA1.0-Alg.
Table 6 Minimum inhibitory concentration (MIC), minimum bactericidal concentration (MBC), and ratio MBC/MIC of stabilized copper nanoparticles (Cu NPs)
Ayala-Núñez et alCitation14 define the MBC/MIC ratio as “the parameter that reflects the bactericidal capacity of a compound by relating both values. A ratio with a superior value to 1 (MBC >> MIC) indicates that a great amount of compound is needed to reach the bactericidal effect and that this compound could be considered a bacteriostatic agent. Besides, the MBC/MIC ratio can reflect if the bacteria are susceptible, tolerant, or resistant to the agent that is being challenged.” In accordance with that, the results showed the stabilized Cu NPs inhibited bacterial growth of all strains in a bactericidal rather than a bacteriostatic manner (MBC/MIC ratio = 1), except for S. enterica serovar Typhimurium ATCC 13311 with Cu-AA2.5-Alg NPs.
summarizes the diameters of zone of inhibition of stabilized Cu NPs in millimeters. It is worth pointing out that stabilized Cu NPs were compared with antibiotics in order to establish a comparison parameter but not to replace antibiotic therapy anytime soon.
Table 7 Antimicrobial activity of the stabilized copper nanoparticles (Cu NPs) in terms of diameter of zone of inhibition
Well-diffusion test and dispersed nanoparticles (MIC and MBC) showed high variability in results. Stabilized Cu NPs determined similar zones of inhibition on tested bacteria. The values for diameter of zone of inhibition of the stabilized Cu NPs vary from 9 to 12 mm depending on the bacterial strain; however, it was established that stabilized Cu NPs had antibacterial effects on both Gram-positive and Gram-negative bacteria, showing higher antibacterial activity against E. coli O157: H7 and S. enterica serovar Typhimurium than some of the standard antibiotics.
Both E. coli demonstrated greater sensitivity to stabilized Cu NPs, which is in accordance with the MIC results. This finding is in agreement with previous studies.Citation3,Citation70 As expected, Cu-AA1.0-Alg showed less efficient antibacterial activity against the bacteria studied. It is reasonable to believe that the amount of the Cu+2 ions released from Cu-AA1.0-Alg and Cu-AA1.5-Alg was inadequate to show antibacterial activity comparable with the other stabilized Cu NPs. Regarding the effects of the antibiotics used as positive controls, only S. aureus registered a higher susceptibility to cloxacillin, in accordance with Turck et al.Citation71
Acknowledgments
This work was supported by FONDECYT 3110094, INNOVA BÍO-BÍO 11-CH S2.1025F11, CONICYT REGIONAL/CIPA R08C1002 and DIUC 208.036.033-1.0. We gratefully acknowledge the technical assistance of Claudia Rivera, Margarita Torres, and Stefanía Céspedes. Microscopic images were performed in the microscopy laboratory at the University of Concepcion.
Disclosure
The authors report no conflicts of interest in this work.
References
- KickelbickGHybrid Materials: Synthesis, Characterization and ApplicationsWeinheimWiley-VCH2006
- LiuJArugueteDMMuruyamaMHochellaMFJrInfluence of size and aggregation on the reactivity of an environmentally and industrially relevant nanomaterial (PbS)Environ Sci Technol2009438178818319924941
- RupareliaJPChatterjeeAKDuttaguptaSPMukherjiSStrain specificity in antimicrobial activity of silver and copper nanoparticlesActa Biomater2008470771618248860
- DangTMDLeTTTFribourg-BlancEDangMCSynthesis and optical properties of copper nanoparticles prepared by a chemical reduction methodAdv Nat Sci Nanosci Nanotechnol20112015009 Epub March 11, 2011
- YuWXieHChenLLiYZhangCControlled synthesis of narrow-dispersed copper nanoparticlesJ Dispers Sci Technol201031364367
- KimYHLeeDKJoBGJeongJHKangYSSynthesis of oleate capped Cu nanoparticles by thermal decompositionColloids Surf A Physicochem Eng Asp2006284364368
- PhamLQSohnJHKimCWCopper nanoparticles incorporated with conducting polymer: effects of copper concentration and surfactants on the stability and conductivityJ Colloid Interface Sci2012365110310921993548
- HoltanSBruheimPSkjak-BraekGMode of action and subsite studies of the guluronan block-forming mannuronan C-5 epimerases AlgE1 and AlgE6Biochemical J2006395319329
- LiuJWZhangYChenDFacile synthesis of high-magnetization γ-Fe2O3/alginate/silica microspheres for isolation of plasma DNAColloids Surf A Physicochem Eng Asp20093413339
- OzakiYNodaITwo-Dimensional Correlation Spectroscopy: Applications in Vibrational SpectroscopyNew YorkJohn Wiley & Sons2004
- Díaz-VisurragaJGutiérrezCvon PlessingCGarcíaAMetal nanostructures as antibacterial agentsMéndez-VilasAScience and Technology Against Microbial Pathogens: Research, Development and EvaluationBadajozFormatex2011210218
- WiggintonNSDe TittaAPiccapietraFBinding of silver nanoparticles to bacterial proteins depends on surface modifications and inhibits enzymatic activityEnviron Sci Technol2010442163216820158230
- PalSTakYKSongJMDoes the antimicrobial activity of silver nanoparticles depend on the shape of the nanoparticle? A study of the Gram-negative bacterium Escherichia coliAppl Environ Microbiol2007731712172017261510
- Ayala-NúnezNVLaraHHIxtepanLRodríguezCSilver nanoparticles toxicity and bactericidal effect against methicillinresistant Staphylococcus aureus: nanoscale does matterNanobiotechnology2009529
- Diaz-VisurragaJGarciaACardenasGMorphological changes induced in bacteria as evaluated by electron microscopyMéndez-VilasADíazJMicroscopy: Science, Technology, Applications and EducationBadajozFormatex2010307315
- MoronesJRElechiguerraJLCamachoAThe bactericidal effect of silver nanoparticlesNanotechnology200516102346235320818017
- MinYAkbulutMKristiansenKGolanYIsraelachviliJThe role of interparticle and external forces in nanoparticle assemblyNat Mater2008752753818574482
- NelAEMädlerLVelegolDUnderstanding biophysicochemical interactions at the nano-bio interfaceNat Mater2009854355719525947
- FeickJDChukwumahNNoelAEVelegolDAltering surface charge nonuniformity on individual colloidal particlesLangmuir2004203090309515875834
- KimJSKukEYuKNAntimicrobial effects of silver nanoparticlesNanomedicine200739510117379174
- PanacekAKvitekLPrucekRSilver colloid nanoparticles: synthesis, characterization, and their antibacterial activityJ Phys Chem B2006110162481625316913750
- YoonKByeonJHParkJHwangJSusceptibility constants of Escherichia coli and Bacillus subtilis to silver and copper nanoparticlesSci Total Environ200737357257517173953
- BlosiMAlbonettiSDondiMMartelliCBaldiGMicrowave-assisted polyol synthesis of Cu nanoparticlesJ Nanopart Res201113127138
- HallBDZanchetDUgarteDEstimating nanoparticle size from diffraction measurementsJ Appl Crystallogr20003313351341
- JungYMNodaINew approaches to generalized two-dimensional correlation spectroscopy and its applicationsAppl Spectrosc Rev200641515547
- NodaIGeneralized two-dimensional correlation method applicable to infrared, Raman, and other types of spectroscopyAppl Spectrosc19934713291336
- PetersonLRShanholtzerCJTests for bactericidal effects of antimicrobial agents: technical performance and clinical relevanceClin Microbiol Rev199254204321423219
- VossmeyerTKatsikasLGiersigMPopovicIGDiesnerKChemseddineACdS Nanoclusters: synthesis, characterization, size dependent oscillator strength, temperature shift of the excitonic transition energy, and reversible absorbance shiftJ Phys Chem19949876657673
- Joint Committee on Powder Diffraction Standards, File 85-1326;1999.
- Joint Committee on Powder Diffraction Standards, File 77-0199;1997.
- MayoralMCAndrésJMBonaMTHigueraVBelzunceFJYttria stabilized zirconia corrosion destabilization followed by Raman mappingSurf Coat Technol20082022152105216
- WestASolid State Chemistry and Its ApplicationsChichesterWiley1984
- CohenJBX-ray diffraction studies of catalystsUltramicroscopy1990341–24146
- CalvinSLuoSXCaragianis-BroadbridgeCScherrer analysis of x-ray diffraction as methods for determining mean sizes of polydisperse nanoparticlesAppl Phys Lett20058723233102 Epub November 28, 2005
- ChicheDDigneMRevelRChanéacCJolivetJPAccurate determination of oxide nanoparticle size and shape based on X-ray powder pattern simulation: application to boehmite AlOOHJ Phys Chem C20081122385248533
- ZhuHTZhangCYYinYSRapid synthesis of copper nanoparticles by sodium hypophosphite reduction in ethylene glycol under microwave irradiationJ Cryst Growth20042703–4722728
- BönnemannHRichardsRMNanoscopic metal particles – synthetic methods and potential applicationsEur J Inorg Chem20011024552480
- PatakfalviRPappSDekanyIThe kinetics of homogeneous nucleation of silver nanoparticles stabilized by polymersJ Nanopart Res20079353364
- GhodselahiTVesaghiMAShafiekhaniAStudy of surface plasmon resonance of Cu@Cu2O core-shell nanoparticles by Mie theoryJ Phys D Appl Phys200942015308 Epub December 15, 2008
- KanninenPJohansCKyosti KontturiJMInfluence of ligand structure on the stability and oxidation of copper nanoparticlesJ Colloid Interface Sci20083181889517961585
- DungTMTuyetTTFribourg-BlancEChienMThe influence of solvents and surfactants on the preparation of copper nanoparticles by a chemical reduction methodAdv Nat Sci Nanosci Nanotechnol20112025004 Epub April 21, 2011
- BregeJJHamiltonCECrouseCABarronARUltrasmall copper nanoparticles from a hydrophobically immobilized surfactant templateNano Lett2009962239224219432406
- FengGQiangWZhuHTXunFHuZSPreparation of stable colloids of copper nanoparticles in organic solvent with amphiphilic polymerRare Metal Mat Eng2003321733735
- MehtaVPKhannaRKTalesaraPRSharmaRDielectric-relaxation studies of the system copper (II) soap nonpolar solvent at microwave-frequenciesAsian J Chem199573648650
- LuechingerNAAthanassiouEKStarkWJGraphene-stabilized copper nanoparticles as an air-stable substitute for silver and gold in low-cost ink-jet printable electronicsNanotechnology20081944445201 Epub September 26, 200821832722
- WangSHuangXHeYSynthesis, growth mechanism and thermal stability of copper nanoparticles encapsulated by multi-layer grapheneCarbon20125021192125
- PathakTSKimJSLeeS-JBaekD-JPaengKJPreparation of alginic acid and metal alginate from algae and their comparative studyJ Polym Environ200816198204
- ZohuriaanMJShokrolahiFThermal studies on natural and modified gumsPolym Test2004235575579
- CárdenasGDíazJGarcíaAMeléndrezMFCruzatCColloidal Cu nanoparticles/chitosan composite film obtained by microwave heating for food package applicationsPolym Bull200962511524
- SoaresJPSantosJEChiericeGOCavalheiroETGThermal behavior of alginic acid and its sodium saltEcl Quím20042925763
- JovanovićŽStojkovskaJObradovićBMišković-StankovićVAlginate hydrogel microbeads incorporated with Ag nanoparticles obtained by electrochemical methodMater Chem Phys20121331182189
- LealDMatsuhiroBRossibMCarusoFFT-IR spectra of alginic acid block fractions in three species of brown seaweedsCarbohydr Res200834330831618048014
- HabibiMHHassanzadehAZeini-IsfahaniASpectroscopic studies of Solophenyl red 3BL polyazo dye tautomerism in different solvents using UV-visible, 1H NMR and steady-state fluorescence techniquesDyes Pigm2006691–293101
- PopescuCMPopescuMCSingurelGVasileCArgyropoulosDSWillforSSpectral characterization of eucalyptus woodAppl Spectrosc2007611168117718028695
- ChenJPHongLWuSWangLElucidation of interactions between metal ions and ca alginate-based ion-exchange resin by spectroscopic analysis and modeling simulationLangmuir2002182494139421
- ValentinRHorgaRBonelliBGarroneEDi RenzoFQuignardFFTIR Spectroscopy of NH3 on acidic and ionotropic alginate aerogelsBiomacromolecules20067387788216529426
- SekkalMDincqVLegrandPHuvenneJPInvestigation of the glycosidic linkages in several oligosaccharides using FT-IR and FT RamanJ Mol Struct1995349349352
- LimSFZhengYMZouSWChenJPCharacterization of copper adsorption onto an alginate encapsulated magnetic sorbent by a combined FT-IR, XPS and mathematical modeling studyEnviron Sci Technol20084272551255618504995
- NivensDOhmanDEWilliamsJFranklinMJRole of alginate and its O acetylation in formation of Pseudomonas aeruginosa microcolonies and biofilmsJ Bacteriol200118331047105711208804
- SartoriCFinchDSRalphBDetermination of the cation content of alginate thin films by FT IR spectroscopyPolymer19973814351
- ChandíaNPMatsuhiroBMejíasEMoenneAAlginic acids in Lessonia vadosa: partial hydrolysis and elicitor properties of the polymannuronic acid fractionJ Appl Phycol2004162127133
- SalomonsenTJensenHMStenbakDEngelsenSBChemometric prediction of alginate monomer composition: a comparative spectroscopic study using IR, Raman, NIR and NMRCarbohydr Polym2008724730739
- MathlouthiMKoenigJLVibrational spectra of carbohydratesTipsonRSDerekHAdvances in Carbohydrate Chemistry and BiochemistryWalthamAcademic Press1987789
- FuksLFilipiukDLewandowskiWLanthanide ions complexation by uronic acidsJ Mol Struct2001563564587593
- FilipiukDFuksLMajdanMTransition metal complexes with uronic acidsJ Mol Struct2005744747705709
- HamoudaTMycADonovanBShihAReuterJDBakerJRA novel surfactant nanoemulsion with a unique non-irritant topical antimicrobial activity against bacteria, enveloped viruses and fungiMicrobiol Res20001561711372645
- DibrovPDziobaJGosinkKKHaseCCChemiosmotic mechanism of antimicrobial activity of Ag+ in Vibrio choleraeAntimicrob Agents Chemother2002462668267012121953
- DragievaIStoevaSStoimenovPPavlikianovEKlabundeKComplex formation in solutions for chemical synthesis of nanoscaled particles prepared by borohydride reduction processNanostruct Mater199912267270
- DuWXuYXuZFanCPreparation, characterization and antibacterial properties against E. coli K88 of chitosan nanoparticle loaded copper ionsNanotechnology2008198085707 Epub February 4, 200821730738
- QiLXuZJiangXHuCZouXPreparation and antibacterial activity of chitosan nanoparticlesCarbohydr Res2004339162693270015519328
- TurckMRonaldAPetersdorfRGClinical studies with cloxacillinJAMA19651921196196314290435