Abstract
Background
Effective cancer chemotherapy remains an important issue in cancer treatment, and signal transducer and activator of transcription-3 (Stat3) activation leads to cellular resistance of anticancer agents. Polymers are ideal vectors to carry both chemotherapeutics and small interfering ribonucleic acid (siRNA) to enhance antitumor efficacy. In this paper, poly(lactic-co-glycolic acid) (PLGA) nanoparticles loaded with paclitaxel and Stat3 siRNA were successfully synthesized, and their applications in cancer cells were investigated.
Methods
Firstly, paclitaxel was enclosed by PLGA nanoparticles through solvent evaporation. They were then coated with cationic polyethylenimine polymer (PLGA-PEI-TAX), enabling it to carry Stat3 siRNA on its surface through electrostatic interactions (PLGA-PEI-TAX-S3SI). The size, zeta potential, deliver efficacy, and release profile of the PLGA nanocomplexes were characterized in vitro. The cellular uptake, intracellular nanoparticle trajectory, and subsequent cellular events were evaluated after treatment with various PLGA nanocomplexes in human lung cancer A549 cells and A549-derived paclitaxel-resistant A549/T12 cell lines with α-tubulin mutation.
Results
A549 and A549/T12 cells contain constitutively activated Stat3, and silencing Stat3 by siRNA made both cancer cells more sensitive to paclitaxel. Therefore, PLGA-PEI-TAX-S3SI was synthesized to test its therapeutic role in A549 and A549/T12 cells. Transmission electron microscopy showed the size of PLGA-PEI-TAX-S3SI to be around 250 nm. PLGA-PEI nanoparticles were nontoxic. PLGA-PEI-TAX was taken up by A549 and A549/T12 cells more than free paclitaxel, and they induced more condensed microtubule bundles and had higher cytotoxicity in these cancer cells. Moreover, the yellowish fluorescence observed in the cytoplasm of the cancer cells indicates that the PLGA-PEI nanoparticles were still simultaneously delivering Oregon Green paclitaxel and cyanine-5-labeled Stat3 siRNA 3 hours after treatment. Furthermore, after the cancer cells were incubated with the synthesized PLGA nanocomplexes, PLGA-PEI-TAX-S3SI suppressed Stat3 expression and induced more cellular apoptosis in A549 and A549/T12 cells compared with PLGA-PEI-TAX.
Conclusion
The PLGA-PEI-TAX-S3SI complex provides a new therapeutic strategy to control cancer cell growth.
Introduction
Lung cancer is a major cause of cancer death worldwide. Drug resistance to anticancer treatment is an important issue where advances in cisplatin-based chemotherapy and targeted therapy have significantly increased the tumor control rate.Citation1 Targeted therapy that blocks only one of these pathways allows the other pathways to act as salvage or escape mechanisms for cancer cells.Citation2 A logical approach involves target agents that decrease both drug resistance and survival signals, ie, a targeted agent combined with chemotherapy to improve treatment efficacy in lung cancer.Citation2
Signal transducer and activator of transcription (Stat) proteins are latent cytoplasmic transcription factors that regulate cell proliferation, migration, and differentiation.Citation3,Citation4 In the Stat family, Stat3 regulates genes that encode apoptosis inhibitors, cell cycle regulators, and inducers of angiogenesis.Citation4,Citation5 Downregulation of Stat3 decreases cell viability and increases apoptosis in cancer cells.Citation6 Overexpression of Stat3 leads to chemoresistance.Citation7 Therefore, targeting Stat3 may provide an efficient way to enhance treatment efficacy in lung cancer.
Currently, small interfering ribonucleic acid (siRNA) technology provides new types of drugs that are easy to design and have high target selectivity to inhibit specific gene expression in the cytoplasm. The major limitations in the therapeutic use of siRNA are their rapid degradation in cellular cytoplasm and their easy excretion from the kidney.Citation8,Citation9 Furthermore, siRNA molecules have poor cellular uptake and poor tissue specificity.Citation8,Citation9 Hence, an ideal vector for siRNA delivery is needed to prevent their excretion from the kidney and increase their cellular uptake.
Polymers provide a platform for carrying chemotherapeutics and siRNA simultaneously to exert significant enhancement in antitumor efficacy.Citation10,Citation11 The United States Food and Drug Administration approved the polymer poly(lactic-co-glycolic acid) (PLGA) for human use. The final product of PLGA using cellular metabolic conversion is water and carbon dioxide in a tricarboxylic acid cycle, and thus is recognized to be nontoxic.Citation12 Many studies have demonstrated that PLGA nanoparticles (NPs) enter the cell efficiently through specific and nonspecific endocytosis.Citation13 Intracellular-retained PLGA NPs can release the encapsulated drug slowly leading to a sustained drug effect.Citation14
Many stabilizers such as polyvinyl alcohol, polyvinyl pyrrolidone, and Tween® 80 are added to prevent PLGA NP aggregation during PLGA NP preparation.Citation15,Citation16 These stabilizers significantly limit their biomedical application because they do not have functional groups for further modifications. Synthesizing stabilizer-free and biodegradable PLGA NPs was previously successful when significant amounts of drugs could be encapsulated in PLGA NPs < 100 nm in diameter.Citation17,Citation18 One advantage of PLGA NPs is that they can be directly coated with cationic polymers, such as polyethylenimine (PEI), enabling them to carry siRNA on their surfaces through electrostatic interactions.Citation19,Citation20 Therefore, PLGA-PEI NPs could be used as a carrier that integrates anticancer drugs (inner part) and agents to reduce chemoresistance, eg, siRNA (outer layer).
This study demonstrates that PLGA-PEI NPs provide a platform for the codelivery of paclitaxel and Stat3 siRNA. The approach provides a new strategy to overcome tumor drug resistance.
Material and methods
Antibodies and reagents
The following antibodies were used: anti-Stat3 (Tyr705), anti-Stat1, anti-α-tubulin (Cell Signaling Technology, Beverly, MA), anti-Stat3 (Santa Cruz Biotechnology, Santa Cruz, CA), and anti-actin (Chemicon International Inc, Pittsburgh, PA). Paclitaxel and PEI polymer (average molecular weight 25 kDa) were from Sigma-Aldrich Corporation (St Louis, MO), Oregon Green® 488 paclitaxel was from Molecular Probes® Life Technologies (Carlsbad, CA), and PLGA copolymer (5050 DLG 4.5A; molecular weight 66 kDa) was from Evonik Industries AG (Darmstadt, Germany). All reagents were purchased from Sigma-Aldrich.
Cell lines
Human lung cancer cell line A549 and A549-derived paclitaxel-resistant A549/T12 cell lines with α-tubulin mutation were obtained from Dr Susan Horwitz (Department of Molecular Pharmacology, Albert Einstein College of Medicine, Bronx, NY).Citation21 All cell culture-related reagents were purchased from Gibco® Life Technologies.
siRNA
Human siRNA targeting Stat3 messenger RNA labeled with cyanine-5 (Cy5) was purchased from Ambion® Life Technologies (sense: 5′-GGAUCUAGAACAGAAAAUGTT-3′, antisense: 5′-CAUUUUCUGUUCUAGAUCCTG-3′). The scrambled control for Stat3 siRNA was purchased from Applied Biosystems™ Life Technologies. Tumor cells were transfected with Stat3 siRNA or scrambled control using Lipofectamine™ 2000 (Invitrogen™ Life Technologies) for Stat3 silencing and evaluated after 48 hours.
Preparation of PLGA-PEI NPs for the codelivery of paclitaxel and Stat3 siRNA
The surfactant-free manufacturing process for encapsulating paclitaxel into PLGA NPs was as follows: 1 mg of paclitaxel and 50 mg of PLGA copolymer were dissolved in 5 mL acetone. The acetone solution of PLGA-paclitaxel was precooled for 10 minutes at 4°C and titrated dropwise (360 μL/minute) with a 50/50 (volume/volume) ethanol/water solution using a peristaltic pump (MasterFlex C/L Model:77122–22). The titrated solution was homogenized using ultrasonication (Branson S8500, Emerson Electric (Taiwan) Co. Ltd) (2000 W) at 4°C, making the nonstabilized premicelles (entanglements of PLGA and paclitaxel) evenly distributed during formation. This process continued until it became slightly turbid or translucent so that the premicelles in the system reached critical micelle concentration (critical level). The titrated mixture was transferred into a glass beaker containing 20 mL cold sterile Milli-Q® water (Millipore Corporation, Billerica, MA) forming a white colloid solution. This colloid solution was placed under ultrasonication for 15 minutes at 4°C stabilizing the PLGA micellar NPs. The existing acetone in the white colloid solution was removed by vacuum evaporation using 15-minute ultrasonication at 4°C. Finally, the evaporated colloid solution was filtrated using 40-μm nylon mesh (BD Falcon cat # 352340) to avoid aggregation of the PLGA NPs. Using an ultraviolet-visible spectrum (Hewlett-Packard Model 8453) (absorption wavelength: 270 nm), loading efficacy (%) was determined by comparing the amount of nonencapsulated paclitaxel in the supernatant with the initial paclitaxel concentration. PEI (0.3 mg/mL) was added to paclitaxel-loaded PLGA NPs (20:100 volume/volume percent) to create PEI-coated paclitaxel-loaded PLGA NPs (PLGA-PEI-TAX), which was dissolved in 5 mL acetone. PLGA-PEI-TAX was washed with phosphate buffered saline (PBS) after 30 minutes of ultrasonication. Then, 0.5 μg Stat3 siRNA (PLGA-PEI-TAX-S3SI) or Cy5-labeled Stat3 siRNA (PLGA-PEI-TAX-Cy5-S3SI) was added for 30 minutes at room temperature. PLGA-PEI-TAX-S3SI or PLGA-PEI-TAX-Cy5-S3SI was harvested as a pellet with resuspension in PBS buffer (pH 7.4) after 10 minutes of centrifugation at 13,000 rpm. By Fluorescence spectrophotometer (F-2500, HITACHI) detecting Cy5 fluorescence (excitation 649 nm/emission 670 nm), the delivery efficacy of Cy5 siRNA was determined by comparing the amount of Cy5 siRNA in the supernatant with the initial amount of Cy5 siRNA.
PLGA-PEI NP characterization
Electron micrographs of PLGA NPs and PLGA-PEI-S3SI were carried out by placing a drop of the sample onto copper mesh coated with an amorphous carbon film, (Ted Pella Inc, 79725) and dried in a vacuum desiccator. (Thermo Scientific Nalgene Vacuum Desiccator, EW-06520-05) PLGA NPs were stained with phosphotungstic acid before transmission electron microscopy (TEM) (PHILIPS CM-200) at 200KV images were taken. The mean diameter and morphology of PLGA NPs, PLGA-PEI NPs, PLGA-PEI-TAX, PLGA-PEI-S3SI, and PLGA-PEI-TAX-S3SI were characterized by TEM. The hydrodynamic size of all NPs in PBS (pH 7.4) was also determined by dynamic light scattering (DLS) instruments in triplicate at room temperature (Zetasizer® Nano 3000HS Advanced; Malvern Instruments Inc, Malvern, United Kingdom). The surface potential of various PLGA NPs was determined by their zeta potential (Zetasizer).
In vitro release studies
PLGA-PEI NPs carrying fluorescent material such as PLGA-PEI NPs loaded with Oregon Green paclitaxel (excitation 488 nm/emission 535 nm; PLGA-PEI-Ore TAX) or PLGA-PEI-Cy5-S3SI (excitation 649 nm/emission 670 nm) was added into a 1.5-mL Eppendorf tube (Eppendorf, Hamburg, Germany) containing PBS buffer (1 mL, 10 mm, pH 7.4). Supernatant containing fluorescent material from the PLGA NPs was collected by 10-minute centrifugation at 13,000 rpm after specific time intervals. A control experiment (acetone was added to dissolve the PLGA NPs) was performed to determine the fluorescent intensity of the PLGA NPs. The percentage of fluorescent material released at each time point was determined by a F-2500, HITACHI fluorescence spectrophotometer.
Western blotting analysis
Cells were harvested and finally resuspended using a whole cell extraction solution (0.02 M 4-[2-hydroxyethyl]-1-piperazineethanesulfonic acid, pH 7.9; 0.005% nonyl phenoxypolyethoxyethanol; 0.15% glycerol; 0.3 M sodium chloride; 0.001 M ethylenediaminetetraacetic acid; and 0.01 M sodium fluoride) with cocktail protease inhibitors (Roche Diagnostics GmbH, Mannheim, Germany). Lysates were collected by centrifugation after 30 minutes on ice. Protein concentrations were estimated by the Bradford method. Protein (50 μg) from cell lysates was resolved using sodium dodecyl sulfate polyacrylamide gel electrophoresis (BIO-RAD, Mini-PROTEAN Tetra Cell and PowerPac Basic Power Supply #165-8025) and transferred onto polyvinylidene fluoride membranes (Millipore). The membranes were probed with antibodies specific for the proteins of interest. Enhanced chemiluminescence (GE Healthcare, Arlington Heights, IL) was used to develop blots.
Microtubule assembly assay
Cells at a density of 106/100 mm2 dish were treated with indicated concentrations of paclitaxel, PLGA-PEI-TAX, and PLGA-PEI-TAX-S3SI for 24 hours. Cells were washed three times with PBS buffer before adding lysis buffer containing 20 mM tris(hydroxymethyl)aminomethane-hydrogen chloride (pH 6.8), 1 mM magnesium chloride, 2 mM ethylene glycol tetraacetic acid, 1 mM phenylmethylsulfonyl fluoride, 1 mM orthovanadate, 0.5% nonyl phenoxypolyethoxyethanol, and 20 mg/mL proteinase inhibitors (aprotinin, leupeptin, and pepstatin). The supernatant was collected after 10 minutes of centrifugation at 15,000 rpm at 4°C. This resulted in soluble tubulin dimers in the supernatant and polymerized microtubules in the pellet. Equal amounts of the two fractions were partitioned on a protein basis by sodium dodecyl sulfate polyacrylamide gel electrophoresis. Immunoblots were probed with α-tubulin monoclonal antibody.Citation22
Cytotoxicity assay
Cytotoxicity was determined by 3-(4,5-dimethylthiazol-2-yl)-2,5-diphenyl tetrazolium bromide assay. Initially, 1 × 10⁵ cancer cells were grown in a 96-well tissue culture plate. Cells were treated with individual agents in different concentrations for another 48 hours after growing for 24 hours. One-tenth of the original culture volume of the 3-(4,5-dimethylthiazol-2-yl)-2,5-diphenyl tetrazolium bromide stock solution was added to each culture and then incubated for 4 hours at 37°C. The medium was removed after centrifugation and dimethyl sulfoxide was added, dissolving the formazan dye. A microplate reader (Thermo Scientific Multiskan EX, 51118177) measured the absorbance at a wavelength of 490 nm. The cytotoxicity induced by each treatment was calculated as the percentage of viability, which was determined by dividing the optical density values in the drug-treated wells by those in the control wells.
Annexin V-fluorescein isothiocyanate apoptosis study
Asynchronous cultures were set for experiments (2 × 10⁵ cells in six-well plates). Individual wells were treated with free paclitaxel, PLGA-PEI-TAX, and PLGA-PEI-TAX-S3SI for 24 hours. The cells were stained according to the manufacturer’s instructions with Annexin V-fluorescein isothiocyanate and propidium iodine staining assay kit (Invitrogen) and measured by flow cytometry (BD FACSCalibur System, BD Biosciences, San Jose, CA).
Confocal images
Cancer cells were cultured, trypsinized, and seeded in four-well chamber slides (104 cells/well). Each well was washed with PBS buffer twice and cells were treated with free paclitaxel, Oregon Green paclitaxel, or various PLGA-PEI NPs at an indicated time after 24 hours of incubation. Cells were fixed by 4% paraformaldehyde/PBS for 1 hour at room temperature. The slides were incubated with or without anti-Stat3, anti-Stat1, or anti-α-tubulin antibodies (dilution 1:25) overnight at 4°C. Incubation with secondary antibodies conjugated to antimouse Alexa Fluor® 488 and antirabbit Alexa Fluor 594 (Invitrogen) was performed for an indirect immunofluorescence assay. Nuclei were visualized by 4,6-diamidino-2-phenylindole staining (Sigma-Aldrich). A laser (excitation 405, 488, 594, or 649 nm) and a scanning confocal microscope (Fluoview® FV-1000; Olympus Corporation, Tokyo, Japan) detected fluorophores.
Determination of intracellular Oregon Green paclitaxel
Cancer cells (5 × 10⁴) were seeded into a 96-well plate and treated with 62.5 nM Oregon Green paclitaxel or the equivalent amount of drug loaded into PLGA-PEI NPs for 72 hours. As per Meng et al,Citation23 intracellular Oregon Green paclitaxel fluorescence was measured at an excitation/emission wavelength of 485/538 nm with a microplate reader after the cells were washed with cold PBS.
Statistical analysis
IBM® SPSS 13.0 software (SPSS Inc, Chicago, IL) was used to analyze the data. The cancer cell lines study presents the differences between two independent nonnormal distributed groups using the Mann–Whitney U test. Statistical significance was set at P < 0.05.
Results
Stat3 activation leads to chemoresistance in lung cancer cells
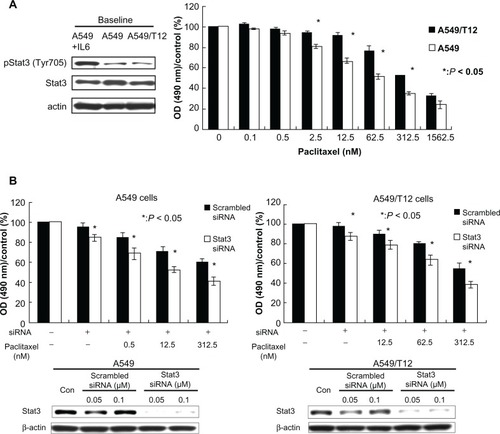
Human lung cancer A549 cells and its paclitaxel-resistant derivative-A549/T12 cells contain activated Stat3 ().Citation21 The half maximal inhibitory concentration was 62.6 nM in A549 cells and 320.3 nM in A549/T12 cells when A549 and A549/T12 cells were treated with paclitaxel for 48 hours. Therefore, A549 cells were more sensitive to paclitaxel than A549/T12 cells (). Stat3 silencing using siRNA sensitized the two cells to paclitaxel in A549 and A549/T12 cells, suggesting that Stat3 activation contributes to cellular resistance to paclitaxel in these two lung cancer cells ().
Figure 1 Constitutively activated signal transducer and activator of transcription-3 (Stat3) in cancer cell lines: parental A549 and A549-derived paclitaxel-resistant A549/T12. (A) Analysis of baseline tyrosine-activated and total Stat3 protein in A549 and A549/T12 cells. The protein extract from A549 cells after treatment with 10 ng/mL interleukin-6 was used as the positive control for activated Stat3 protein for 30 minutes. β-actin protein was used as the loading control. Cell viability was assessed by 3-(4,5-dimethylthiazol-2-yl)-2,5-diphenyl tetrazolium bromide assay after paclitaxel treatment at various dosages (0.1 nM, 0.5 nM, 2.5 nM, 12.5 nM, 62.5 nM, 312.5 nM, and 1562.5 nM) for 48 hours. Each experiment was repeated three times. (B) Stat3 expression was examined after exposure of A549 and A549/T12 cells to 0.05 μM or 0.1 μM scrambled small interfering ribonucleic acid or Stat3 small interfering ribonucleic acid for 48 hours with or without paclitaxel treatment at various dosages (A549 cells: 0.5 nM, 12.5 nM, and 312.5 nM; A549/T12 cells: 12.5 nM, 62.5 nM, and 312.5 nM). β-actin protein was used as the loading control. Cell viability was assessed by 3-(4,5-dimethylthiazol-2-yl)-2,5-diphenyl tetrazolium bromide assay. Each experiment was repeated three times.
Abbreviations: OD, optical density; siRNA, small interfering ribonucleic acid; Stat3, signal transducer and activator of transcription-3.
Synthesis and characteristics of PLGA-PEI-TAX-S3SI
To synthesize PLGA-PEI-TAX-S3SI, paclitaxel was encapsulated into PLGA NPs. Then, the surface of paclitaxel-loaded PLGA NPs was coated with PEI (positive charge). Finally, Stat3 siRNA (negative charge) were carried on the surface of PLGA-PEI-TAX by electrical attraction.
summarizes the average diameter and zeta potential of various PLGA NPs. Measured using TEM, spherical PLGA NPs were observed to be around 80 nm (). The NPs significantly increased in size when either PEI was attached to the surface of PLGA NPs or when PLGA-PEI NPs carried Stat3 siRNA. NP size was slightly larger when measured by DLS compared to TEM measurements (). The final diameter of PLGA-PEI-TAX-S3SI was around 250 nm and 300 nm using TEM and DLS, respectively (). The zeta potential of PLGA NPs was negatively charged, which became positive when PEI was coated onto the surface of PLGA NPs. PLGA-PEI NPs carrying either paclitaxel or Stat3 siRNA did not significantly alter zeta potential. Finally, PLGA-PEI-TAX-S3SI displayed a positive net surface charge ().
Table 1 Average diameter and zeta potential of poly(lactic-co-glycolic acid) nanoparticles
Figure 2 Characteristics of poly(lactic-co-glycolic acid) (PLGA) nanoparticles. (A) Representative transmission electron micrographs featuring PLGA nanoparticles and PLGA-polyethylenimine (PEI) nanoparticles loaded with signal transducer and activator of transcription-3 (Stat3) and small interfering ribonucleic acid (siRNA); siRNA was carried at the outer layer of the PLGA-PEI nanoparticles loaded with siRNA (marked with arrows). Scale bars represent 100 nm. (B) The release percent of encapsulated Oregon Green paclitaxel from PLGA-PEI nanoparticles loaded with Oregon Green paclitaxel and cyanine-5 siRNA from PLGA-PEI loaded with Oregon Green paclitaxel and cyanine-5-labeled Stat3 siRNA were measured in phosphate buffered saline several times within 24 hours (3, 6, 9, 12, and 24 hours) using a fluorescence spectrophotometer. The experiment was performed three times. (C) The release percent of encapsulated Oregon Green paclitaxel from PLGA-PEI nanoparticles loaded with Oregon Green paclitaxel and PLGA-PEI nanoparticles loaded with Oregon Green paclitaxel and Stat3 siRNA was measured in phosphate buffered saline each day using a fluorescence spectrophotometer. The experiment was performed three times. (D) The release percent of cyanine-5 siRNA from PLGA-PEI nanoparticles loaded with cyanine-5-labeled Stat3 siRNA and PLGA-PEI nanoparticles loaded with Oregon Green paclitaxel and cyanine-5-labeled Stat3 siRNA was measured in phosphate buffered saline each day. The experiment was performed three times.
Abbreviations: h, hours; NPs, nanoparticles; PLGA, poly(lactic-co-glycolic acid); PLGA-PEI-Cy5-S3SI, poly(lactic-co-glycolic acid)-polyethylenimine nanoparticles loaded with cyanine-5-labeled signal transducer and activator of transcription-3 small interfering ribonucleic acid; PLGA-PEI-Ore TAX, poly(lactic-co-glycolic acid)-polyethylenimine nanoparticles loaded with Oregon Green paclitaxel; PLGA-PEI-Ore TAX-S3SI, poly(lactic-co-glycolic acid)-polyethylenimine nanoparticles loaded with Oregon Green paclitaxel and signal transducer and activator of transcription-3 small interfering ribonucleic acid; PLGA-PEI-S3SI, poly(lactic-co-glycolic acid)-polyethylenimine nanoparticles loaded with signal transducer and activator of transcription-3 small interfering ribonucleic acid; PLGA-PEI-siRNA, poly(lactic-co-glycolic acid)-polyethylenimine nanoparticles loaded with small interfering ribonucleic acid; PLGA-PEI-TAX-Cy5-S3SI, poly(lactic-co-glycolic acid)-polyethylenimine nanoparticles loaded with paclitaxel and cyanine-5-labeled signal transducer and activator of transcription-3 small interfering ribonucleic acid.
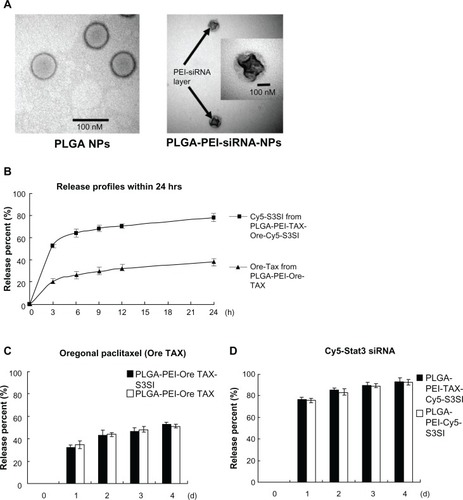
PLGA NPs were stained with phosphotungstic acid to enhance the contrast between PEI and PLGA components and observed using TEM. The surface coating of the PEI-siRNA layer (indicated by arrows) occupied the outer surface of the PLGA NPs, but the distribution was mildly inhomogeneous ().
Delivery efficacy and release profile of the PLGA nanocomplex
The drug loading of PLGA-PEI-TAX was determined by comparing the initial amount of paclitaxel with the amount of nonencapsulated paclitaxel using an ultraviolet-visible spectrum (absorption wavelength: 270 nm). By detecting Cy5 fluorescence (excitation 649 nm/emission 670 nm), the delivery efficacy of Cy5 siRNA by PLGA NPs was determined by comparing the amount of Cy5 siRNA in the supernatant with the initial amount of Cy5 siRNA. The drug loading of PLGA-PEI-TAX and PLGA-PEI-Cy5-S3SI was 2.43% and 32.1%, respectively. There was no difference between PLGA-PEI NPs loaded with and without paclitaxel in the delivery efficacy for Cy5 siRNA ().
Table 2 Drug delivery efficacy of poly(lactic-co-glycolic acid)-polyethylenimine nanoparticles
PLGA-PEI-Ore TAX and PLGA-PEI-Ore TAX-Cy5-S3SI were added to PBS buffer (pH 7.4) to examine their release profile. Fluorescence intensity in the supernatant was detected at each time point. The initial burst release of fluorescent Oregon Green paclitaxel was around 20% within the first 3 hours and 35% within 24 hours from PLGA-PEI-Ore TAX followed by sustained release, which was up to 50% after 96 hours (). In addition, the initial burst release of Cy5 siRNA was around 50% within the first 3 hours and 75% within 24 hours from PLGA-PEI-Ore TAX-Cy5-S3SI followed by sustained release, which was more than 80% after 96 hours ().
Therefore, Cy5 siRNA was released from PLGA-PEI-Ore TAX-Cy5-S3SI first and Oregon Green paclitaxel, initially, was stably encapsulated inside the NPs and then gradually released. The release profile of fluorescent paclitaxel was not significantly influenced by adding siRNA onto the surface of PLGA-PEI-Ore TAX. The Cy5 siRNA release rate was similar between PLGA-PEI NPs loaded with and without paclitaxel ().
A549 and A549/T12 cells were more sensitive to PLGA NPs loaded with paclitaxel than free paclitaxel alone
PLGA-PEI NPs (6 ng of PEI per 1 μg of PLGA) were nontoxic to A549 and A549/T12 cells (). A549/T12 cells were more resistant to paclitaxel than A549 cells (). However, PLGA-PEI-TAX became more cytotoxic to both A549 and A549/T12 cells than paclitaxel alone ().
Figure 3 Poly(lactic-co-glycolic acid)-polyethylenimine nanoparticles loaded with paclitaxel (PLGA-PEI-TAX) was more cytotoxic to A549 and A549/T12 cells than free paclitaxel alone. (A) Cellular viability was assessed by 3-(4,5-dimethylthiazol-2-yl)-2,5-diphenyl tetrazolium bromide assay when A549 and A549/T12 cells were treated with PLGA nanoparticles and PLGA-PEI nanoparticles for 48 hours. Cells were treated with paclitaxel and PLGA-PEI-TAX at various dosages (0.1 nM, 0.5 nM, 2.5 nM, 12.5 nM, 62.5 nM, and 312.5 nM) in A549 cells and T12 cells for 48 hours. (B) Cellular α-tubulin (red) was blotted by immunostaining and subsequent confocal microscopy 3 hours after A549 cells were treated with 12.5 nM of paclitaxel and 12.5 nM of PLGA-PEI-TAX, respectively. The same experiment was performed with 62.5 nM of paclitaxel and 62.5 nM of PLGA-PEI-TAX in A549/T12 cells.
Notes: The nucleus is shown by 4′,6-diamidino-2-phenylindole staining. Tubulin aggregation is marked with arrows. Scale bar is 5 μm.
Abbreviations: NPs, nanoparticles; OD, optical density; PLGA, poly(lactic-co-glycolic acid); PLGA-PEI-TAX, poly(lactic-co-glycolic acid)-polyethylenimine nanoparticles loaded with paclitaxel.
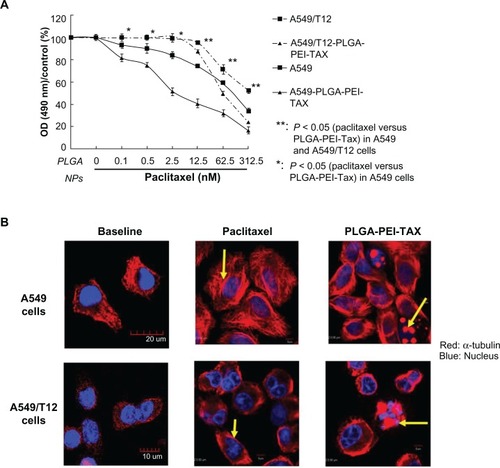
Paclitaxel is well known to induce microtubule stabilization. A549/T12 cells have an α-tubulin mutation compared to A549 cells.Citation21 Indirect fluorescence assay and confocal microscopy was used to demonstrate the change in cellular α-tubulin during PLGA-PEI-TAX treatment. The density of cellular tubulin in A549 cells was more compact at baseline than in A549/T12 cells. Paclitaxel increased the density of microtubules and promoted the formation of long, thick microtubule bundles 3 hours after treatment. shows the comparison of the cellular baseline in A549 and A549/T12 cells. Three hours after treatment with PLGA-PEI-TAX, both A549 and A549/T12 cells became smaller and irregular in shape, which tended to be due to apoptosis (). Hence, PLGA-PEI-TAX was more cytotoxic to lung cancer cells than free paclitaxel.
The effect of PLGA-PEI-S3SI in A549 and A549/T12 cells
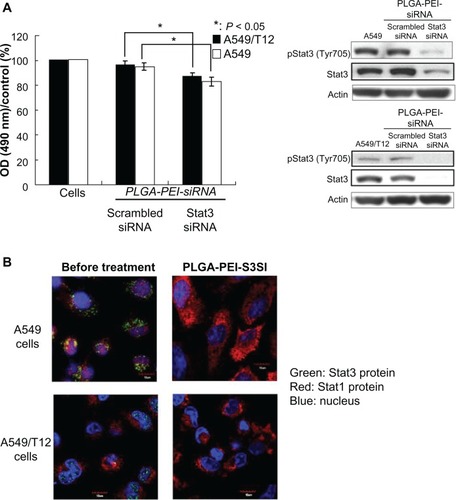
The intracellular Stat3 expression in A549 and A549/T12 cells was only silenced by PLGA-PEI-S3SI when scrambled siRNA or Stat3 siRNA was carried by PLGA-PEI NPs (). Downregulation of Stat3 using PLGA-PEI-S3SI led to cell death in these two cancer cells. Indirect fluorescence assay and confocal microscopy were used to demonstrate the intracellular effect of PLGA-PEI-S3SI. Stat3 and Stat1 were indicated by green and red fluorescence, respectively, in A549 and A549/T12 cells. Stat3 protein colocalized with Stat1 protein (indicated by yellowish fluorescence). Yellowish fluorescence appeared more in the nucleus than in the cytoplasm in A549/T12 cells compared to A549 cells. This might indicate that there were more nuclei Stat3 proteins in A549/T12 cells than in A549 cells. Only red fluorescence (Stat1) was retained in these two cancer cells when Stat3 protein was suppressed by PLGA-PEI-S3SI, which indicates that only Stat3 expression was specifically downregulated by PLGA-PEI-S3SI ().
Figure 4 Poly(lactic-co-glycolic acid)-polyethylenimine nanoparticles loaded with signal transducer and activator of transcription-3 (Stat3) small interfering ribonucleic acid (siRNA) effectively suppressed Stat3 protein. (A) Tyrosine-phosphorylated Stat3 and total Stat3 protein were analyzed in A549 and A549/T12 cells 24 hours after treatment with 0.1 μM of poly(lactic-co-glycolic acid)-polyethylenimine nanoparticles loaded with siRNA (either Stat3 siRNA or scrambled siRNA). β-actin protein was used as the loading control. Cellular survival was assessed by 3-(4,5-dimethylthiazol-2-yl)-2,5-diphenyl tetrazolium bromide assay. (B) Cellular Stat1 (red) and Stat3 (green) proteins were demonstrated with immunostaining and subsequent confocal microscopy at baseline and 24 hours after A549 and A549/T12 cells were treated with 0.1 μM of poly(lactic-co-glycolic acid)-polyethylenimine nanoparticles loaded with Stat3 siRNA.
Notes: The nucleus is shown by 4′,6-diamidino-2-phenylindole staining. Scale bar is 10 μm.
Abbreviations: NPs, nanoparticles; OD, optical density; PLGA-PEI-S3SI, poly(lactic-co-glycolic acid)-polyethylenimine nanoparticles loaded with signal transducer and activator of transcription-3 small interfering ribonucleic acid; PLGA-PEI-siRNA, poly(lactic-co-glycolic acid)-polyethylenimine nanoparticles loaded with small interfering ribonucleic acid; siRNA, small interfering ribonucleic acid; Stat1, signal transducer and activator of transcription-1; Stat3, signal transducer and activator of transcription-3.
Demonstration of PLGA-PEI-Ore TAX-Cy5-S3SI taken up by A549 and A549/T12 cells
PLGA-PEI-TAX-S3SI was synthesized to reduce chemoresistance with Stat3 siRNA followed by paclitaxel killing the cancer cells.
A549 and A549/T12 cells were treated with PLGA-PEI-Ore TAX for 3 hours. Using confocal microscopy, it was found that Oregon Green paclitaxel (greenish fluorescence) was retained in the cytoplasm in A549 and A549/T12 cells (). In addition, more intense greenish fluorescence was seen in A549 and A549/T12 cells treated with PLGA-PEI-Ore TAX than free Oregon Green paclitaxel (). The intracellular uptake of free Oregon Green paclitaxel was improved by delivering the drug via PLGA-PEI NPs in A549 and A549/T12 cells (). There was no difference in the intracellular uptake of Oregon Green paclitaxel between A549 and A549/T12 cells ().
Figure 5 Uptake of poly(lactic-co-glycolic acid)-polyethylenimine nanoparticles loaded with Oregon Green paclitaxel (PLGA-PEI-Ore TAX) was higher in both A549 and A549/T12 cells compared to free Oregon Green paclitaxel. Demonstration of PLGA-PEI nanoparticles simultaneously delivering Oregon Green paclitaxel and cyanine-5-labeled signal transducer and activator of transcription-3 small interfering ribonucleic acid was found in A549 and A549/T12 cells. (A) Confocal microscopy was used to demonstrate intracellular accumulation of 62.5 nM Oregon Green paclitaxel and 62.5 nM PLGA-PEI-Ore TAX (green) 3 hours after treatment in A549 and A549/T12 cells. The left lower square of each panel (magnified cells) shows the different cellular uptake of Oregon Green paclitaxel and PLGA-PEI-Ore TAX in A549 and A549/T12 cells. The nucleus is shown by 4′,6-diamidino-2-phenylindole staining. Scale bar is 10 μm. (B) Intracellular Oregon Green paclitaxel was measured by fluorescence intensity in A549 and A549/T12 cells 3 hours after treatment with 62.5 nM Oregon Green paclitaxel and PLGA-PEI-Ore TAX. (C) Confocal micrograph shows A549 and A549/T12 cells with different interference contrast and different fluorescent-enhanced image 3 hours after treatment with 62.5 nM PLGA-PEI nanoparticles loaded with Oregon Green paclitaxel and cyanine-5-labeled signal transducer and activator of transcription-3 small interfering ribonucleic acid.
Note: Scale bar is either 5 μm or 10 μm.
Abbreviations: Cy5-Stat3 siRNA, cyanine-5-labeled signal transducer and activator of transcription-3 small interfering ribonucleic acid; DAPI, 4′,6-diamidino-2-phenylindole; Ore TAX, Oregon Green paclitaxel; PLGA-PEI-Ore TAX, poly(lactic-co-glycolic acid)-polyethylenimine nanoparticles loaded with Oregon Green paclitaxel.
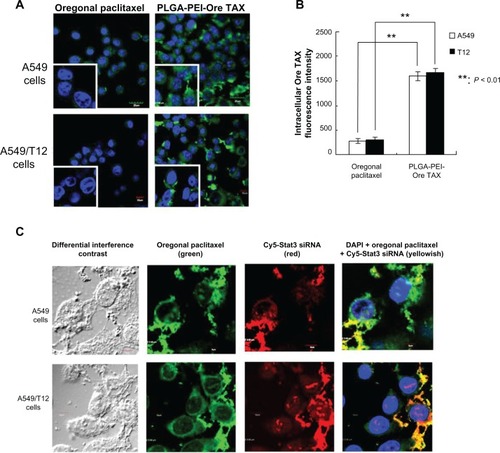
The greenish fluorescence of Oregon Green paclitaxel accumulating in the perinuclear cytoplasmic area in both cancer cells was observed when A549 and A549/T12 cells were treated with PLGA-PEI-Ore TAX-Cy5-S3SI for 3 hours (). The majority of the reddish fluorescence of Cy5-Stat3 siRNA was retained in the cytoplasm. Some reddish fluorescence appeared in the nucleus and was more evident in A549/T12 cells than in A549 cells (). This indicates that 3 hours after PLGA-PEI-Ore TAX-Cy5-S3SI treatment in A549 and A549/T12 cells, some Cy5-Stat3 siRNA was released from the PLGA-PEI NPs and went into the nucleus (). Furthermore, yellowish fluorescence was found in the cytoplasm in both A549 and A549/T12 cells, indicating that there were still many PLGA-PEI NPs simultaneously delivering Oregon Green paclitaxel and Cy5-Stat3 siRNA in the cytoplasm 3 hours after treatment ().
PLGA-PEI-TAX-S3SI effectively kills A549 and A549/T12 cells
A549 and A549/T12 cells were treated for 48 hours with free paclitaxel, PLGA-PEI-TAX, and PLGA-PEI-TAX-S3SI. Cellular survival and Stat3 expression was evaluated. PLGA-PEI-TAX-S3SI was able to downregulate Stat3 expression and had the most cellular toxicity in both A549 and A549/T12 cells ().
Figure 6 Both A549 and A549/T12 cells were more sensitive to poly(lactic-co-glycolic acid)-polyethylenimine nanoparticles loaded with paclitaxel and signal transducer and activator of transcription-3 (Stat3) small interfering ribonucleic acid (PLGA-PEI-TAX-S3SI). (A) Tyrosine-phosphorylated Stat3 and total Stat3 proteins were blotted 24 hours after A549 and A549/T12 cells were treated with PLGA-PEI-TAX-S3SI. β-actin protein was used as the loading control. Cellular survival was assessed by 3-(4,5-dimethylthiazol-2-yl)-2,5-diphenyl tetrazolium bromide assay after 48 hours of treatment with PLGA-PEI-TAX-S3SI and PLGA-PEI-TAX at various dosages (0.5 nM, 12.5 nM, and 312.5 nM in A549 cells; 12.5 nM, 62.5 nM, and 312.5 nM in A549/T12 cells). (B) Polymerized tubulin was observed 24 hours after A549 cells were treated with 12.5 nM paclitaxel, PLGA-PEI-TAX, and PLGA-PEI-TAX-S3SI, respectively. The same treatment was performed in A549/T12 cells with a higher concentration (62.5 nM). Glyceraldehyde 3-phosphate dehydrogenase protein was used as the loading control. The band density ratio (α-tubulin to glyceraldehyde 3-phosphate dehydrogenase) represents data from three experiments (mean ± standard deviation). (C) Flow cytometric analysis of A549 cells treated with 12.5 nM paclitaxel, PLGA-PEI-TAX, and PLGA-PEI-TAX-S3SI for 24 hours, respectively. The same experiment with higher concentration (62.5 nM) was performed in A549/T12 cells.
Notes: The scatter plot of FL1-H (X-scale) versus FL2-H (Y-scale) indicates Annexin V staining and propidium iodine staining. The experiment was repeated three times, and data are shown as mean ± standard deviation.
Abbreviations: GAPDH, glyceraldehyde 3-phosphate dehydrogenase; OD, optical density; PI, propidium iodine; PLGA-PEI-TAX, poly(lactic-co-glycolic acid)-polyethylenimine nanoparticles loaded with paclitaxel; PLGA-PEI-TAX-S3SI, poly(lactic-co-glycolic acid)-polyethylenimine nanoparticles loaded with paclitaxel and signal transducer and activator of transcription-3 small interfering ribonucleic acid; Stat3, signal transducer and activator of transcription-3.
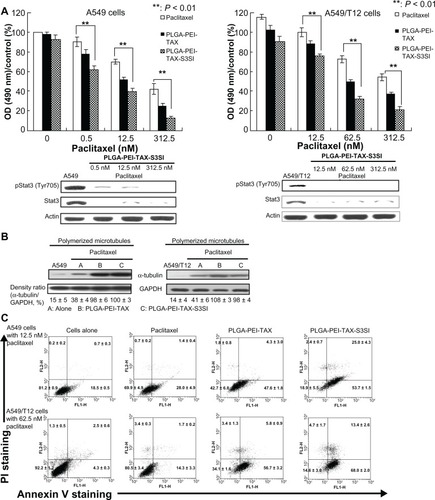
The effect of free paclitaxel, PLGA-PEI-TAX, and PLGA-PEI-TAX-S3SI on microtubule polymerization was explored. PLGA-PEI-TAX and PLGA-PEI-TAX-S3SI induced more microtubule aggregation than free paclitaxel. PLGA-PEI-TAX and PLGA-PEI-TAX-S3SI had a similar effect on microtubules in A549 cells. However, PLGA-PEI-TAX-S3SI-induced tubule aggregation was mildly attenuated in A549/T12 cells compared with A549 cells ().
The mechanism of cell death induced by PLGA-PEI-TAX-S3SI was studied using Annexin V and propidium iodine double staining. It was found that PLGA-PEI-TAX induced more cellular apoptosis in A549 and A549/T12 cells compared to free paclitaxel. PLGA-PEI-TAX-S3SI regulated Stat3 expression, enhancing cellular apoptosis and early necrosis in response to treatment in both A549 and A549/T12 cells compared to PLGA-PEI-TAX (). Conclusively, PLGA-PEI NPs are an ideal platform for the simultaneous delivery of paclitaxel and Stat3 siRNA because it is able to overcome cellular resistance to paclitaxel.
Discussion
Silencing Stat3 reduced cellular resistance to paclitaxel in A549 cells and its paclitaxel-resistant A549/T12 cells. It has been demonstrated that PLGA-PEI NPs is a carrier for drug delivery.Citation17,Citation18 Accordingly, PLGA-PEI-TAX-S3SI was developed to improve cancer treatment. More PLGA-PEI-Ore TAX NPs were taken up by A549 and A549/T12 cells compared to free Oregon Green paclitaxel. Treating these two cancer cells with PLGA-PEI-TAX increased microtubule aggregation and led to more cell death. PLGA-PEI-Ore TAX-Cy5-S3SI was directly seen in A549 and A549/T12 cells using confocal microscopy. Treating cancer cells with PLGA-PEI-TAX-S3SI could suppress Stat3 expression, leading towards more apoptosis and early necrosis. Hence, a nanovector provides a platform for the integration of anticancer drugs and agents to decrease chemoresistance and then enhance treatment efficacy.Citation10,Citation11
NPs with a smaller mean diameter have a lower loading efficacy and faster paclitaxel release due to shorter diffusion paths and larger surface areas.Citation24,Citation25 The loading efficacy of paclitaxel into polyester NPs (around 180 nm in diameter) is about 1%–4% using the oil-to-water emulsion solvent evaporation method.Citation26 Therefore, the loading efficacy of the PLGA NPs (2.43%) had an acceptable profile and it is reasonable to assume that PLGA-PEI-TAX-S3SI was able to exert an anticancer effect in the current study.
When PLGA-PEI NPs are used as a therapeutic carrier to simultaneously deliver paclitaxel (inner part) and Stat3 siRNA (outer layer), the potential cytotoxicity of PEI is a concern. PEI with a higher molecular weight (ie, 25 kDa) shows high cytotoxicity and transfection efficiency, whereas PEI with a lower molecular weight (ie, 1.8 kDa) shows low cytotoxicity and transfection efficiency.Citation27 Ten μg/μL of PEI (ie, 25 kDa) has been shown to be toxic to cells.Citation28 Consistent with Patil and Panyam’s observation,Citation29 the current study showed that PLGA-PEI NPs (PEI molecular weight 25 kDa) did not induce significant toxicity due to the low concentration of PEI in the formulation (6 ng/μg of PLGA).
In accordance with Meng et al,Citation23 the distribution of the PEI-siRNA layer occupying the outer surface of PLGA particle was mildly inhomogeneous, as shown by TEM observation. However, the slightly inhomogeneous distribution of the PEI-siRNA layer did not influence the treatment effect of PLGA-PEI-TAX-S3SI in the current study.
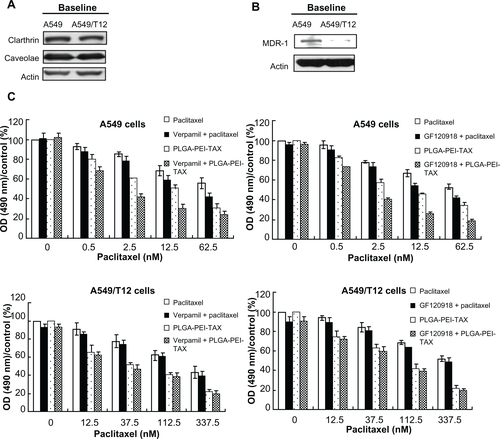
The process that leads to NP entry into the cancer cells is mediated by the clathrin-dependent, caveolae-dependent, or clathrin/caveolae-independent pathway.Citation30 NPs may influence the cells’ biology after entering the cancer cells. Certain NPs may overcome chemoresistance through the inhibition of multidrug resistance-1 (MDR-1) function in MDR-1-overexpressing cancer cells.Citation31 More PLGA-PEI-Ore TAX was taken up by both A549 and A549/T12 cells than free Oregon Green paclitaxel in the current study. Both cancer cells expressed a similar level of clathrin and caveolae (Figure S1A); however, paclitaxel-resistant A549/T12 cells did not express MDR-1 (Figure S1B). Because pretreatment with MDR-1 inhibitors (verapamil and GF120918) had an additive effect on cytotoxicity induced by PLGA-PEI-TAX in A549 cells only (Figure S1C),Citation32 the mechanism that reverses chemoresistance demonstrated by PLGA-PEI-TAX is not limited to modulating MDR-1 function. It could be speculated that PLGA NPs act as a transportation shuttle that lets the cancer cells perform an endocytic uptake of drugs to bypass MDR-1.Citation33 Afterwards, PLGA NPs act as an intracellular drug depot, which gradually uploads their drug payloads far away from the membrane-bound drug efflux to interact with their targets.Citation14,Citation33 Further studies are needed to confirm this assumption.
PLGA NPs start to escape the endosomal compartment 4 hours after treatment.Citation34 PLGA-PEI NPs may have a stronger ability to escape the acidic pH of the endosome than PLGA NPs alone since PEI dissolves more readily in aqueous buffers and has a proton sponge effect.Citation20 Compared to paclitaxel, Stat3 siRNA was more rapidly released from PLGA-PEI-TAX-S3SI within 24 hours. It was found that 3 hours after A549 and A549/T12 cells were treated with PLGA-PEI-Ore TAX-Cy5-S3SI, some Cy5-Stat3 siRNA was released from the PLGA-PEI NPs, but most of the Oregon Green paclitaxel was still bound to the NPs. Hence, Stat3 siRNA may be released first to decrease expression of Stat3 and reduce cellular resistance to paclitaxel before paclitaxel is uploaded from PLGA-PEI-TAX-S3SI NPs in cancer cells. The released paclitaxel then kills the cancer cells effectively.
PLGA-PEI-TAX induced more microtubule aggregation than free paclitaxel in both A549 and A549/T12 cells. This might be due to the greater uptake of PLGA-PEI-TAX by cancer cells. Tubulin aggregation was attenuated in A549/T12 cells compared to that in parental A549 cells when Stat3 was downregulated by PLGA-PEI-TAX-S3SI. Activation of Stat3 has been implicated in antagonizing stathmin-induced microtubule depolymerization.Citation35 The active nonphosphorylated form of stathmin is higher in A549/T12 cells harboring the α-tubule mutation compared to parental A549 cells.Citation21 Therefore, Stat3 suppression in A549/T12 cells is likely to enhance the stathmin-induced microtubule depolymerization in A549/T12 cells and could result in less tubulin aggregation after paclitaxel treatment. Inhibition of Stat3 activation decreases cell viability, increases apoptosis, and reduces cellular resistance to paclitaxel.Citation7 Thus, PLGA-PEI-TAX-S3SI treatment effectively leads both cancer cells towards apoptosis and early necrosis.
The diameter of PLGA-PEI-TAX in the current study was about 300 nm, as measured by DLS. Although experiments from animal studies suggest that the optimal NP cancer therapeutics should range from 10–150 nm,Citation36 130–750-nm NPs are considered suitable for delivery of therapeutic modalities to the lungs.Citation37 Patil and Panyam reported the formulation of a biotin-functionalized PLGA-PEI nanovector (240 nm) loaded with the combination of paclitaxel and P-glycoprotein-targeted siRNA. They demonstrated that this nanovector had significant cytotoxicity in vivo through the intravenous route.Citation38 They found a 15% and 20% release of paclitaxel and siRNA, respectively, in the first 24 hours. A sustained release of up to 25% for paclitaxel and 45% for siRNA was observed during the first 3 days.Citation38 The release profile of paclitaxel and siRNA from PLGA-PEI-TAX-S3SI in the current study was better (). Further studies testing the activity and safety in vivo are needed to detect whether Stat3 siRNA carried by PLGA-PEI-TAX-S3SI will be degraded in blood or induce immune reaction in vivo.
Conclusion
A solvent evaporation and stabilizer-free method was developed to synthesize the PLGA-PEI-TAX-S3SI nanocomplex, which can be taken up by cancer cells to downregulate Stat3 protein and kill lung cancer cells effectively. PLGA-PEI NPs may provide a platform for the integration of anticancer drugs and siRNA to improve cancer treatment.
Acknowledgements
The National Science Council (Grant NSC-97-2314-B-006-013-MY3 and NSC100-2120-M-006-002) and the Department of Health (Grant DOH-100-TD-PB-111-TM-014, DOH101-TD-B-111-102, and DOH101-TD-C-111-003) supported this study.
Disclosure
The authors report no conflicts of interest in this work.
Supplementary figure
Figure S1 Multidrug resistance-1 (MDR-1), clathrin, and caveolae protein expression in A549 and A549/T12cells and pretreatment with MDR-1inhibitors influenced the cellular survival of A549 and A549/T12cells treated with paclitaxel and poly(lactic-co-glycolic acid)-polyethylenimine nanoparticles loaded with paclitaxel. (A) Analysis of baseline clathrin and caveolae protein expression in A549 and A549/T12 cells. β-actin protein was used as the loading control. (B) Analysis of baseline MDR-1 protein expression in A549 and A549/T12cells. (C) Cellular survival of A549 and A549/T12cells was assessed by 3-(4,5-dimethylthiazol-2-yl)-2,5-diphenyl tetrazolium bromide assay after 48hours of treatment with paclitaxel and poly(lactic-co-glycolic acid)-polyethylenimine nanoparticles loaded with paclitaxel, with and without pretreatment of MDR-1inhibitors (verapamil and GF120918).
Abbreviations: MDR-1, multidrug resistance-1; OD, optical density; PLGA-PEI-TAX, poly(lactic-co-glycolic acid)-polyethylenimine nanoparticles loaded with paclitaxel.
References
- JankuFStewartDJKurzrockRTargeted therapy in non-small-cell lung cancer – is it becoming a reality?Nat Rev Clin Oncol20107740141420551945
- ScagliottiGVPotential role of multi-targeted tyrosine kinase inhibitors in non-small-cell lung cancerAnn Oncol200718Suppl 103241
- DarnellJEJrStats and gene regulationScience19972775332163016359287210
- JingNTweardyDJTargeting Stat3 in cancer therapyAnticancer Drugs200516660160715930886
- GritskoTWilliamsATurksonJPersistent activation of Stat3 signaling induces survivin gene expression and confers resistance to apoptosis in human breast cancer cellsClin Cancer Res2006121111916397018
- SongLTurksonJKarrasJGJoveRHauraEBActivation of Stat3 by receptor tyrosine kinases and cytokines regulates survival in human non-small cell carcinoma cellsOncogene200322274150416512833138
- IkutaKTakemuraKKiharaMOverexpression of constitutive signal transducer and activator of transcription 3 mRNA in cisplatin-resistant human non-small cell lung cancer cellsOncol Rep200513221722215643501
- KawakamiSHashidaMTargeted delivery systems of small interfering RNA by systemic administrationDrug Metab Pharmacokinet200722314215117603214
- PutralLNGuWMcMillanNARNA interference for the treatment of cancerDrug News Perspect200619631732416971967
- WangYGaoSYeWHYoonHSYangYYCo-delivery of drugs and DNA from cationic core-shell nanoparticles self-assembled from a biodegradable copolymerNat Mater200651079179616998471
- DevalapallyHDuanZSeidenMVAmijiMMModulation of drug resistance in ovarian adenocarcinoma by enhancing intracellular ceramide using tamoxifen-loaded biodegradable polymeric nanoparticlesClin Cancer Res200814103193320318483388
- JainRAThe manufacturing techniques of various drug loaded biodegradable poly(lactide-co-glycolide acid) (PLGA) devicesBiomaterials200021232475249011055295
- PanyamJLabhasetwarVBiodegradable nanoparticles for drug and gene delivery to cells and tissueAdv Drug Deliv Rev200355332934712628320
- PanyamJLabhasetwarVSustained cytoplasmic delivery of drugs with intracellular receptors using biodegradable nanoparticlesMol Pharm200411778415832503
- BilatiUAllemannEDoelkerEDevelopment of a nanoprecipittion method intended for the entrapment of hydrophilic drugs into nanoparticlesEur J Pharm Sci2005241677515626579
- CuiWBeiJWangSPreparation and evaluation of poly(L-lactide-co-glycolide) (PLGA) microbubbles as a contrast agent for myocardial contrast echocardiographyJ Biomed Mater Res B Appl Biomater200573117117815678494
- ChengFYWangPHSuCHStabilizer-free poly(lactide-co-glycolide) nanoparticles for multimodal biomedical probesBiomaterials200829132104211218276001
- ChengFYSuCHWuPCYehCSMultifunctional polymeric nanoparticles for combined chemotherapeutic and near-infrared photothermal cancer therapy in vitro and in vivoChem Commun (Camb)201046183167316920424762
- YuanXNaguibSWuZRecent advances of siRNA delivery by nanoparticlesExpert Opin Drug Deliv20118452153621413903
- YezhelyevMVQiLO’ReganRMNieSGaoXProton-sponge coated quantum dots for siRNA delivery and intracellular imagingJ Am Chem Soc2008130289006901218570415
- MartelloLAVerdier-PinardPShenHJElevated levels of microtubule destabilizing factors in a Taxol-resistant/dependent A549 cell line with an alpha-tubulin mutationCancer Res20036361207121312649178
- HsiehCCKuoYHKuoCCChamaecypanone C, a novel skeleton microtubule inhibitor, with anticancer activity by trigger caspase 8-Fas/FasL dependent apoptotic pathway in human cancer cellsBiochem Pharmacol20107991261127120034474
- MengHLiongMXiaTEngineered design of mesoporous silica nanoparticles to deliver doxorubicin and P-glycoprotein siRNA to overcome drug resistance in a cancer cell lineACS Nano2010484539455020731437
- DongYFengSSIn vitro and in vivo evaluation of methoxy polyethylene glycol-polylactide (MPEG-PLA) nanoparticles for small-molecule drug chemotherapyBiomaterials200728284154416017576004
- ZhangXLiYChenXSynthesis and characterization of the paclitaxel/MPEG-PLA block copolymer conjugateBiomaterials200526142121212815576187
- GaucherGMarchessaultRHLerouxJCPolyester-based micelles and nanoparticles for the parenteral delivery of taxanesJ Control Release2010143121219925835
- KimYHParkJHLeeMKimYHParkTGKimSWPolyethylenimine with acid-labile linkages as a biodegradable gene carrierJ Control Release2005103120921915710512
- GwakSJKimBSPoly(lactic-co-glycolic acid) nanosphere as a vehicle for gene delivery to human cord blood-derived mesenchymal stem cells: comparison with polyethylenimineBiotechnol Lett20083071177118218317698
- PatilYPanyamJPolymeric nanoparticles for siRNA delivery and gene silencingInt J Pharm20093671–219520318940242
- SahayGAlakhovaDYKabanovAVEndocytosis of nanomedicinesJ Control Release2010145318219520226220
- DongXMattinglyCATsengMTDoxorubicin and paclitaxel-loaded lipid-based nanoparticles overcome multidrug resistance by inhibiting P-glycoprotein and depleting ATPCancer Res20096993918392619383919
- MayurYCPetersGJPrasadVVLemoCSathishNKDesign of new drug molecules to be used in reversing multidrug resistance in cancer cellsCurr Cancer Drug Targets20099329830619442050
- HuCMZhangLTherapeutic nanoparticles to combat cancer drug resistanceCurr Drug Metab200910883684120214578
- CartieraMSJohnsonKMRajendranVCaplanMJSaltzmanWMThe uptake and intracellular fate of PLGA nanoparticles in epithelial cellsBiomaterials200930142790279819232712
- NgDCLinBHLimCPStat3 regulates microtubules by antagonizing the depolymerization activity of stathminJ Cell Biol2006172224525716401721
- DavisMEChenZGShinDMNanoparticle therapeutics: an emerging treatment modality for cancerNat Rev Drug Discov20087977178218758474
- AzarmiSRoaWHLobenbergRTargeted delivery of nanoparticles for the treatment of lung diseasesAdv Drug Deliv Rev200860886387518308418
- PatilYBSwaminathanSKSadhukhaTMaLPanyamJThe use of nanoparticle-mediated targeted gene silencing and drug delivery to overcome tumor drug resistanceBiomaterials201031235836519800114