Abstract
Objectives
This study aims to investigate the adhesion characteristics between submicron calcium oxalate dihydrate (COD) with a size of 150 ± 50 nm and African green monkey kidney epithelial cells (Vero cells) before and after damage, and to discuss the mechanism of kidney stone formation.
Methods
Vero cells were oxidatively injured by hydrogen peroxide to establish a model of injured cells. Scanning electron microscopy was used to observe Vero–COD adhesion. Inductively coupled plasma emission spectrometry was used to quantitatively measure the amount of adhered COD microcrystals. Nanoparticle size analyzer and laser scanning confocal microscopy were performed to measure the change in the zeta potential on the Vero cell surface and the change in osteopontin expression during the adhesion process, respectively. The level of cell injury was evaluated by measuring the changes in malonaldehyde content, and cell viability during the adhesion process.
Results
The adhesion capacity of Vero cells in the injury group to COD microcrystals was obviously stronger than that of Vero cells in the control group. After adhesion to COD, cell viability dropped, both malonaldehyde content and cell surface zeta potential increased, and the fluorescence intensity of osteopontin decreased because the osteopontin molecules were successfully covered by COD. Submicron COD further damaged the cells during the adhesion process, especially for Vero cells in the control group, leading to an elevated amount of attached microcrystals.
Conclusion
Submicron COD can further damage injured Vero cells during the adhesion process. The amount of attached microcrystals is proportional to the degree of cell damage. The increased amount of microcrystals that adhered to the injured epithelial cells plays an important role in the formation of early-stage kidney stones.
Introduction
Surgical treatment of kidney stones has made great progress. However, the incidence and recurrence rates of kidney stones are still high. The main component of kidney stones is calcium oxalate (CaOxa); its concentration in the urine of healthy people is four times higher than its solubility when no kidney stones are formed. Therefore, the supersaturation of urinary stone salts is a prerequisite, but not the only requirement, for kidney stone formation.Citation1,Citation2
The time for urine to flow through the renal tubules can be calculated according to the tubular diameter and length as well as the flow rate of urine. Considering the growth speed of CaOxa in urine, free single microcrystals cannot grow into the size necessary to block the tubules within the short time of flowing through the tubules.Citation3 Only the free urine microcrystals that have been fixed onto the surface of renal tubular epithelial cells can grow and form stones.Citation4,Citation5 Specifically, the adhesion between urine microcrystals and renal tubular epithelial cells is a key process in kidney stone formation.
Renal tubular epithelial cell injury is an important prerequisite to promoting the adhesion of urine microcrystals.Citation4,Citation6 At the molecular and supramolecular levels, the structure of renal tubular epithelial cell membrane changes after injury caused by CaOxa microcrystals, high concentrations of oxalic acid, or other factors. For example, the negatively charged phosphatidylserine within the cell membrane will become valgus, and CD44 and hyaluronic acid will be expressed on the cell surface.Citation7–Citation9 These changes provide effective sites for the nucleation and growth of urine microcrystals, promote the formation of early microstones, and also enhance the adhesion between the cell membrane and urine microcrystals to accelerate the formation of kidney stones.
CaOxa monohydrate (COM) is the most thermodynamically stable crystal form of CaOxa. However, Ca2+ and Oxa2− often precipitate as CaOxa dihydrate (COD) in supersaturated urine because of the stronger adhesion of COM with renal tubular epithelial cells, which poses more severe damage on cells. Therefore, the precipitation of relatively less harmful COD crystals in urine is a type of self-protection for organisms. This also reveals the existence of adhesion between COD microcrystals with renal tubular epithelial cells in the human body.Citation10
However, the current research on adhesion between renal tubular epithelial cells and crystals mainly focuses on micron grade COM and COD crystals.Citation6,Citation11 Only a few studies about nanocrystals in urine are available,Citation12,Citation13 and the interaction between renal tubular epithelial cells and CaOxa crystals with a size of less than 200 nm has yet to be reported. In fact, numerous submicron microcrystals exist in urine, and these microcrystals are the basis for the formation of micron grade crystals. Therefore, this study investigated the adhesion of COD microcrystals with a size of 150 ± 50 nm and African green monkey renal epithelial cells (Vero cells) to understand further the molecular and cellular mechanism of kidney stone formation.
Materials and methods
Materials and apparatus
Vero cells were purchased from Shanghai Cell Bank, Chinese Academy of Sciences (donated by Professor Yi-Fei Wang of Biomedical Research and Development Center of Jinan University, Guangzhou, China). Dulbecco’s modified Eagle medium: nutrient mixture F12 was from Thermo Scientific HyClone (Logan, UT), and Gibco® newborn calf serum was from Life Technologies (Carlsbad, CA). The primary antibody of osteopontin (OPN) and fluorescein isothiocyanate secondary antibody were from Santa Cruz Biotechnology (Santa Cruz, CA). Cell proliferation assay kit (Cell Counting Kit-8) was from Dojindo Laboratories (Kumamoto, Japan). The MDA kit was from Jiancheng Institute of Biotechnology (Nanjing, China). The Iwaki® cell culture plate was from AGC Techno Glass (Chiba, Japan). All other reagents were of analytically pure grade.
The XL-30 environmental scanning electron microscope (SEM) was from Philips (Eindhoven, the Netherlands). The nanoparticle size zeta potential analyzer (Zetasizer® Nano ZS) was from Malvern Instruments Ltd (Malvern, United Kingdom). The laser confocal microscope (LSM; 510 META duo scan) was from Carl Zeiss AG (Oberkochen, Germany). The enzyme mark instrument Safire™ was from Tecan Group Ltd (Mannedorf, Switzerland). The Optima™ 2000 DV inductively coupled plasma emission spectrometer (ICP) was from PerkinElmer (Waltham, MA). Powder X-ray diffraction (XRD) results were recorded on a D/max-γA X-ray diffractometer (Rigaku Corporation, Tokyo, Japan) using nickel-filtered copper Kα radiation (λ = 1.54 Å) and a scanning rate of 2 degrees/minute at 40 kV, 30 mA. The divergence and scattering slit was 1 degree for the range of 5 degrees to 60 degrees 2θ. The IFS25 Fourier transform infrared spectrometer (FT-IR) was from Bruker SA (Wissembourg, France). Scan range was 4000–400 cm−1 and the resolution was 0.5 cm−1. The morphology of CaOxa was identified according to King et al,Citation14 and COD was compared with American Society for Testing and Materials card number 17-541. The centrifuge was from Eppendorf (5804 R, Germany).
Experimental methods
Preparation of submicron COD crystals and COD suspension
Submicron COD crystals were prepared through the complex precipitation method using nitrilotriacetic acid as complexant. That is, 0.3 mol/L calcium chloride was mixed with an equal amount of nitrilotriacetic acid, and then 0.3 mol/L potassium oxalate was added at 1 mL/minute with fast agitation at 75°C. After standing for 30 minutes, the precipitation was separated via centrifugation, washed twice with distilled water, and vacuum dried. The characteristics of the products were determined through SEM, XRD, and FT-IR. The average dimension of the COD microcrystals was 150 ± 50 nm. COD suspension was prepared using serum-free medium with a final concentration of 100 μg/mL.
Vero cell culture, damage, and adhesion with COD microcrystals
The experiments were performed as described previously.Citation15 The cell suspension was inoculated in suitable plates and incubated at 37°C for 24 hours, with 5% carbon dioxide and saturated humidity. After 24 hours, the media were changed to serum-free culture media and the cells were incubated for 12 hours to achieve synchronization (the total incubation time was 36 hours). The cells were then divided into groups A and B. The cells in group A (control group) were exposed to serum-free culture medium only, whereas the cells in group B (injury group) were injured with 0.3 mmol/L hydrogen peroxide. Serum-free culture media containing COD microcrystals (with 100 μg/mL concentration) were added to the two groups. After 2, 6, 12, 18, and 24 hours of adhesion, cell viability was determined using the Cell Counting Kit-8 method. Malonaldehyde (MDA) content was measured with an MDA test kit. OPN expression on the cell surface was determined through the fluorescence quantitative method. The zeta potential of the COD crystals was determined using a nanoparticle size analyzer. Vero–COD adhesion was observed via SEM, and the amount of adhered COD microcrystals was quantitatively analyzed via ICP.
SEM observation and ICP detection of the adhered COD microcrystals
Cells (2 × 10⁵ cell/mL) were plated in twelve-well plates (1 mL/well) with cover slips at the bottom. After cocultured with COD suspension for different culture times, the cover slips were removed, and the nonadherent crystals were washed away with D-Hank’s solution.
For SEM observation, the cells and crystals on the cover slips were fixed with 2.5% glutaraldehyde at 4°C for 24 hours, dehydrated in an ethanol gradient (30%, 50%, 70%, 90%, and 100%), refixed with isoamyl acetate, dried under the critical point of carbon dioxide, and then treated with gold sputtering. Adhesion between cells and crystals was observed via SEM.
For ICP detection, the cover slips were taken out and placed in 25 mL beakers. Then, 10 mL nitric acid and 0.5 mL perchloric acid were added, and the samples were digested on an electric stove until a clear solution was formed. The samples were continuously heated until the perchloric acid was boiling, smoking, and nearly dried. The residual heat of the electric stove was used to dry the samples, which were then allowed to cool down at room temperature. Thereafter 3 mL water was added to the beaker to dissolve the residue. The concentration of Ca2+ in the solution was measured using the ICP method. The number of associated COD microcrystals was calculated from the concentrations of Ca2+ ions, and the results were expressed in μg/cm2.
Zeta potential measurement
Vero cells (4 × 10⁵ cells/mL) were plated in six-well plates (2 mL/well) and then cocultured with COD suspension for different times. Nonadherent crystals were washed away with D-Hank’s solution, and 0.25% trypsin containing 0.02% ethylenediaminetetraacetic acid digestion solution was added. The cells were blown well to form a single cell suspension and then centrifuged at 1000 rpm for 3 minutes. The supernatant was removed, and then the cells and crystals were resuspended in 1000 μL D-Hank’s solution (pH 7.86). Approximately 800 μL suspension fluid was injected into the sample pool to measure zeta potential using a nanoparticle analyzer.
Quantitative detection of OPN fluorescence
Vero cells were plated in six-well plates (4 × 10⁵ cell/mL, 2 mL/well) with cover slips at the bottom and then incubated with COD suspension for different times. OPN expression was observed via LSM with OPN primary antibody and fluorescein isothiocyanate secondary antibody as previously described.Citation15
Statistical method
The experimental results were analyzed statistically using IBM® SPSS 16.0 software (SPSS Inc, Chicago, IL). The difference in means between the experimental groups and the control group were analyzed using Tukey’s test. The difference was significant if P < 0.05, extremely significant if P < 0.01, and nonsignificant if P > 0.05. All experiments were performed at least three times independently, except ICP detection.
Results and discussion
Characterization of COD microcrystals
shows the SEM images of submicron COD crystals. Different from the micron-sized COD, some submicron COD did not display the typical morphology of double pyramids with four corners. The dimension of COD ranged from 100–200 nm with an average of approximately 150 nm.
Figure 1 Morphology and composition analysis of ultrafine calcium oxalate dihydrate microcrystals by (A) scanning electron microscopy (scale bar = 1 μm), (B) X-ray diffraction, and (C) Fourier transform infrared spectroscopy.
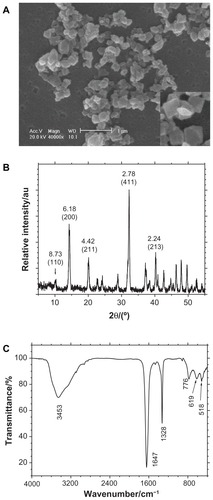
The composition of the prepared crystals was confirmed through XRD and FT-IR. The XRD patterns () demonstrated that the crystals were COD crystals. The crystal plane spacings (d value) in the pattern were 0.873, 0.618, 0.442, 0.278, and 0.224 Å, which correspond to the (110), (200), (211), (411), and (213) planes of COD, respectively.Citation14 The FT-IR spectra () of the crystals showed a strong single absorption peak at 3453 cm−1, which was significantly different from the multiple peaks of the COM crystals that appeared within the 3000 cm−1 to 3600 cm−1 region with multiple peaks.Citation16 The asymmetrical stretching vibration uas(COO−) of carbonyl appeared at 1647 cm−1, whereas us(COO−) appeared at 1328 cm−1. Both peaks indicated the presence of only COD crystals. That is, the XRD and FT-IR results proved that the prepared crystals were pure COD and without any COM.
Morphology change in Vero cells before and after injury
Vero cells were injured by oxidative damage after being incubated with 0.3 mmol/L hydrogen peroxide for 1 hour, causing morphological changes. Most of the Vero cells in the control group exhibited a typical spindle shape with full intact morphology and microvilli (). However, the cells shrank after injury by hydrogen peroxide, with abscission of microvilli (). After the injury, the cell viability decreased from 100% (control group) to 70.5% (P < 0.05).
Figure 2 Scanning electron microscope images (scale bar = 10 μm) after the adhesion of calcium oxalate dihydrate with African green monkey kidney epithelial cells in the control group at (A) 2 hours, (B) 6 hours, (C) 12 hours, and (D) 24 hours.
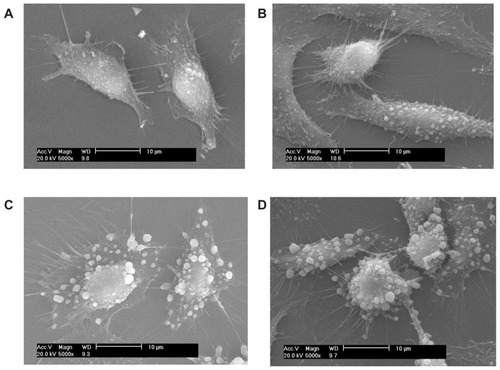
Figure 3 Scanning electron microscope images (scale bar = 10 μm) after the adhesion of calcium oxalate dihydrate with African green monkey kidney epithelial cells in the injury group at (A) 2 hours, (B) 6 hours, (C) 12 hours, and (D) 24 hours.

Junction complexes were not observed in the SEM illustrations. This result may be attributed to the following reasons. First, after a series of washing, dehydration, and drying during the sample preparation process, the samples experienced cell loss and cell size reduction. Some tight junctions were also fractured. Second, to clarify the details on cell–crystal adhesion, some areas where the cells were relatively sparse were factitiously selected and then photographed. Third, endocytosis occurred as early as 30 minutes after exposure of the cells to the crystals.Citation17 During endocytosis, the formed cell–crystal complexes appeared to separate from the monolayer, and large gaps appeared at cell–cell contact regions.Citation18
Changes in Vero cell viability during crystal adhesion
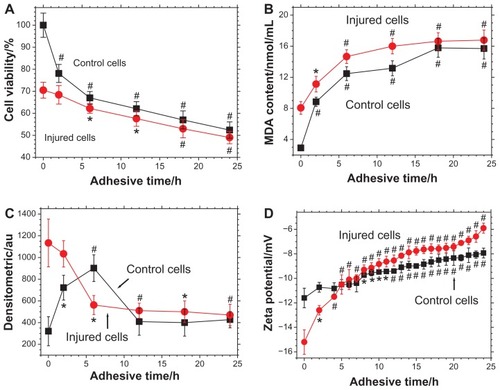
shows the changes in cell viability during the process of adhesion between Vero cells and submicron COD. As the adhesion time increased from 0 hours to 24 hours, Vero cell viability in the control group decreased from 100% to 52.4% (P < 0.01), whereas the viability of injured Vero cells decreased from 70.5% to 49% (P < 0.01). This result indicated that COD microcrystals caused further damage to the cells during the adhesion process, thus decreasing cell viability. Particularly, the viability of Vero cells in the control group decreased promptly during 0–6 hours, indicating that COD posed severe injury on Vero cells of the control group.
Figure 4 Changes in (A) cell viability, (B) malonaldehyde content, (C) osteopontin expression, and (D) zeta potential during the adhesion process between calcium oxalate dihydrate microcrystals and African green monkey kidney epithelial cells in both the control and injury groups.
Notes: *P < 0.05; #P < 0.01 compared with cells not exposed to calcium oxalate dihydrate microcrystals.
Abbreviations: h, hour; MDA, malonaldehyde.
However, previous reports showed that COD microcrystals only produce slight damage or no damage to cells and that COD could even promote cell proliferation.Citation19,Citation20 In these reports, the cell viability at 0 hours was selected as the blank value. Owing to the strong self-repair ability and self-proliferation capability of the cells (including control group and injury group), the cell viability value of self-proliferation was increased with increasing adhesion time. It became even larger than the reduced viability value caused by COD-induced cell damage. This phenomenon resulted in unexpected stronger cell viability after adhesion to COD for a set time, leading to the conclusion that “COD microcrystals could promote cell proliferation.”Citation19,Citation20 In fact, studies on COM microcrystals also showed similar results.Citation19,Citation21
However, in this study, the blank values of cell viability were those after 24 hours of incubation without microcrystal addition. The experiments for different adhesion times (24, 18, 12, 6, and 2 hours) started at 0, 6, 12, 18, and 22 hours, respectively. At 24 hours, all adhesion experiments were terminated, and the cell viability of each group was determined simultaneously. With this design, the results could reflect the effect of COD microcrystals on cell viability because the effect of cell self-proliferation was largely eliminated.
The difference between the results of the current study and those of previous studiesCitation19,Citation20 may be also ascribed to other grounds. For example, different cell lines might behave differently when they interact with CaOxa crystals. In previous studies, human kidney-2 cells and Madin–Darby canine kidney cells were used,Citation19,Citation20 whereas Vero cells were used in the current study. Moreover, different sized CaOxa crystals were used. The average size of the crystals used in previous studies was more than 20 μm and 0.7 (0.4–2.0) μm, respectively,Citation19,Citation20 both of which were much larger than that of the submicron crystals used in the current study. Thus, the experimental results () of the current study are entirely different from the conclusions in previous reports.Citation19,Citation20
Change in MDA content during adhesion of COD and Vero cells
The measurement of MDA content during adhesion further supported the conclusion that COD microcrystals could damage Vero cells. The results are shown in .
Before adhesion (ie, at 0 hours), the MDA content released by Vero cells in the control group was 2.91 nmol/mL, whereas it increased to 8.06 nmol/mL in the injury group (P < 0.01). Elevated MDA content is an obvious sign of cell oxidative damage.Citation22,Citation23 This result was consistent with that of cell viability determination (), which was demonstrated via the evident injury effect of hydrogen peroxide on Vero cells.
For Vero cells in the injury group, the MDA content augmented constantly during adhesion to COD microcrystals, suggesting that submicron COD could continually produce new damage to cells.
For Vero cells in the control group, after adhesion to COD microcrystals for 2 hours, the MDA content increased rapidly from 2.91 nmol/mL to 8.85 nmol/mL (P < 0.01). This finding indicated that COD microcrystals caused noticeable damage to Vero cells in the control group. After 2 hours, the MDA content slowly rose, and the changing trend was similar to that in the injury group. These data revealed that after 2 hours, the adhesion process between COD and Vero cells in the control group was similar to that in the injury group.
During adhesion to COD microcrystals, the MDA content in the injured Vero cells was generally higher than that in the control group. This result suggested that the injured Vero cells were damaged more severely and suffered from a stronger oxidative stimulation.
Quantitative detection of OPN expression during the adhesion process
OPN is a phosphorylated glycoprotein with rich saliva acid and a molecular weight of 60–80 kDa.Citation24,Citation25 OPN is one of the important organic matrices in kidney stones. Both animal experiments and cell model experiments have shown that OPN expression could promote the formation of kidney stones.Citation24
The expression of OPN during the Vero–COD adhesion process was observed via LSM. The LSM images were the overall average results of the experiments in duplicate with three repetitions. The representative LSM images are shown in and , and the quantitative analysis results are shown in .
Figure 5 Laser scanning confocal microscope images (630×) showing fluorescent changes in osteopontin on African green monkey kidney epithelial cells after the adhesion of calcium oxalate dihydrate with the epithelial cells in the control group at (A) 0 hours, (B) 6 hours, (C) 12 hours, and (D) 24 hours. Note: The nucleus is blue, and the expressed osteopontin is green.
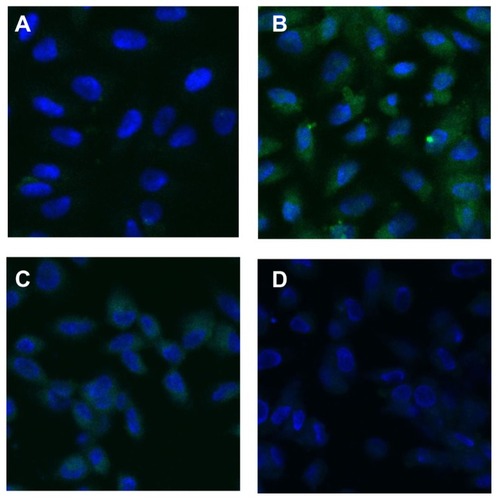
Figure 6 Laser scanning confocal microscope images (×630) showing fluorescent changes of osteopontin on African green monkey kidney epithelial cells after the adhesion of calcium oxalate dihydrate with the epithelial cells in the injury group at (A) 0 hours, (B) 6 hours, (C) 12 hours, and (D) 24 hours.
Note: The nucleus is blue, and the expressed osteopontin is green.
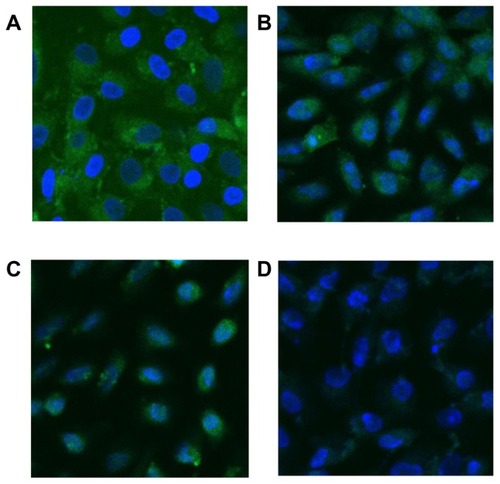
More OPN molecules were expressed by Vero cells in the injury group before adhesion ( and ), with a relative expression level of 1134 (P < 0.01), which was much higher than 321, the relative OPN expression level of Vero cells in the control group.
Adhesion between Vero cells in the control group and COD microcrystals
As shown in , the fluorescence intensity of OPN on the cell surface at 0–6 hours increased with adhesion time and reached the maximum 902 (P < 0.01) at 6 hours. This finding may be attributed to the high level of COD-induced injury at the beginning of adhesion that led to the elevated expression of OPN molecules on Vero cells and enhanced fluorescence intensity. This result was consistent with that of cell viability () and MDA measurements ().
At 6–24 hours, the fluorescence intensity of OPN decreased () because the OPN molecules enriched on the Vero cell surface adhered to COD, resulting in the reduced binding of OPN molecules to the fluorescent antibody and thus weakening OPN fluorescence intensity.
Adhesion between Vero cells in the injury group and COD microcrystals
As shown in , at 0–6 hours, the fluorescence intensity of OPN on the cell surface gradually weakened and reached 602 (P < 0.05) at 6 hours, which was completely opposite to the changing trend in the control group. The reason for this finding was that the highly expressed OPN molecules by the injured cells had very strong adhesion ability and could fully adhere with COD in a relatively short time (6 hours) to a state of saturated adhesion. When OPN molecules were adhered by COD, the exposed OPN molecules that could bind to the fluorescent antibody would decrease, causing weakened fluorescence. The reduction in OPN production was also caused by cell death, which could not perform properly.Citation26 The apoptosis and necrosis rates of the injured cells were confirmed to be 4.6% and 1.4%, respectively. These data were all higher than those of the control cells (2.8% and 1.31%).Citation27
The results of cell viability, MDA content, and OPN expression level showed that submicron COD can severely damage Vero cells during the first 6 hours of adhesion process. This finding is inconsistent with previous reports.Citation19–Citation21 Exposure of renal epithelial cells to CaOxa crystals increases the synthesis of monocyte chemoattractant protein-1 and prostaglandin, both of which are known to participate in inflammatory processes.Citation28 Therefore, aside from the aforementioned selection of different blank values, this inconsistency can also be attributed to the strong endocytosic ability of Vero cells to submicron COD (150 ± 50 nm) that can easily induce the inflammation response. As the adhesion time prolonged, the submicron COD gradually gathered into micron-level crystals ( and ), thereby reducing their cell damage effects.
Change in zeta potential on the cell surface during adhesion of COD microcrystals
Zeta potential is a key parameter for cell–cell and cell–external particle interactions. The degree of interaction between cells and external particles can be determined through zeta potential measurement.Citation29,Citation30 However, only a few studies investigated the interaction between cells and CaOxa using zeta potential measurement.Citation15
shows the zeta potential change in cell surface during the adhesion process of Vero cells and COD microcrystals. Before adhesion (ie, at 0 hours), the zeta potential of Vero cells in the control and injury groups was −11.6 mV and −15.2 mV (P < 0.01), respectively. This finding might be attributed to two reasons. First, the concentrations of negatively charged molecules such as phosphatidylserine, OPN, and hyaluronic acid on the cell surface increased after injury. Second, after oxidative damage, some unsaturated fatty acids on the cell membrane were oxidized to derivatives with hydroxyl and carboxyl groups, increasing the negative charge density on the cell surface. Hence, the charge of zeta potential on the injured cell surface was more negative than that in the control group.
For Vero cells of both the control and injury groups, the cell surface zeta potential showed an ascendant trend during the whole process of crystal adhesion. This finding indicated that the quantity of COD microcrystals that adhered to the cell surface is positively correlated with adhesion time. The more COD microcrystals that adhered to the cell surface, the higher the quantity of the covered negatively charged molecules (such as the OPN molecules shown in and ) and the lower the density of negative charge on the cell surface. Therefore, zeta potential would be higher.
The increase in zeta potential on Vero cells in the injury group was faster than that in the control group, especially at 0–6 hours. This finding indicated the faster binding speed between COD and injured Vero cells and the larger adhered quantity of COD microcrystals on injured Vero cells. Particularly, during the first 6 hours of adhesion, the adhered quantity of COD microcrystals on injured Vero cells was significantly higher than that on Vero cells in the control group, which was consistent with the results of SEM observation ( and ).
SEM observation of Vero–COD adhesion
The adhesion of COD microcrystals on Vero cells of both the control and injury groups was observed via SEM. The results are shown in and .
Adhesion between Vero cells in the control group and COD
At 2–6 hours, only a small amount of COD microcrystals adhered to the cell surface (). In addition, a slight change in cell shape was observed, although the spindle shape was retained. This finding indicated that the adhesion ability between COD microcrystals and Vero cells in the control group was very weak.
However, at 12 hours () and 24 hours (), the adhesion quantity of COD microcrystals significantly increased, and the cells began to shrink.
Adhesion between Vero cells in the injury group and COD
The adhesion ability between Vero cells in the injury group and COD microcrystals was obviously stronger than that in the control group. With increasing adhesion time, the adhesion quantity increased rapidly (). Particularly, at 12 hours () and 24 hours (), numerous COD microcrystals adhered to the surface of injured Vero cells.
COD crystal endocytosis by Vero cells in the control and injury groups
showed the SEM images of the COD crystals endocytosed by Vero cells in the control and injury groups after adhesion for different times. The results showed that normal Vero cells had stronger phagocytotic ability. However, the ability of the injured Vero cells to adhere microcrystals enhanced. Moreover, their ability to uptake microcrystals weakened.
Figure 7 Scanning electron microscope images (scale bar = 2 μm) of the calcium oxalate dihydrate crystals endocytosed by African green monkey kidney epithelial cells in the (A and B) control group and (C and D) injury group after adhesion at (A and C) 6 hours and (B and D) 24 hours.
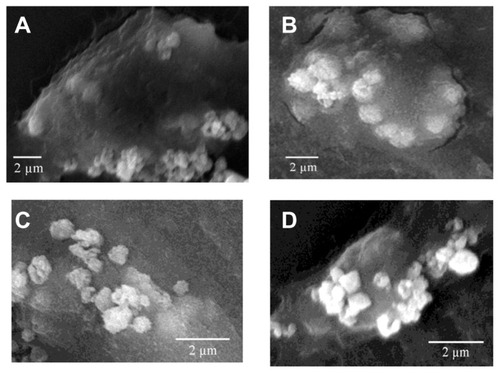
The injury of renal tubular epithelial cells could enhance the adhesion of renal tubular epithelial cells with urine microcrystals. Citation31 However, renal tubular epithelial cells did not passively accept the injury. Renal tubular epithelial cells could internalize some of the adhered crystals. Once inside a cell, the crystals would no longer be exposed to supersaturated tubular fluid or serve as a potential site for crystal aggregation, which was viewed as a separate defense against stone formation.Citation32,Citation33 Lieske et al demonstrated through SEM and TEM that after COM crystals adhered to the microvilli on the apical surface of BSC-1 cells (an epithelial cell line of African green monkey kidney origin), endocytosis occurred as early as 30 minutes after exposure of cells to crystals.Citation17 Many studies showed that cell injury could be triggered by crystal endocytosis.Citation17,Citation18,Citation34 COM crystals could be actively endocytosed individually or as aggregates by Madin–Darby canine kidney cells.Citation22 The crystals were intermingled with microvilli and cilia at the surface, and adjacent cells were structurally altered.
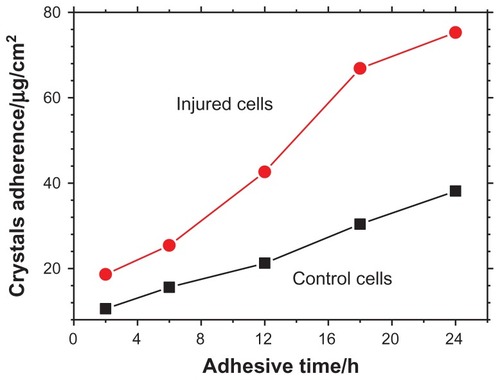
Quantitative analysis of the amount of adhered COD microcrystals
The amount of COD microcrystals that adhered to the cell surface at different adhesive time points was measured by ICP (). The microcrystal amount adhered to the injury group was significantly higher than that adhered to the control group. Especially after 12 hours, the gap further increased. Moreover, the amount of COD microcrystals adhered to the control group slowly increased with the adhesive time, while the amount of COD microcrystals adhered to the injury group rapidly increased with time.
Figure 8 The amount of calcium oxalate dihydrate microcrystals that adhered on the cell surface at different adhesive times.
Abbreviation: h, hour.
Comparison of MDA content, OPN expression, and adhered microcrystal amount on SEM images and by ICP results during the adhesion process between COD and Vero cells in the control group showed that at the early stage of adhesion (2–6 hours), the MDA content () and OPN expression () increased rapidly. By contrast, the adhesion quantity of COD on the Vero cell surface increased significantly only after 12 hours (). The reason for this result is that the cells in the control group were injured apparently after 6 hours of interaction with COD microcrystals, leading to elevated MDA content and OPN molecule expression. However, the adhesion between COD and Vero cells was a process from quantitative to qualitative change. After the cells were injured, adhesive molecules (such as OPN and phosphatidylserine) were expressed. However, these decentralized OPN and phosphatidylserine molecules on the cell surface were not easily adhered to the COD microcrystals. Only when these negatively charged molecules gather together and form a negative charge region with high density could they effectively bind COD crystals.Citation25 Meanwhile, the increase in adhesion quantity was delayed because these molecules took some time to gather together.
The expression of OPN and other negatively charged molecules was an important reason for the enhancement of the adhesion ability for injured Vero cells. The molecular chain of OPN contained an aspartic acid-rich region, called poly- Asp86-93 domain. Chien et al reported that poly-Asp86-93 domain was the center for the interaction of OPN molecule and COD crystals.Citation35 Poly-Asp86-93 peptides with high charge density were linear and unstructured in solution, and their functional side chain had no particular direction. However, poly-Asp86-93 peptides might adhere to the crystal surface with various conformations after they were adsorbed on the (110) face, a Ca2+-rich crystal plane of COD crystals. This adhesion was mainly mediated through the strong electrostatic combination between four or five carboxyls in aspartic acid and Ca2+ ions on the crystal surface. Their lattice matching degree was also very high.
In the urine of normal individuals without urolithiasis, the adhesion capacity of the cell surface to COD microcrystals was very weak because their tubular epithelial cells were not injured. However, the tubular epithelial cells of patients suffering from kidney stones were often injured. As a result, the adhesion between microcrystals and injured cells was greatly enhanced. The adhered crystals would produce further damage to tubular epithelial cells, thus increasing the risk of kidney stone formation.
Conclusion
The adhesion ability between submicron COD with a size of 150 ± 50 nm and Vero cells in the injury group was significantly stronger than that between COD and Vero cells in the control group, especially in the first 6 hours. As a result, the amount of COD microcrystals that adhered to the cell surface obviously increased, the zeta potential was elevated, and the fluorescence intensity was decreased because OPN molecules were covered by COD and dying cells could not perform properly. During the adhesion process, COD microcrystals could produce further injury to both the control and injured Vero cells. As a result, the amount of COD microcrystals that adhered to the injured epithelial cells increased, which was important in the formation of early-stage kidney stones. The results of the current study demonstrate an effective way to take intervening measures to prevent or alleviate renal tubular cell damage for the prevention of early kidney stone formation.
Acknowledgments
This work was supported by the National Natural Science Foundation of China (20971057).
Disclosure
The authors report no conflicts of interest in this work.
References
- Al-AtarUBokovAAMarshallDMechanism of calcium oxalate monohydrate kidney stones formation: layered spherulitic growthChem Mater201022413181329
- DaudonMJungersPClinical value of crystalluria and quantitative morphoconstitutional analysis of urinary calculiNephron Physiol20049823136
- RobertsonWGKidney models of calcium oxalate stone formationNephron Physiol20049822130
- TsujihataMMechanism of calcium oxalate renal stone formation and renal tubular cell injuryInt J Urol200815211512018269444
- YuSLGanXGHuangJMOxalate impairs aminophospholipid translocase activity in renal epithelial cells via oxidative stress: implications for calcium oxalate urolithiasisJ Urol201118631114112021784463
- KhaskhaliMHByerKJKhanSRThe effect of calcium on calcium oxalate monohydrate crystal-induced renal epithelial injuryUrol Res20093711619005647
- AsselmanMVerhulstADe BroeMEVerkoelenCFCalcium oxalate crystal adherence to hyaluronan-, osteopontin-, and CD44-expressing injured/regenerating tubular epithelial cells in rat kidneysJ Am Soc Nephrol200314123155316614638914
- KocakBOrugTTurhanNOzcayNGonencFCD44 expression in renal ischemia-reperfusion injury in ratsInt Urol Nephrol200941479179419283506
- BorgesFTMichelacciYMAguiarJADalboniMAGarofaloASSchorNCharacterization of glycosaminoglycans in tubular epithelial cells: calcium oxalate and oxalate ions effectsKidney Int20056841630164216164640
- GroheBO’YoungJIonescuDAControl of calcium oxalate crystal growth by face-specific adsorption of an osteopontin phosphopeptideJ Am Chem Soc200712948149461495117994739
- WangTThurgoodLAGroverPKRyallRLA comparison of the binding of urinary calcium oxalate monohydrate and dihydrate crystals to human kidney cells in urineBJU Int2010106111768177420230382
- HeJYDengSPOuyangJMMorphology, particle size distribution, aggregation, and crystal phase of nanocrystallites in the urine of healthy persons and lithogenic patientsIEEE Trans Nanobioscience20109215616320423812
- GuiBSHuangZJXuXJLiMRHeJYOuyangJMMeasurement of urine crystallites and its influencing factors by nanoparticle size analyzerJ Nanosci Nanotechnol20101085232524121125876
- KingMMcClureWFAndrewsLCPowder Diffraction File Alphabetical Index: Inorganic PhasesSwarthmore, PAInternational Centre for Diffraction Data1992
- OuyangJMYaoXQTanJWangFXRenal epithelial cell injury and its promoting role in formation of calcium oxalate monohydrateJ Biol Inorg Chem201116340541621127923
- YaoXQOuyangJMPengHZhuWYChenHQInhibition on calcium oxalate crystallization and repair on injured renal epithelial cells of degraded soybean polysaccharideCarbohydr Polym652012 [Epub ahead of print.]
- LieskeJCDeganelloSTobackFGCell–crystal interactions and kidney stone formationNephron199981Suppl 18179873209
- HackettRLShevockPNKhanSRMadin–Darby canine kidney cells are injured by exposure to oxalate and to calcium oxalate crystalsUrol Res19942241972037871629
- YuenJWGohelMDPoonNWShumDKTamPCAuDWThe initial and subsequent inflammatory events during calcium oxalate lithiasisClin Chim Acta201041115–161018102620347754
- KohjimotoYEbisunoSTamuraMOhkawaTInteractions between calcium oxalate monohydrate crystals and Madin–Darby canine kidney cells: endocytosis and cell proliferationUrol Res19962441931998873377
- PedrazaCEChienYCMcKeeMDCalcium oxalate crystals in fetal bovine serum: implications for cell culture, phagocytosis and biomineralization studies in vitroJ Cell Biochem200810351379139317879965
- HuangHSMaMCChenCFChenJLipid peroxidation and its correlations with urinary levels of oxalate, citric acid, and osteopontin in patients with renal calcium oxalate stonesUrology20036261123112814665375
- TungsangaKSriboonluePFutrakulPYachanthaCTosukhowongPRenal tubular cell damage and oxidative stress in renal stone patients and the effect of potassium citrate treatmentUrol Res2005331656915565439
- WessonJAJohnsonRJMazzaliMOsteopontin is a critical inhibitor of calcium oxalate crystal formation and retention in renal tubulesJ Am Soc Nephrol200314113914712506146
- EvanAPBledsoeSBSmithSBBushinskyDACalcium oxalate crystal localization and osteopontin immunostaining in genetic hypercalciuric stone-forming ratsKidney Int200465115416114675046
- ShinYJKimHLParkJMOverlapping distribution of osteopontin and calcium in the ischemic core of rat brain after transient focal ischemiaJ Neurotrauma20122971530153822087764
- ZhangSSuZXYaoXQPengHDengSPOuyangJMMediation of calcium oxalate crystal growth on human kidney epithelial cells with different degrees of injuryMater Sci Eng C Mater Biol Appl2012324840847
- EscobarCByerKJKhaskheliHKhanSRApatite induced renal epithelial injury: insight into the pathogenesis of kidney stonesJ Urol2008180137938718499159
- ZhangYYangMPortneyNGZeta potential: a surface electrical characteristic to probe the interaction of nanoparticles with normal and cancer human breast epithelial cellsBiomed Microdevices200810232132818165903
- LinDQZhongLNYaoSJZeta potential as a diagnostic tool to evaluate the biomass electrostatic adhesion during ion-exchange expanded bed applicationBiotechnol Bioeng200695118519116739222
- FarellGHuangEKimSYHorstkorteRLieskeJCModulation of proliferating renal epithelial cell affinity for calcium oxalate monohydrate crystalsJ Am Soc Nephrol200415123052306215579508
- LieskeJCWalsh-ReitzMMTobackFGCalcium oxalate monohydrate crystals are endocytosed by renal epithelial cells and induce proliferationAm J Physiol19922624 Pt 2F6226301566875
- LieskeJCSwiftHMartinTPattersonBTobackFGRenal epithelial cells rapidly bind and internalize calcium oxalate monohydrate crystalsProc Natl Acad Sci U S A19949115698769918041733
- EbisunoSKohjimotoYTamuraMInagakiTOhkawaTHistological observations of the adhesion and endocytosis of calcium oxalate crystals in MDCK cells and in rat and human kidneyUrol Int19975842273319253123
- ChienYCMasicaDLGrayJJNguyenSValiHMcKeeMDModulation of calcium oxalate dihydrate growth by selective crystal-face binding of phosphorylated osteopontin and polyaspartate peptide showing occlusion by sectoral (compositional) zoningJ Biol Chem200928435234912350119581305