Abstract
Drug delivery to the gastrointestinal (GI) tract is key for improving treatment of GI maladies, developing oral vaccines, and facilitating drug transport into circulation. However, delivery of formulations to the GI tract is hindered by pH changes, degradative enzymes, mucus, and peristalsis, leading to poor GI retention. Targeting may prolong residence of therapeutics in the GI tract and enhance their interaction with this tissue, improving such aspects. We evaluated nanocarrier (NC) and ligand-mediated targeting in the GI tract following gastric gavage in mice. We compared GI biodistribution, degradation, and endocytosis between control antibodies and antibodies targeting the cell surface determinant intercellular adhesion molecule 1 (ICAM-1), expressed on GI epithelium and other cell types. These antibodies were administered either as free entities or coated onto polymer NCs. Fluorescence and radioisotope tracing showed proximal accumulation, with preferential retention in the stomach, jejunum, and ileum; and minimal presence in the duodenum, cecum, and colon by 1 hour after administration. Upstream (gastric) retention was enhanced in NC formulations, with decreased downstream (jejunal) accumulation. Of the total dose delivered to the GI tract, ∼60% was susceptible to enzymatic (but not pH-mediated) degradation, verified both in vitro and in vivo. Attenuation of peristalsis by sedation increased upstream retention (stomach, duodenum, and jejunum). Conversely, alkaline NaHCO3, which enhances GI transit by decreasing mucosal viscosity, favored downstream (ileal) passage. This suggests passive transit through the GI tract, governed by mucoadhesion and peristalsis. In contrast, both free anti-ICAM and anti-ICAM NCs demonstrated significantly enhanced upstream (stomach and duodenum) retention when compared to control IgG counterparts, suggesting GI targeting. This was validated by transmission electron microscopy and energy dispersive X-ray spectroscopy, which revealed anti-ICAM NCs in vesicular compartments within duodenal epithelial cells. These results will guide future work aimed at improving intraoral delivery of targeted therapeutics for the treatment of GI pathologies.
Introduction
The gastrointestinal (GI) epithelium is a target for the treatment of GI maladies, such as ulcer, Crohn’s disease, infection, and GI cancer, where local drug activity is required.Citation1 Additionally, uptake by the GI epithelium can facilitate transport of drugs into the circulation.Citation2,Citation3 Delivery to the GI tract via oral administration is one of the best tolerated methods for clinical drug delivery, with high patient compliance.Citation4,Citation5 However, formulations for GI delivery face numerous barriers, including pH transitions, digestive enzymes, mucosal shedding, and peristalsis, hindering GI drug retention.Citation1,Citation6–Citation8 When transepithelial delivery is intended, intercellular tight junctions in the GI epithelial layer prevent access to the underlying vasculature, further limiting the bioavailability of oral drugs.Citation2,Citation3
These aspects can be improved by drug targeting strategies, eg, by ligand-specific attachment, pH-dependent disintegration, protective coatings, mucoadhesive approaches, or increased absorption for improved bioavailability.Citation1,Citation7,Citation9–Citation12 Many strategies exploit the binding of natural ligands to their receptors on GI cells (lectins, mannose, vitamin B12, thiamine, etc) or antibodies that recognize GI surface markers, which in some cases also induce uptake into cells.Citation13–Citation17
Targeting approaches can in theory be combined with the use of protective compounds for oral formulations, such as chitosan,Citation18–Citation20 controlled-release hydrogels,Citation8,Citation21,Citation22 and pH-sensitive polymers.Citation23–Citation25 Strategies to facilitate mucus penetration can be additionally used, such as incorporation of chitosan,Citation18,Citation19 polyethylene glycol,Citation12,Citation26 surfactants,Citation27,Citation28 or mucolytic agents.Citation6,Citation9,Citation29 These strategies have also been explored in conjunction with nanocarriers (NCs). NCs offer advantages for drug delivery since their properties can be controlled by engineering and/or chemical means, allowing versatility in material, size, architecture, stability, bioavailability, drug transport, release, etc.Citation30–Citation32 NCs can also be modified with affinity moieties for improved ligand-dependent targeting and have been shown to increase drug stability, targeting, and transport in the GI tract.Citation7,Citation12,Citation26,Citation33
A potential target for ligand-mediated GI delivery is intercellular adhesion molecule 1 (ICAM-1), a transmembrane glycoprotein expressed on the luminal surface of GI epithelial cells and other cell types.Citation34–Citation36 ICAM-1 is upregulated in several disease states,Citation34–Citation36 including GI disorders such as bacterial infection,Citation36 Crohn’s disease,Citation37 peptic ulcer,Citation38 and gastric cancer.Citation39 We and others have shown that, upon intravenous administration in animal models, ICAM-1 targeting improves biodistribution of diagnostic and therapeutic agents.Citation40–Citation44 Furthermore, ICAM-1-targeting NCs can be modulated to display optimal antibody surface density, size, and shape, leading to internalization into cells, which is suitable for intracellular drug transport.Citation45–Citation47 In the context of drug delivery in the GI tract, however, ICAM-1 targeting has not been explored.
As a method to improve retention in the GI tract (applicable to drug conjugates and therapeutic NCs), in this study we have explored ligand-specific targeting of free antibodies as well as antibodies coupled to the surface of polymer NCs. We have used fluorescence, radioisotope tracing, transmission electron microscopy, and energy dispersive X-ray spectroscopy to study binding, uptake, biodistribution, and degradation of nontargeting versus ICAM-targeting antibodies and antibody-coated NC formulations in the GI tract. Taken together, we have described a targeted delivery approach which may improve the efficacy of intraoral therapeutics.
Methods
Antibodies and reagents
To minimize potential interaction of antibody Fc fragments with mouse Fc receptors in the gut, all antibodies used in this study were rat IgGs. The ICAM-targeting antibody used was monoclonal rat IgG recognizing mouse ICAM-1 (anti-ICAM), clone YN.1.Citation46 Matching control antibodies were non-labeled rat IgG and fluorescein isothiocyanate (FITC)-labeled rat IgG from Jackson ImmunoResearch Laboratories, Inc (West Grove, PA). FITC-labeled 100 nm-diameter polystyrene particles were from Polysciences, Inc (Warrington, PA) and 100 nm iron oxide particles coated with goat anti-rat IgG were from Chemicell GmbH (Berlin, Germany). Phosphate-buffered saline (PBS) was from Gibco (Life Technologies, Carlsbad, CA), bovine serum albumin was from Equitech-Bio, Inc (Kerrville, TX), and NaHCO3 and trichloroacetic acid (TCA) were from Thermo Fisher Scientific (Waltham, MA). Na 125I and Pierce Iodination Beads were from PerkinElmer (Waltham, MA) and Thermo Fisher Scientific, respectively. Simulated gastric fluid (SGF) and simulated intestinal fluid (SIF) were from Cole-Parmer (Vernon Hills, IL), while the corresponding digestive enzymes pepsin and pancreatin were from Sigma-Aldrich (St Louis, MO).
Preparation of antibody-coated nanocarriers
Antibody-coated NCs were prepared as described.Citation43 Briefly, anti-ICAM or control IgG were absorbed onto the surface of 100 nm FITC-polystyrene particles by incubation in PBS. For biodistribution experiments, the formulations contained 5% 125I-labeled IgG as a radiotracer.Citation43 Antibody-coated NCs were separated from non-coated antibodies by centrifugation, and resuspended in PBS or 0.36 M NaHCO3. Bovine serum albumin (0.3%) was added to both solutions to better mimic a physiological-like fluid and to help avoid aggregation. We further prevented aggregation by sonicating the preparations at low power (note that this sonication protocol has been shown to minimally affect the NC coat).Citation43 This protocol yielded a coating density of 262 ± 4.4 antibody molecules per NC, based on 125I measurement in a Wizard2 gamma-radiation counter (PerkinElmer). The size, polydispersity, and zeta potential of the samples were measured by dynamic light scattering and electrophoretic mobility using the Zetasizer Nano (Malvern, Westborough, MA). shows the characterization of these NCs.
Table 1 Characterization of polymer NCs
Anti-ICAM iron oxide NCs were prepared by mixing anti-ICAM with 100 nm iron oxide particles pre-coated with goat anti-rat IgG, followed by magnetic separation from free anti-ICAM as indicated by the vendor. Final anti-ICAM iron oxide NCs presented a diameter of 132.6 ± 4.0 nm, polydispersity index of 0.09 ± 0.02, and 87 ± 3.4 antibody molecules per NC.
Degradation of antibodies and antibody-coated nanocarriers in vitro
Spontaneous degradation of antibody or antibody-coated NCs under conditions that mimic storage was determined by measuring release of free 125Iodine from the samples via TCA precipitation.Citation43 This was done after incubation at 4°C or 37°C for 1 hour or 3 hours in PBS (pH 7.0 or 4.1), or 0.36 M NaHCO3 (pH 8.2), as shown in . Degradation was also measured from 1 minute to 24 hours in simulated gastric fluid (SGF, pH 1.1) with or without 3.2 mg/mL pepsin, or simulated intestinal fluid (SIF, pH 6.8) with or without 10 mg/mL pancreatin, following a protocol detailed by Fu et al.Citation48 To complete this study, the size, polydispersity, and zeta potential of NCs in PBS, SGF, or SIF were also measured ().
Table 2 % degradation of IgG and IgG NCs in vitro
Biodistribution and degradation of antibodies and antibody-nanocarriers in vivo
C57BL/6 wild type mice (Jackson Laboratory, Bar Harbor, ME) were fasted for 2–4 hours and then injected intraperitoneally with anesthetic (100 mg ketamine/10 mg xylazine/kg body weight) or PBS. Mice (≥3 per group) were orally gavaged with PBS or 0.36 M NaHCO3 containing 125I-IgG or 125I-anti-ICAM (1.1 mg/kg) to track antibody biodistribution. To track antibody-coated NCs, 125I-IgG NCs or 125I-anti-ICAM NCs were used (1.1 mg antibody/kg, 1.5 × 10¹³ NCs/kg). After oral gavage the stomach, duodenum, jejunum, ileum, cecum, and colon were extracted from the animal and their 125Iodine content was measured in a gamma-radiation counter (Wizard2; PerkinElmer) to determine the percentage of injected dose (% ID) in each GI compartment. Degradation of antibodies or antibody-coated NCs in homogenized GI sections was assessed using the TCA precipitation method described above. Studies were performed in accordance with IACUC and University of Maryland regulations.
Visualization of antibodies and antibody-coated nanocarriers and energy dispersive X-ray spectroscopy (EDS) analysis
To visualize passage through the GI tract, mice were gavaged with FITC-labeled IgG (33.3 mg/kg) or FITC-labeled IgG NCs (6.67 mg IgG/kg, 9.0 × 10¹³ NC/kg) in 0.36 M NaHCO3 buffer. The GI tract was isolated 5 minutes or 30 minutes after administration and imaged on a Bi-O-Vision TVD1000R UV transilluminator (Spectroline; Spectronics Corporation, Westbury, NY). To visualize binding of anti-ICAM NCs to GI tissue, mice were gavaged with FITC-labeled anti-ICAM NCs (6.67 mg IgG/kg, 9.0 × 10¹³ NC/kg) in PBS and sacrificed after 15 minutes. Cross-sectional GI tissue fragments were excised throughout the GI tract and rinsed vigorously in PBS and 70% EtOH to remove nonattached NCs. Tissue sections were fixed in 4% paraformaldehyde and imaged with a Nikon IX81 microscope (Nikon Inc., Melville, NY) to detect tissue-bound FITC-NCs.
To improve visualization by transmission electron microscopy (TEM), mice were gavaged with anti-ICAM iron oxide NCs instead of polystyrene counterparts, as iron oxide is electron dense. GI tissue fragments were fixed in 2.5% glutaraldehyde in Millonig’s buffer, embedded and sectioned from Spurr’s resin blocks, stained with 2% uranyl acetate and 0.3% lead citrate, and placed onto copper grids at the University of Maryland Laboratory for Biological Ultrastructure (College Park, MD).Citation43 Additionally, antibody-coated iron oxide NCs were placed directly onto microscope grids for NC characterization. Imaging was performed at the Laboratory for Biological Ultrastructure on a Zeiss EM 10 CA instrument (Zeiss, Oberkochen, Germany). After carbon-coating the grids, imaging spectroscopy and EDS were conducted using INCAEnergy software (Oxford Instruments, Oxfordshire, UK) at the University of Maryland Nanoscale Imaging, Spectroscopy, and Properties Lab on a JEOL JEM-2100F instrument (JEOL, Tokyo, Japan). For EDS analysis, the indicated regions were queried for iron, oxygen, carbon, and calcium content.
Statistics
Data were calculated as mean ± standard error of the mean (SEM). Statistical significance was determined by Student’s unpaired t-test. For in vitro degradation assays, the regression curves, half-life of enzymatic degradation (t½), 24-hour degradation maximum (D24 hr), and coefficient of determination (R2) were derived from Ligand Binding analysis in SigmaPlot 11.0 (Systat Software, Inc, San Jose, CA).
Results
Biodistribution and degradation of IgG in the GI tract
Both antibodies and NC particles displaying antibodies against specific cell surface determinants are commonly used to improve drug bioadhesion to tissues requiring therapeutic intervention or to those involved in transport across cellular barriers in the body. Although this strategy is expected to encounter obstacles in the GI tract (eg, degradation, poor diffusion, etc), antibodies have been shown to overcome these obstacles to some extent.Citation49,Citation50
We first visualized passage of fluorescently-labeled control rat IgG through the GI tract by UV transillumination after oral gavage in mice (Figure S1). In contrast to the saline vehicle control, fluorescent IgG was initially visible in more proximal GI regions, transitioning to a less intense signal with a more distal distribution over time. The cecum and colon, however, showed no fluorescence above background levels (data not shown). Radiotracing studies confirmed this distribution. For instance, GI transit of 125I-IgG 1 hour after oral gavage in mice () showed that, when administered in neutral buffer (PBS), 125I-IgG was mostly retained in the stomach (18.7% ± 2.1% injected dose, “% ID”), with significant fractions found in the jejunum (8.3% ± 2.9% ID) and ileum (12.3% ± 3.9% ID), a small fraction located in the duodenum (1.1% ± 0.3% ID), and negligible amounts in the cecum and colon (0.4 ± 0.04 and 0.3% ± 0.04% ID). As a control, mice gavaged with 125I-IgG under anesthesia to reduce peristalsis (Figure S2A), showed increased retention in more proximal GI regions, including the stomach, duodenum, and jejunum (1.8-, 3.9-, and 2.5-fold increase, respectively).
Figure 1 Biodistribution and degradation of IgG in the GI tract. Mice were orally gavaged with 125I-IgG in either PBS or NaHCO3. One hour later, the indicated sections of the GI were harvested and measured for their 125I-content, expressed as % ID (A). Alternatively, samples were subjected to TCA precipitation to determine the percentage of free 125Iodine, reflective of antibody degradation (B).
Notes: Data are mean ± SEM (n ≥ 3). *P < 0.05 between saline and NaHCO3 groups.
Abbreviations: PBS, phosphate-buffered saline; GI, gastrointestinal; TCA, trichloroacetic acid; % ID, percentage of the total injected dose; SEM, standard error of the mean.
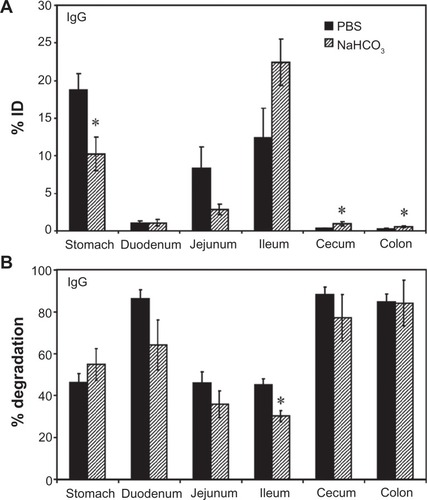
Importantly, TCA precipitation () revealed that a substantial fraction of 125I-IgG in the stomach, jejunum, and ileum remained undegraded in vivo by 1 hour (53.7% ± 4.2%, 53.9% ± 5.3%, and 54.8% ± 2.9%, respectively). The majority of the signal obtained from the duodenum, cecum, and colon corresponded to highly degraded 125Iodine (86.4% ± 4.1%, 88.2% ± 3.7%, and 84.9% ± 3.7%, respectively). Compared with PBS, oral gavage in alkaline NaHCO3 buffer (pH 8.2) did not significantly affect the degradation pattern of 125I-IgG (), despite reducing retention in the stomach (1.8-fold reduction) in favor of transit to the ileum (1.8-fold increase; ). Stomach degradation of 125I-IgG was unaffected in sedated mice, despite the fact that retention in this compartment is significantly favored in sedated animals (Figure S2). Altogether, these data indicate the presence of nondegraded antibody in relatively proximal GI regions (stomach, jejunum, ileum), while distal GI regions (cecum and colon) accumulate only degraded antibody products. Degradation was most apparent in the duodenum despite the use of alkaline buffer, and therefore is likely due to enzymatic action rather than acidity per se.
Enzyme- and pH-dependent degradation of IgG in vitro
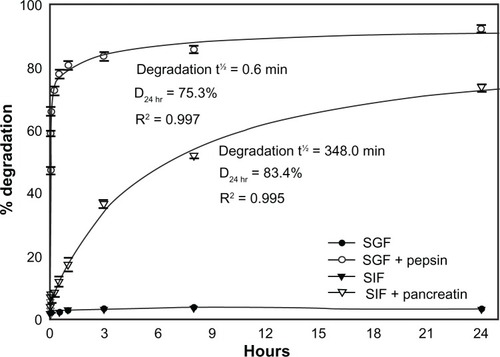
To explore the aforementioned hypothesis regarding degradation, we assessed the stability of 125I-IgG in vitro. As shown in , 125I-IgG was highly resistant (<3% degradation) to changes in temperature (4°C versus 37°C) and pH (acidic pH 4, neutral pH 7, or basic pH 8.2) up to 3 hours, suggesting that degradation depends on other factors such as digestive enzymes. Confirming this (), 125I-IgG underwent minimal degradation (<4%) when incubated for 24 hours at 37°C in simulated gastric fluid (SGF; pH 1.1) or intestinal fluid (SIF; pH 6.8) in the absence of enzymes. However, the presence of pepsin within SGF or pancreatin within SIF caused rapid and significant 125I-IgG degradation (47.2% ± 1.1% and 8.2% ± 0.6% degradation at 1 minute, respectively). Degradation was faster in the case of pepsin-containing SGF (t½ = 0.6 minutes; D24 hr = 75.3%) versus pancreatin-containing SIF (t½ = 348.0 minutes; D24 hr = 83.4%). These results support the hypothesis that degradation is largely mediated by digestive enzymes rather than pH. Also, it is likely that the large fraction of degraded 125I-IgG observed in the duodenum may arise from (a) enzymatic degradation within the duodenum itself, and (b) duodenal migration of antibody previously degraded in the stomach.
Figure 2 In vitro degradation of IgG under GI-mimicking conditions. 125I-IgG was incubated for the indicated time periods in SGF with or without pepsin, or SIF with or without pancreatin, and the percentage of 125I-IgG degradation was calculated as described in . Curves were fitted by software regression analysis.
Note: Data are mean ± SEM (n ≥ 3 per experiment and at least two independent experiments).
Abbreviations: SGF, simulated gastric fluid; SIF, simulated intestinal fluid; SEM, standard error of the mean.
Biodistribution and degradation of IgG-coated nanocarriers in the GI tract
Apart from direct coupling of drugs to targeting moieties such as antibodies, antibody-coated NCs are commonly explored for drug targeting. However, antibody-coated NCs display targeting and biodistribution patterns different from free antibodies due to differences in size and valency (which determines avidity), among other parameters.Citation45,Citation51 We therefore assessed the biodistribution of IgG-coated polymer NCs in the GI tract of mice, compared to that of free IgG. A detailed characterization of IgG NCs, compared to uncoated NCs, is provided in . Briefly, each NC presented ∼260 IgG molecules on the coat, with a final size ∼270 nm, polydispersity index ∼0.3, and zeta-potential ∼−7 mV in PBS. These particles showed spherical morphology when visualized by electron microscopy (data not shown), as described previously.Citation43,Citation45
Imaging of mice gavaged with fluorescently-labeled IgG NCs revealed an early accumulation in proximal GI compartments (similar to free IgG), progressing to more distal accumulation over time (Figure S1). As with free IgG, no fluorescence was detected within the cecum or colon (data not shown). Examination of mouse GI sections isolated 1 hour after oral gavage with 125I-labeled IgG NCs () showed that gastric retention was significantly greater for 125I-IgG NCs compared to 125I-IgG (1.7-fold enhancement). The opposite effect was found in the case of the jejunum (3.6-fold reduction). Both 125I-IgG and 125I-IgG NCs formulations led to similar accumulation in the duodenum (1.08% ± 0.27% ID and 0.98% ± 0.2% ID, respectively) and ileum (12.3% ± 3.94% ID and 11.7% ± 0.65% ID, respectively). Neither formulation migrated substantially to the cecum or colon (<1% ID).
Figure 3 Biodistribution and degradation of IgG nanocarriers in the GI tract. Mice were gavaged with 125I-IgG-coated model polymer NCs (IgG NCs) in PBS, final diameter 269.8 ± 6.3 nm, and compared to their 125I-IgG counterparts. One hour later, the indicated sections of the GI tract were harvested and measured for their 125I-content, expressed as % ID (A). Samples were also subjected to TCA precipitation to determine the percentage of free 125Iodine, reflective of degradation (B).
Notes: Data are mean ± SEM (n ≥ 3). *P < 0.05 between IgG and IgG NC groups.
Abbreviations: GI, gastrointestinal; NC, nanocarrier; PBS, phosphate-buffered saline; % ID, percentage of the total injected dose; TCA, trichloroacetic acid; SEM, standard error of the mean.
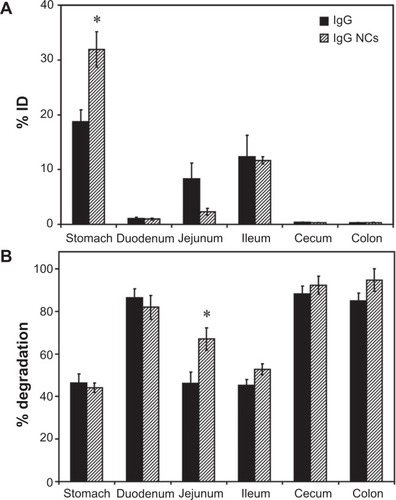
The pattern of degradation of the antibody coat of 125I-IgG NCs () closely resembled that of free 125I-IgG, with ≥80% degradation found in the duodenum, cecum and colon, and ∼40%–50% stability found in the stomach and ileum. While the fraction of 125I-IgG NCs found in the jejunum was reduced as compared to free 125I-IgG (), IgG NCs showed a higher percentage of degradation (1.5-fold increase; ). Counterintuitively, then, 125I-IgG coated on NCs appears to be more susceptible to degradation than its free 125I-IgG counterpart. As in the case of 125I-IgG, degradation of 125I-IgG NCs may be predominantly enzymatic, considering that administration in NaHCO3 did not affect the degradation pattern of 125I-IgG NCs (except for the stomach, where degradation actually increased 1.5-fold; Figure S3B). However, NaHCO3 did promote distal migration of 125I-IgG NCs similarly to the effect on 125I-IgG seen in , resulting in lower gastric retention (2.3-fold reduction) and enhanced ileal accumulation (1.8-fold enhancement) (Figure S3A).
Enzyme- and pH-dependent degradation of IgG nanocarriers in vitro
As with free 125I-IgG described above, we examined the stability of 125I-IgG NCs in vitro. First, we determined how SGF (pH 1.1) and SIF (pH 6.8) affected the size, polydispersity, and zeta potential of these NCs. As shown in , incubation in SGF shifted the zeta-potential of IgG NCs and uncoated NCs to more positive values, and the opposite effect was found under incubation with SIF, in agreement with the pH of these solutions. Interestingly, in the case of IgG NCs incubated with SGF (but not SIF) a large increase in the NC size was found, which may be due to protonation of the IgG coating and/or partial antibody denaturation at acidic pH with aggregation. The polydispersity index also decreased in SGF, indicating that this effect was uniform through the NC population. The NC size of control uncoated NCs was not altered by SGF or SIF, confirming that the IgG NC size increase in SGF was due to changes in the antibody coating.
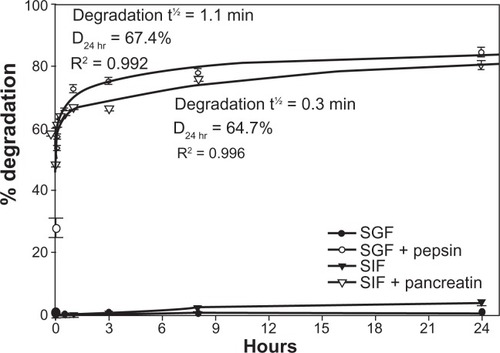
In addition, neither pH nor temperature caused significant degradation of the antibody coat of 125I-IgG NCs (<3% degradation, ). A similar lack of degradation (<3.8% ± 1.0%; ) was observed even after incubation for 24 hours at 37°C in SGF at pH 1.1 or SIF at pH 6.8. However, the presence of pepsin within SGF or pancreatin within SIF resulted in rapid degradation of 125I-IgG on the NC coat, with t½ of 1.1 minutes and 0.3 minutes, respectively. Degradation by either pepsin or pancreatin reached a plateau between 1 and 3 hours, with D24 hr of 67.4% and 64.7%, respectively. Hence, as in the case of free 125I-IgG, 125I-IgG on the NC coat is also susceptible to enzymatic, but not pH-dependent degradation. Furthermore, 125I-IgG NCs seem more susceptible to intestinal degradation than 125I-IgG ( and ). This supports our previous observation showing greater degradation of 125I-IgG NCs than 125I-IgG in the jejunum in vivo ().
Figure 4 In vitro degradation of IgG nanocarriers under GI-mimicking conditions. 125I-IgG NCs were incubated for the indicated time periods in SGF ± pepsin or SIF ± pancreatin, followed by TCA precipitation to determine the percentage of free 125Iodine, reflective of degradation, as described in . Curves were fitted by software regression analysis.
Note: Data are mean ± SEM (n ≥ 3 per experiment and at least two independent experiments).
Abbreviations: GI, gastrointestinal; NC, nanocarrier; SGF, simulated gastric fluid; SIF, simulated intestinal fluid; TCA, trichloroacetic acid; SEM, standard error of the mean.
ICAM-1 targeting in the GI tract
Rat IgG represents a nonspecific control expected to bind with minimal, if any, affinity for mouse GI surface determinants, and also provides an isotype control for nonspecific cross-reactivity to murine Fc-receptors. The results obtained regarding biodistribution of IgG or IgG NCs therefore reflect passive GI transit. However, our findings also show some retention in proximal GI regions. We next determined whether GI targeting by specific antibodies could further modify this proximal retention. To test this, we examined GI biodistribution of anti-ICAM and anti-ICAM NCs, since ICAM-1 is expressed on the luminal surface of GI epithelial cells.Citation35,Citation36
Our previous experiments using non-specific counterparts showed no accumulation of antibodies or antibody-coated NCs in the cecum and colon (<1% ID and ≥96.7% degradation; ). Hence, we decided to group GI compartments as stomach, duodenum, and the remainder of intestinal sections (“distal”) for simplicity. As shown in , oral gavage with anti-ICAM resulted in a significantly greater retention compared to nonspecific IgG in the stomach (1.6-fold increase) and the duodenum (2.9-fold increase), while distal accumulation was consequently decreased (1.9-fold decrease).
Figure 5 Biodistribution of anti-ICAM and anti-ICAM nanocarriers in the GI tract. Mice were gavaged with PBS containing 125I-anti-ICAM vs 125I-IgG (A) or 125I-anti-ICAM NCs vs 125I-IgG NCs (B), and 125Iodine biodistribution in the stomach, duodenum, and distal GI regions (encompassing jejunum, ileum, cecum, and colon) was assessed one hour later as described in . A comparison of the biodistribution of 125I-anti-ICAM vs 125I-anti-ICAM NCs is shown in (C).
Notes: Results are expressed as % ID. Data are mean ± SEM, (n ≥ 3). (A) and (B) *P < 0.05; **P < 0.005 between nontargeting IgG and ICAM-targeting groups. (C) *P < 0.05 between anti-ICAM free antibody and anti-ICAM NCs.
Abbreviations: ICAM, intercellular adhesion molecule; GI, gastrointestinal; PBS, phosphate-buffered saline; NC, nanocarrier; % ID, percentage of the total injected dose; SEM, standard error of the mean.
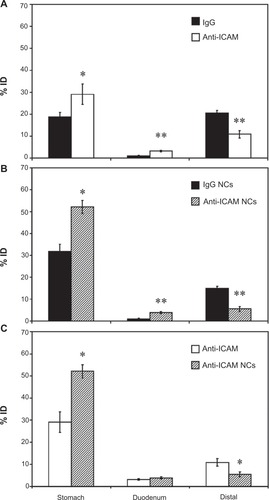
We next compared the biodistribution of anti-ICAM NCs against that of IgG NCs (). Anti-ICAM NCs also showed enhanced retention in the stomach (1.6-fold increase) and duodenum (3.9-fold increase), resulting in reduced accumulation in distal compartments (2.8-fold decrease). When compared to free anti-ICAM (), anti-ICAM NCs displayed a 1.8-fold increase in gastric retention and a 2.0-fold decrease in distal distribution, with no apparent changes in the accumulation in the duodenum.
These results are consistent with both a size- and valency-dependent distribution pattern, where larger NCs (which also present more ICAM-1 binding motifs) may move more slowly through the GI tract. Indeed, gastric accumulation of anti-ICAM NCs held steady between 30 minutes (49.6% ± 4.2% ID) and 1 hour (52.1% ± 3.0% ID), then dropped by 3 hours after oral gavage (5.7% ± 0.7% ID; Figure S4A). Duodenal accumulation also decreased over time (9.0% ± 1.5% ID at 30 minutes versus 1.4% ± 0.2% ID at 3 hours) while distal accumulation increased (1.4% ± 0.2% ID at 30 minutes versus 8.0% ± 0.5% ID at 3 hours). Biodistribution was also shifted toward distal compartments by oral gavage of anti-ICAM NCs in NaHCO3 versus PBS (Figure S4B): NaHCO3 reduced stomach retention 3.5-fold and increased distal accumulation 11.1-fold.
Visualization of anti-ICAM nanocarriers in GI tissue
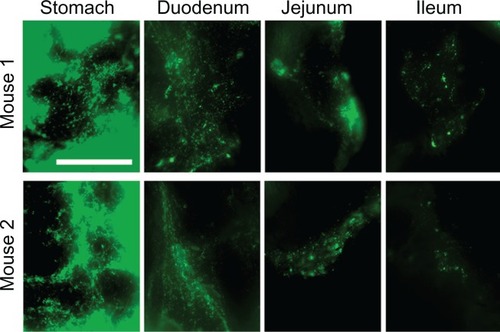
Enhanced proximal (gastric + duodenal) retention of anti-ICAM and anti-ICAM NCs, compared to nonspecific controls, suggests binding to ICAM-1 on the surface of GI tissue. To demonstrate binding to ICAM-1, we collected cross-sectional tissue fragments from various GI compartments 15 minutes after oral gavage with fluorescent anti-ICAM NCs, and thoroughly washed away unbound NCs. Microscopic analysis () showed that fluorescence intensity was greatest in the stomach and tapered off distally, supporting the proximal retention described for radiolabeled anti-ICAM NCs ().
Figure 6 Visualization of anti-ICAM nanocarriers bound to GI tissue. Mice were gavaged with FITC-labeled anti-ICAM NCs in PBS, then euthanized after 15 minutes. Cross-sectional dissections were made in the stomach, duodenum, jejunum, and ileum.
Notes: Dissected tissue was thoroughly rinsed to remove unbound NCs and imaged by microscopy to detect tissue-associated fluorescent NCs. Scale bar = 500 μm.
Abbreviations: ICAM, intercellular adhesion molecule; GI, gastrointestinal; NC, nanocarrier; PBS, phosphate-buffered saline.
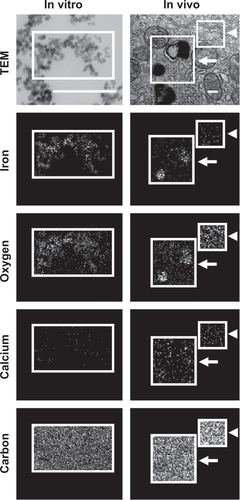
To examine attachment of anti-ICAM NCs to GI epithelial tissue and potential internalization within cells, we used anti-ICAM-coated iron oxide NCs to facilitate visualization by TEM and EDS. Although the outer silica shell of the iron oxide NCs was not visible by TEM, we detected the inner iron oxide core of these NCs which corresponds to electron-dense spheres of ∼20 nm in diameter (Figure S5, left column). EDS analysis verified the presence of iron and oxygen (elemental components of iron oxide NCs) colocalizing with electron-dense particles visualized by TEM, while neither calcium (negative control) nor carbon (used as a protective coating on the grid) showed specific colocalization with NCs, validating this method of NC detection.
Similarly, in duodenal specimens obtained from mice gavaged with anti-ICAM iron oxide NCs, electron-dense regions were found within vesicular compartments in GI epithelial cells (arrows in ). These compartments colocalized with iron (arrows in ) and oxygen signatures (arrow in Figure S5, right column), indicating endocytosis of anti-ICAM NCs by GI epithelial cells. The specificity of iron and oxygen signatures was in contrast to calcium and carbon signatures, which did not co-localize with intracellular vesicles (arrows in Figure S5, right column).
Figure 7 Visualization of epithelial endocytosis of anti-ICAM nanocarriers into GI tissue. Mice were gavaged with saline (A–C) or anti-ICAM-coated iron oxide nanoparticles suspended in NaHCO3 (D–I).
Notes: GI tissue was isolated after 10 minutes, processed, and imaged by TEM and iron EDS. In each row, a lower-magnification TEM image of the duodenum (left) is followed by a higher-magnification TEM image (middle) and its corresponding EDS analysis (right). White boxes indicate regions of EDS analysis. Arrows indicate electron-dense vesicular structures while arrowheads indicate non-vesicular structures. Scale bar = 500 nm.
Abbreviations: mv, microvilli; ec, enterocyte; ICAM, intercellular adhesion molecule; GI, gastrointestinal; TEM, transmission electron microscope; EDS, energy dispersive X-ray spectroscopy.
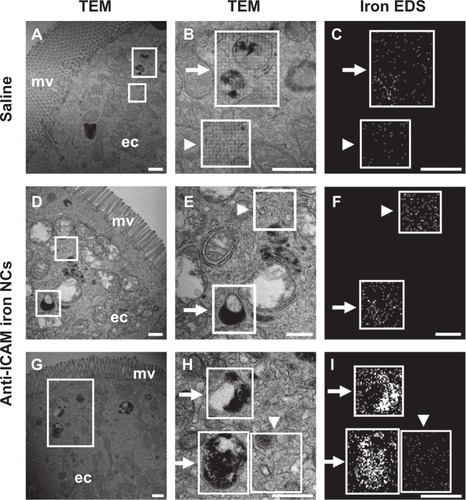
As expected, electron-dense, iron positive compartments were not detected in control mice orally gavaged with saline (upper panels in ). In both control mice and anti-ICAM NC-treated mice, non-vesicular regions lacked both electron-dense patterns (arrowheads in ) and iron EDS signatures (arrowheads in ). Also, these control regions presented non-specific distribution of oxygen, calcium, and carbon (arrowheads in Figure S5, right). In contrast to , both control mice and anti-ICAM NC-treated mice also presented electron-dense vesicular compartments (arrows in ) voided of iron signatures (arrows in ). These compartments likely correspond to lysosomes. Taken together, these results demonstrate uptake of anti-ICAM NCs by epithelial cells in the GI tissue after oral gavage in mice.
Discussion
Targeting strategies may involve the coupling of therapeutic compounds to affinity moieties or loading into NCs that display targeting moieties on their surface. Such strategies are increasingly explored in GI drug delivery for pathologies affecting GI tissue, as well as to improve absorption of orally-delivered drugs into the circulation.Citation1,Citation2,Citation33,Citation52 We have examined the biodistribution, stability, binding, and uptake of orally administered antibodies, delivered as either free entities or coated onto the surface of NCs. We have also compared nontargeting antibodies to antibodies targeting the cell surface determinant ICAM-1. ICAM-1 was selected based on: (a) its presence on GI epithelial cellsCitation35,Citation36 and over-expression under GI pathology;Citation36–Citation39 (b) its ability to mediate binding and endocytosis of drug conjugates and carriers;Citation46 and (c) prior literature on ICAM-1-targeting in cell culture and in vivo.Citation41–Citation44,Citation47 We utilized model polystyrene NCs since: (a) polymer-based carriers are stable in the GI environment compared to other formulations;Citation7,Citation33 (b) anti-ICAM coated polystyrene NCs display similar targeting and uptake as biocompatible, translationally relevant poly(lactic-co-glycolic acid) NCs;Citation51 and (c) the transit and kinetics of polystyrene particles in mucosal environments has been described.Citation26,Citation53,Citation54
After gastric gavage, free antibodies and their NCs counterparts were detected preferentially in the stomach, the jejunum, and the ileum, compared to the duodenum and distal areas of the GI tract. Downstream transit was time-dependent, and inhibiting peristalsis by sedationCitation55 increased proximal retention of antibodies, while decreasing mucosal viscosityCitation56 with NaHCO3 enhanced distal passage. Hence, the distribution of both nonspecific and ICAM-1-targeting formulations seems substantially controlled by passive transit through the GI tract.Citation6,Citation9 This result was expected due to the presence of the mucus lining.Citation6,Citation9 This layer extends between 10 μm (ileum) and >150 μm (stomach) above the epithelial tissue, with a relatively “unstirred” coating above the cell surface and a luminal “sloppy” layer that is cleared by peristalsis every 4–6 hours.Citation6,Citation9 This represents a considerable barrier for drug delivery and uptake.Citation6,Citation9 Many compounds, pathogens and other objects are mechanically entrapped in the mucus mesh and also associate with it via hydrogen bonding, van der Waals forces, and hydrophobic or electrostatic interactions.Citation6,Citation9 This has been reported for “naked” polystyrene and other nano-particles, which adhere to mucin fibers, penetrate minimally across the mucus mesh, and are cleared by fecal elimination.Citation6,Citation9 The use of lectins for epithelial binding is also suboptimal due to strong association with mucus.Citation57
However, both free anti-ICAM and anti-ICAM NCs showed significant additional retention in proximal regions of the GI tract and reduced transit to distal regions when compared to control IgG counterparts, particularly in the stomach and duodenum. This indicates that targeting to GI tissue is feasible, which can potentially be translated into clinical applications, eg, by using humanized antibodies, their fragments, or other affinity moieties. Such targeting may be in part explained by the length of the extracellular domain of ICAM-1, as compared to that of other determinants on the GI surface. This parameter is important because it impacts accessibility, particularly in the case of bulky drug delivery systems versus small soluble ligands. For instance, coupling of particles to cholera toxin B in order to target ganglioside GM1 on the cell surface induced efficient GI binding only in the case of 6 nm diameter particles.Citation58 However, binding was reduced for 30 nm particles and totally eliminated for 1 μm particles, despite the greater avidity of the larger counterparts.Citation58 This was due to steric hindrance leading to limited accessibility to GM1, as this determinant protrudes only 2.5 nm from the cell membrane.Citation9,Citation58 In comparison, ICAM-1 extends ∼18 nm from the membrane.Citation59
Mucus penetration of antibodies and antibody-coated NCs may be due to their surface properties. For instance, IgG and IgA antibodies display minimal hindrance to diffusion in mucus due to the high density of charged residues on these molecules (despite a neutral net charge).Citation49 Also, pentameric IgM antibodies diffuse well through mucus despite their relatively large size.Citation50 Clinically, immunoglobulins have been administered orally to treat viral gastroenteritis; these antibodies survive in the GI tract and induce functional immunization.Citation60 The same surface property is exploited by certain pathogens in order to avoid mucoadhesive entrapment and improve penetration toward the epithelial lining.Citation6,Citation9 It appears that anti-ICAM NCs can similarly bypass mucus and access the GI epithelial surface, confirmed by TEM visualization of anti-ICAM NCs internalized into epithelial cells. It is possible that targeting can be further improved by facilitating penetration through low viscosity pores within mucus using materials such as chitosan,Citation18,Citation19 polyethylene glycol,Citation12,Citation26 surfactants,Citation27,Citation28 or mucolytic agents.Citation6,Citation9,Citation29 These strategies have been shown to allow significant penetration of polystyrene and poly(lactic-co-glycolic acid) particles up to 500 nm in size.Citation26
ICAM-1 targeting and uptake in GI tissue is also in accord with our recent study showing efficient binding and endocytosis of anti-ICAM NCs in Caco-2 cells, which derive from human intestinal tissue.Citation61 Our results indicate that ICAM-1 targeting may help facilitate GI retention and delivery of drugs aimed at GI maladies such as peptic ulcer, GI cancer, bacterial infection, and others.Citation36–Citation39 Whether these ICAM-1 targeting formulations also enter M cells in the GI tract needs to be determined. This has been demonstrated for other polymer formulations (including “naked” polystyrene particles), which may be relevant in improving efficacy of oral immunization over that of soluble antigens.Citation62
A critical consideration for drugs delivered to the GI tract is stability. In this study we focused on degradation of antibodies, and we therefore relied on nondegradable polystyrene particles. The pattern of degradation observed and lack of dependence on pH suggest that this primarily occurs in the stomach and small intestines, mainly mediated by enzymes. In addition, we observed an increase in size in the case of antibody-coated NCs incubated in acidic SGF (but not in nearly-neutral SIF), which may indicate either protonation of the IgG coating and/or partial denaturation at acidic pH with aggregation. Hence, our future studies will incorporate biocompatible materials to improve stability in the GI tract while potentially improving permeation and absorption, eg, chitosan, controlled-release hydrogels, enteric capsules employed as pH-sensitive formulations, muco/bioadhesive conjugates, permeability enhancers, or protein delivery vehicles.Citation8,Citation9,Citation12,Citation18,Citation23,Citation24,Citation26–Citation28
In conclusion, this work underscores the feasibility of antibody-coated NC strategies to target GI surface determinants and internalize within GI tissue via ICAM-1, which may find utility in delivery of therapeutic agents for the treatment of pathologies of the GI tract.
Acknowledgements
We thank the University of Maryland Laboratory for Biological Ultrastructure and the Nanoscale Imaging, Spectroscopy, and Properties Lab of the Maryland NanoCenter, in part supported by the NSF as a MRSEC Shared Experimental Facility. We also thank Dr Tridib Bhowmick (IBBR, University of Maryland) for determining the antibody-surface coating ratio of magnetic nanoparticles. This work was funded by the National Institutes of Health grant R01-HL98416 and the American Heart Association grant 09BGIA2450014 (SM).
Disclosure
The authors report no conflicts of interest in this work.
Supplementary figures
Figure S1 Visualization of antibody and antibody-coated nanocarriers in the GI tract. Mice were gavaged with saline, FITC-labeled IgG, or IgG-coated NCs and sacrificed 5 minutes or 30 minutes later. Their GI tracts were then excised and illuminated by UV light.
Notes: Stomach and small intestines (duodenum, jejunum, and ileum) are shown. Scale bar = 1 cm.
Abbreviations: GI, gastrointestinal; NC, nanocarrier.
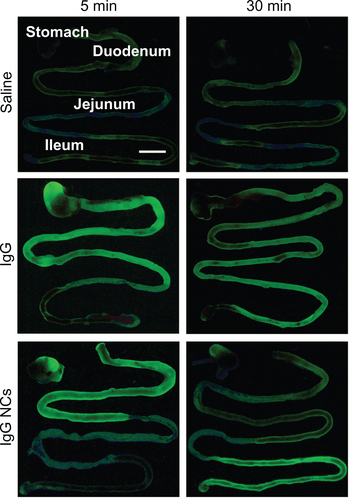
Figure S2 Effect of sedation on the GI biodistribution and degradation of 125I-IgG. Mice were injected intraperitoneally with PBS (nonsedated) or ketamine/xylazine (sedated), then orally gavaged with 125I-IgG in PBS. One hour later, sections of the GI were harvested and measured for their 125I-content, expressed as % ID (A). Samples were also subjected to TCA precipitation to determine the percentage of free 125Iodine, reflective of antibody degradation (B).
Notes: Data are mean ± SEM, (n ≥ 3). *P < 0.05; **P < 0.005 between sedated and nonsedated groups.
Abbreviations: GI, gastrointestinal; PBS, phosphate-buffered saline; % ID, percentage of the total injected dose; TCA, trichloroacetic acid; SEM, standard error of the mean.
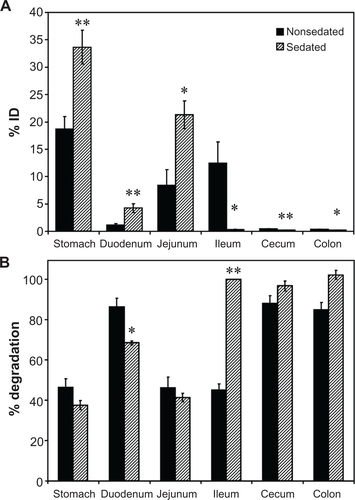
Figure S3 Effect of buffer composition on the GI biodistribution of IgG NC. Mice were gavaged with 125I-IgG NCs in either PBS or NaHCO3. One hour later, GI sections were harvested and measured for 125I-content, expressed as % ID (A). Samples were also subjected to TCA precipitation to determine the percentage of free 125Iodine, reflective of antibody degradation (B).
Notes: Data are mean ± SEM, (n ≥ 3). *P < 0.05; **P < 0.005 between saline and NaHCO3 groups.
Abbreviations: GI, gastrointestinal; NC, nanocarrier; PBS, phosphate-buffered saline; % ID, percentage of the total injected dose; TCA, trichloroacetic acid; SEM, standard error of the mean.
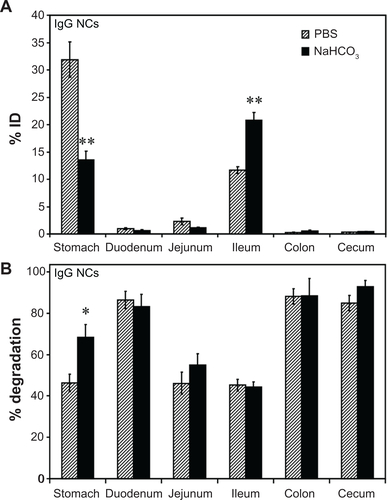
Figure S4 Biodistribution of anti-ICAM nanocarriers in the GI tract. Mice were gavaged with 125I-anti-ICAM NCs in PBS and euthanized after 30 minutes, 1 hour, or 3 hours, followed by determination of the 125I-content in the stomach, duodenum, and distal intestines (encompassing the jejunum, ileum, cecum, and colon), to determine the % ID (A). Mice were gavaged with 125I-anti-ICAM NCs in either PBS or NaHCO3 and euthanized after 30 minutes to determine their GI biodistribution (% ID) as described above (B).
Notes: Data are mean ± SEM, (n ≥ 3). (A) *P < 0.05; **P < 0.005 between 30 minutes and 1 hour or between 30 minutes and 3 hours. (B) **P < 0.005 between saline and NaHCO3 groups.
Abbreviations: ICAM, intercellular adhesion molecule; GI, gastrointestinal; NC, nanocarrier; PBS, phosphate-buffered saline; % ID, percentage of the total injected dose; SEM, standard error of the mean.
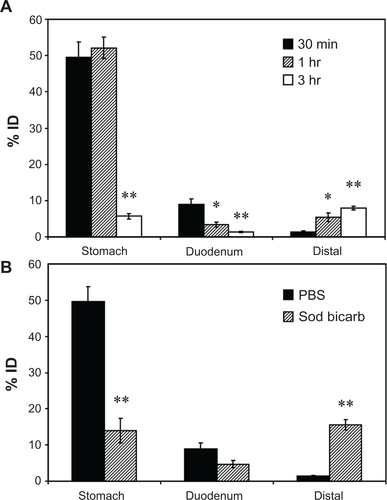
Figure S5 Visualization of anti-ICAM NCs by TEM and EDS. Antibody-coated iron oxide nanoparticles were directly coated onto microscope grids (in vitro, left column), or orally gavaged in mice followed by isolation 10 minutes later and processing of GI duodenal tissue sections (in vivo, right column).
Notes: Samples were imaged by TEM (upper row) and analyzed by EDS to detect iron, oxygen, calcium, and carbon signatures. White boxes indicate the region of analysis. White arrows indicate electron-dense vesicular compartments within GI epithelial cells, while white arrowheads represent non-vesicular compartments. Scale bar = 200 nm.
Abbreviations: ICAM, intercellular adhesion molecule; TEM, transmission electron microscope; EDS, energy dispersive X-ray spectroscopy; GI, gastrointestinal.
References
- ParkKKwonICParkKOral protein delivery: current status and future prospectReact Funct Polym2011713280287
- MrsnyRJModification of epithelial tight junction integrity to enhance transmucosal absorptionCrit Rev Ther Drug Carrier Syst200522433141815952935
- TumaPLHubbardALTranscytosis: crossing cellular barriersPhysiol Rev200383387193212843411
- SastrySVNyshadhamJRFixJARecent technological advances in oral drug delivery – a reviewPharm Sci Technolo Today20003413814510754543
- BenderBGSazonovVKrobotKJImpact of medication delivery method on patient adherenceHarverAKotsesHAsthma, Health and SocietyNew YorkSpringer US2010107115
- LaiSKWangYYHanesJMucus-penetrating nanoparticles for drug and gene delivery to mucosal tissuesAdv Drug Deliv Rev200961215817119133304
- PlapiedLDuhemNDes RieuxAPréatVFate of polymeric nanocarriers for oral drug deliveryCurr Opin Colloid Interface Sci2011163228237
- SerraLDoménechJPeppasNAEngineering design and molecular dynamics of mucoadhesive drug delivery systems as targeting agentsEur J Pharm Biopharm200971351952818976706
- ConeRABarrier properties of mucusAdv Drug Deliv Rev2009612758519135107
- van HoogevestPLiuXFahrADrug delivery strategies for poorly water-soluble drugs: the industrial perspectiveExpert Opin Drug Deliv20118111481150021895540
- VinogradovSVBronichTKKabanovAVNanosized cationic hydrogels for drug delivery: preparation, properties and interactions with cellsAdv Drug Deliv Rev200254113514711755709
- YonchevaKLizarragaEIracheJMPegylated nanoparticles based on poly(methyl vinyl ether-co-maleic anhydride): preparation and evaluation of their bioadhesive propertiesEur J Pharm Sci200524541141915784331
- MontisciMJDembriAGiovannuciGChacunHDuchêneDPonchelGGastrointestinal transit and mucoadhesion of colloidal suspensions of Lycopersicon esculentum L. and Lotus tetragonolobus lectin-PLA microsphere conjugates in ratsPharm Res200118682983711474788
- IracheJMSalmanHHGamazoCEspuelasSMannose-targeted systems for the delivery of therapeuticsExpert Opin Drug Deliv20085670372418532925
- BiesCLehrCMWoodleyJFLectin-mediated drug targeting: history and applicationsAdv Drug Deliv Rev200456442543514969751
- FrancisMFCristeaMWinnikFMExploiting the vitamin B12 pathway to enhance oral drug delivery via polymeric micellesBiomacromolecules2005652462246716153081
- SalmanHHGamazoCAguerosMIracheJMBioadhesive capacity and immunoadjuvant properties of thiamine-coated nanoparticlesVaccine200725488123813218029067
- HejaziRAmijiMChitosan-based gastrointestinal delivery systemsJ Control Release200389215116512711440
- PregoCTorresDAlonsoMJThe potential of chitosan for the oral administration of peptidesExpert Opin Drug Deliv20052584385416296782
- SmithJMDornishMWoodEJInvolvement of protein kinase C in chitosan glutamate-mediated tight junction disruptionBiomaterials200526163269327615603822
- PeppasNAWoodKMBlanchetteJOHydrogels for oral delivery of therapeutic proteinsExpert Opin Biol Ther20044688188715174970
- AlhaiqueFSantucciECarafaMCovielloTMurtasERiccieriFMGellan in sustained release formulations: preparation of gel capsules and release studiesBiomaterials19961720198119868894092
- GeorgeMAbrahamTEPolyionic hydrocolloids for the intestinal delivery of protein drugs: alginate and chitosan – a reviewJ Control Release2006114111416828914
- PeppasNAKavimandanNJNanoscale analysis of protein and peptide absorption: insulin absorption using complexation and pH-sensitive hydrogels as delivery vehiclesEur J Pharm Sci2006293–418319716777391
- MundargiRCRangaswamyVAminabhaviTMpH-Sensitive oral insulin delivery systems using Eudragit microspheresDrug Dev Ind Pharm201137897798521417605
- LaiSKO’HanlonDEHarroldSRapid transport of large polymeric nanoparticles in fresh undiluted human mucusProc Natl Acad Sci U S A200710451482148717244708
- DawsonMKraulandEWirtzDHanesJTransport of polymeric nanoparticle gene carriers in gastric mucusBiotechnol Prog200420385185715176891
- MuraSHillaireauHNicolasJBiodegradable nanoparticles meet the bronchial airway barrier: how surface properties affect their interaction with mucus and epithelial cellsBiomacromolecules201112114136414321981120
- TakatsukaSKitazawaTMoritaTHorikiriYYoshinoHEnhancement of intestinal absorption of poorly absorbed hydrophilic compounds by simultaneous use of mucolytic agent and non-ionic surfactantEur J Pharm Biopharm2006621525816289777
- El-SayedMGinskiMRhodesCGhandehariHTransepithelial transport of poly(amidoamine) dendrimers across Caco-2 cell monolayersJ Control Release200281335536512044574
- TorchilinVMultifunctional and stimuli-sensitive pharmaceutical nanocarriersEur J Pharm Biopharm200971343144418977297
- DischerDEEisenbergAPolymer vesiclesScience2002297558396797312169723
- des RieuxAFievezVGarinotMSchneiderYJPréatVNanoparticles as potential oral delivery systems of proteins and vaccines: a mechanistic approachJ Control Release2006116112717050027
- RothleinRDustinMLMarlinSDSpringerTAA human intercellular adhesion molecule (ICAM-1) distinct from LFA-1J Immunol19861374127012743525675
- ParkosCAColganSPDiamondMSExpression and polarization of intercellular adhesion molecule-1 on human intestinal epithelia: consequences for CD11b/CD18-mediated interactions with neutrophilsMol Med1996244895058827719
- HuangGTEckmannLSavidgeTCKagnoffMFInfection of human intestinal epithelial cells with invasive bacteria upregulates apical intercellular adhesion molecule-1 (ICAM)-1) expression and neutrophil adhesionJ Clin Invest19969825725838755670
- BurnsRCRivera-NievesJMoskalukCAMatsumotoSCominelliFLeyKAntibody blockade of ICAM-1 and VCAM-1 ameliorates inflammation in the SAMP-1/Yit adoptive transfer model of Crohn’s disease in miceGastroenterology200112161428143611729122
- WatanabeTArakawaTTominagaKFujiwaraYHiguchiKKurokiTNeutrophil accumulation in development gastric ulcer induced by submucosal injection of endothelin-1 in ratsDig Dis Sci200045588088810795748
- MaruoYGochiAKaiharaAICAM-1 expression and the soluble ICAM-1 level for evaluating the metastatic potential of gastric cancerInt J Cancer2002100448649012115535
- DanilovSMGavrilyukVDFrankeFELung uptake of antibodies to endothelial antigens: key determinants of vascular immunotargetingAm J Physiol Lung Cell Mol Physiol20012806L1335L134711350815
- ChittasuphoCXieSXBaoumAYakovlevaTSiahaanTJBerklandCJICAM-1 targeting of doxorubicin-loaded PLGA nanoparticles to lung epithelial cellsEur J Pharm Sci200937214115019429421
- WellerGEVillanuevaFSKlibanovALWagnerWRModulating targeted adhesion of an ultrasound contrast agent to dysfunctional endotheliumAnn Biomed Eng20023081012101912449762
- HsuJSerranoDBhowmickTEnhanced endothelial delivery and biochemical effects of α-galactosidase by ICAM-1-targeted nanocarriers for Fabry diseaseJ Control Release2011149332333121047542
- SakhalkarHSDalalMKSalemAKLeukocyte-inspired biodegradable particles that selectively and avidly adhere to inflamed endothelium in vitro and in vivoProc Natl Acad Sci U S A200310026158951590014668435
- CalderonAJBhowmickTLeferovichJOptimizing endothelial targeting by modulating the antibody density and particle concentration of anti-ICAM coated carriersJ Control Release20111501374421047540
- MuroSGarnachoCChampionJAControl of endothelial targeting and intracellular delivery of therapeutic enzymes by modulating the size and shape of ICAM-1-targeted carriersMol Ther20081681450145818560419
- MuroSWiewrodtRThomasAA novel endocytic pathway induced by clustering endothelial ICAM-1 or PECAM-1J Cell Sci2003116Pt 81599160912640043
- FuTJAbbottURHatzosCDigestibility of food allergens and nonallergenic proteins in simulated gastric fluid and simulated intestinal fluid-a comparative studyJ Agric Food Chem200250247154716012428975
- SaltzmanWMRadomskyMLWhaleyKJConeRAAntibody diffusion in human cervical mucusBiophys J1994662 Pt 15085158161703
- OlmstedSSPadgettJLYudinAIWhaleyKJMoenchTRConeRADiffusion of macromolecules and virus-like particles in human cervical mucusBiophys J20018141930193711566767
- MuroSDziublaTQiuWEndothelial targeting of high-affinity multivalent polymer nanocarriers directed to intercellular adhesion molecule 1J Pharmacol Exp Ther200631731161116916505161
- El-SayedMRhodesCAGinskiMGhandehariHTransport mechanism(s) of poly (amidoamine) dendrimers across Caco-2 cell monolayersInt J Pharm20032651–215115714522128
- NorrisDASinkoPJEffect of size, surface charge, and hydrophobicity on the translocation of polystyrene microspheres through gastrointestinal mucinJ Appl Polym Sci1997631114811492
- JaniPHalbertGWLangridgeJFlorenceATThe uptake and translocation of latex nanospheres and microspheres after oral administration to ratsJ Pharm Pharmacol198941128098122576440
- AnYJLeeHChangDApplication of pulsed Doppler ultrasound for the evaluation of small intestinal motility in dogsJ Vet Sci200121717414614298
- KinnunenJTöttermanSKailaRPietiläJLindenHTervahartialaPEffect of sodium bicarbonate pretreatment on barium coating of mucosa during double contrast barium mealRofo198313921992016307843
- LehrCMBouwstraJAKokWNoachABde BoerAGJungingerHEBioadhesion by means of specific binding of tomato lectinPharm Res1992945475531495901
- FreyAGiannascaKTWeltzinRRole of the glycocalyx in regulating access of microparticles to apical plasma membranes of intestinal epithelial cells: implications for microbial attachment and oral vaccine targetingJ Exp Med19961843104510599064322
- JunCDCarmanCVRedickSDShimaokaMEricksonHPSpringerTAUltrastructure and function of dimeric, soluble intercellular adhesion molecule-1 (ICAM-1)J Biol Chem200127631290192902711390397
- GuarinoACananiRBRussoSOral immunoglobulins for treatment of acute rotaviral gastroenteritisPediatrics199493112168265305
- GhaffarianRBhowmickTMuroSTransport of nanocarriers across gastrointestinal epithelial cells by a new transcellular route induced by targeting ICAM-1J Control Release6122012 [Epub ahead of print.]
- LangerRClelandJLHanesJNew advances in microsphere-based single-dose vaccinesAdv Drug Deliv Rev19972819711910837567