Abstract
Development of micro- and nanotechnology for the study of living cells, especially in the field of drug delivery, has gained interest in recent years. Although several studies have reported successful results in the internalization of micro- and nanoparticles in phagocytic cells, when nonphagocytic cells are used, the low internalization efficiency represents a limitation that needs to be overcome. It has been reported that covalent surface modification of micro- and nanoparticles increases their internalization rate. However, this surface modification represents an obstacle for their use as drug-delivery carriers. For this reason, the aim of the present study was to increase the capability for microparticle internalization of HeLa cells through the use of noncovalently bound transfection reagents: polyethyleneimine (PEI) Lipofectamine™ 2000 and FuGENE 6®. Both confocal microscopy and flow cytometry techniques allowed us to precisely quantify the efficiency of microparticle internalization by HeLa cells, yielding similar results. In addition, intracellular location of microparticles was analyzed through transmission electron microscopy and confocal microscopy procedures. Our results showed that free PEI at a concentration of 0.05 mM significantly increased microparticle uptake by cells, with a low cytotoxic effect. As determined by transmission electron and confocal microscopy analyses, microparticles were engulfed by plasma-membrane projections during internalization, and 24 hours later they were trapped in a lysosomal compartment. These results show the potential use of noncovalently conjugated PEI in microparticle internalization assays.
Introduction
In the past decade, the fabrication of microelectromechanical systems with controlled physical and chemical properties in the micron and submicron scales has been of great interest in the biomedical field due to the high number of potential applications that they offer, such as the creation of biosensor systems, drug delivery systems, or therapeutic implants.Citation1 In fact, fabrication of biological microelectromechanical systems for a wide range of applications, such as cell tracking,Citation2 embryo taggingCitation3 or drug delivery,Citation4–Citation6 has been achieved.
The application of biological microelectromechanical systems has acquired special importance due to their potential use in creating systems able to deliver a drug, in a controlled manner, to a specific target cell.Citation7 The aforementioned studies have been successful with use of phagocytic cells, but when nonphagocytic cells are used, their low capacity of internalization is still a limitation that has to be overcome. Moreover, it has been shown that several features of microparticle design play an important role in their uptake by cells: their size,Citation8,Citation9 shape,Citation10,Citation11 and surface properties.Citation12 Several molecules have been used to increase the capacity for microparticle uptake in nonphagocytic cells, in order to study the internalization process. In all cases, the microparticles were covalently modified with a selected moleculeCitation13–Citation15 or coated with a bacterial membrane.Citation16
Since it has been reported that positive-charged microparticles are more easily internalized by cells,Citation11 the use of transfection procedures in microparticle internalization experiments could be considered as a possible approach to increase microparticle uptake when working with nonphagocytic cells. These procedures are based on the interaction between the positive charges of cationic polymers, like polyethyleneimine (PEI) or cationic lipids, like LipofectamineTM 2000 (LF2000), FuGENE®, or DOTAP, and the negative charges of DNA.Citation17 The positive charges of the transfection reagents can also interact with the negatively charged oligosaccharides of the plasma membrane surface, facilitating the internalization of the complex by endocytosis. Once inside the cell, these reagents can disrupt the endocytic pathway, releasing the contents of the endosomes to the cytosol.Citation18,Citation19 In fact, the covalent binding of PEI to the microparticle surface facilitates their incorporation into HeLa cells.Citation14,Citation20 However, the modification of microparticles with covalently bound PEI would render difficult or even impede their functionalization with other molecules, such as the drug to be delivered. Thus, a new strategy is necessary to improve microparticle uptake by nonphagocytic cells. In this sense, cationic lipids have been recently used as fusogenic agents to improve the internalization of polystyrene particles.Citation21
Against this background, the aim of this study was to improve the efficiency of internalization of polystyrene microparticles by nonphagocytic (HeLa) cells through the use of the cationic polymer PEI and the cationic lipids LF2000 and FuGENE 6 added to the culture medium as transfection agents. The internalization efficiency was evaluated using two completely different methods, confocal scanning laser microscopy (CSLM) and flow cytometry (FC), and took into account first, the cytotoxic effect of the transfection agent at one (LF2000) or three different concentrations (PEI), and second, the number of live, adhered cells with an internalized microparticle. Finally, the intracellular fate of microparticles was determined by immunogold labeling transmission electron microscopy (TEM) and by CSLM.
Materials and methods
Reagents
Unless otherwise stated, reagents were purchased from Life Technologies (Carlsbad, CA).
Polystyrene microparticles
Two types of polystyrene microparticles of 3μm diameter were used: fluorescent microparticles (Fluoresbrite® YG Microsphere 3 μm; Polysciences, Inc, Warrington, PA) and nonfluorescent carboxylated microparticles (Polybead® Carboxylate Microspheres 3 μm; Polysciences). Nonfluorescent carboxylated microparticles were functionalized with an Alexa Fluor® 594 conjugated goat anti-rabbit IgG antibody (H + L) (Life Technologies) using the PolyLink Protein Coupling kit (Polysciences), following the manufacturer’s recommendations.
Cell culture
HeLa cells were cultured at 37°C in a 5% CO2 atmosphere, using minimum essential medium (MEM) with Earle’s salts and L-Glutamine supplemented with 10% fetal bovine serum (FBS).
PEI, LF2000, and FuGENE 6 cytotoxicity assay
The cytotoxicity of PEI 25 KDa (Sigma-Aldrich, St Louis, MO) used at three different concentrations (0.05, 0.10, and 0.15 mM), of LF2000 (Life Technologies), and of FuGENE 6 (Promega Corporation, Fitchburg, WI), used at the concentrations recommended by the manufacturers, was evaluated after the transfection procedure by assessing two different parameters: the percentage of cells that remained attached to the dish (normalized to the control group), and the viability of the attached cells. The global effect of the treatment was calculated by multiplying the normalized percentage of attached cells by the percentage of viable attached cells.
For the first parameter tested, ie, the percentage of cells that remained attached after the transfection procedure, 1.5 × 10⁵ HeLa cells were seeded in 35 mm diameter dishes (Nalge Nunc Int, Roskilde, Denmark). The next day, the transfection reagents at their respective concentrations were prepared and added to the cell cultures. Briefly, PEI 10 mM was initially diluted with NaCl 150 mM, incubated at room temperature for 40 minutes, and then diluted to the three working concentrations (0.05, 0.10, and 0.15 mM) in MEM without serum. LF2000 and FuGENE 6 were prepared according to the manufacturer’s instructions, also in MEM without serum. The culture medium of HeLa cells was then replaced with the corresponding transfection solution, and the cells were incubated for 4 hours at 37°C and 5% CO2. After that, the transfection solutions were replaced with fresh culture medium. In the control culture, a 4-hour incubation with MEM without serum was performed. To determine the number of cells that remained attached, cells were harvested 24 hours later using 0.05% Trypsin-EDTA, centrifuged at 500 g for 5 minutes, and resuspended in fresh culture medium. Then, 50 μL of cell suspension was mixed with 50 μL of Perfect-Count Microspheres™ CYT-PCM50 (Cytognos SL, Salamanca, Spain) and counted in a Becton Dickinson FACSCanto II flow cytometer (BD Biosciences, Franklin Lakes, NJ) equipped with BD Biosciences FACSDiva™ software, the beads and the cells being counted together. The cell concentration was obtained taking into account the concentration of Perfect-Count microspheres.
On the other hand, to evaluate cell viability after the transfection procedures, cells were seeded and incubated with the transfection reagents, at the indicated concentrations. At 24 hours, attached cells were harvested as described, and their viability was determined by FC after applying the LIVE/DEAD® Viability/Cytotoxicity Kit for mammalian cells (L3224; Life Technologies), according to the manufacturer’s instructions. The calcein acetomethoxy (AM) derivative of the kit diffuses through the cell membrane and, once inside the cell, it is converted to highly green fluorescent calcein by the intracellular esterases of living cells. The ethidium homodimer-1 of the kit can only enter cells with damaged membranes, being able to reach the nucleus and bind to DNA, which emits red fluorescence. Therefore, living cells are labeled with green fluorescence, whereas dead cells are labeled with red fluorescence.
Analysis of Zeta potential of polystyrene microparticles
The Zeta potential of microparticles in culture media before and after PEI, LF2000, and FuGENE 6 treatments, was measured using a Zetasizer Nano ZS (Malvern Instruments Malvern, UK).
Internalization of polystyrene microparticles in HeLa cells
To analyze the internalization of microparticles in HeLa cells, two approaches were carried out: CSLM (Fluoview® FV1000; Olympus Corp, Tokyo, Japan) and FC (previously described). For confocal microscope analysis, cells were seeded at a density of 1.5 × 10⁵ cells/dish on 35 mm–diameter gridded glass-bottom coverslip dishes (MatTek Corp, Ashland, MA). For FC analysis, cells were seeded at a density of 1.2 × 10⁶ cells/flask on 75 cm2 flasks (Nunc). After 24 hours of incubation, transfection was performed as described in the previous section. But, in this case, transfection solutions were mixed with 3 μm diameter polystyrene fluorescent microparticles at a final concentration of 106 microspheres/mL. The efficiency of internalization of microparticles by HeLa cells was determined 24 hours later.
For FC analyses, cells were harvested as mentioned above and microparticle–cell association was analyzed measuring the forward scatter and the fluorescent intensity.
For CSLM analyses, cells were washed twice with phosphate-buffered saline (PBS) for 5 minutes, and fixed with 4% paraformaldehyde (Sigma-Aldrich). Then, cells were washed thrice with PBS, blocked with 1% bovine serum albumin ([BSA] Sigma-Aldrich) in PBS, and finally stored at 4°C until their analysis. Samples were first examined under a phase contrast inverted microscope (Olympus IX71, Olympus, Hamburg, Germany) to determine the percentage of cells that were in contact with one or more microparticles. Thus, several fields were captured and then analyzed using image analysis software (ImageJ version 1.43r; National Institutes of Health, Bethesda, MD). Two hundred cells per sample were evaluated for each treatment, and 484 cells in the case of the control group. Following this preliminary assessment, the location of microparticles (ie, inside the cells or attached to their plasma membrane) was determined using CSLM. With this aim, cells were stained with wheat germ agglutinin conjugated to Texas Red (10 μg/mL; Life Technologies) and counterstained with Hoescht 33258 (1 μg/mL; Sigma-Aldrich), to visualize the plasma membrane and the nucleus, respectively. Samples were then examined under the CSLM using a 63 × oil immersion objective, where x-y-z sequential acquisition was performed and orthogonal projections of the stacks were analyzed to determine the location of the microparticles within the cell. For the image analyses, the FV10-ASW Application Software (Ver. 01.07c; Olympus) was used.
The use of gridded dishes allowed us to examine the same fields in both microscopic evaluations (ie, inverted microscope and CSLM).
Electron microscopy
To analyze the intracellular location of microparticles, transfected cells (as described in above) were fixed with 2.5% glutaraldehyde in phosphate buffer (PB). After 1 hour of incubation with the fixative at 4°C, they were washed with PB and postfixed with 1% osmium tetroxide in PB containing 0.8% potassium ferricyanide at 4°C. Next, samples were dehydrated in acetone, infiltrated with Epon™ (Electron Microscopy Sciences, Hatfield, PA) resin over 2 days, embedded in the same resin, and polymerized at 60°C over 48 hours. Ultrathin sections were obtained using a Leica Ultracut UC6 ultramicrotome (Leica Microsystems, Wetzlar, Germany) and mounted on Formvar-coated copper grids. They were stained with 2% uranyl acetate in water and lead citrate. Finally, sections were observed in an electron microscope (J1010; Jeol Ltd, Tokyo, Japan) equipped with a CCD camera SIS Megaview III.
Lysosome associated membrane protein 1 (LAMP-1) immunogold
After microparticle internalization using PEI 0.05 mM treatment, HeLa cells were chemically fixed at 4°C with a mixture of 4% paraformaldehyde and 0.1% glutaraldehyde in PB. After washing with PB containing 50 mM glycine, cells were embedded in 12% gelatine and infused in 2.3 M sucrose. Mounted gelatine blocks were frozen in liquid nitrogen. Thin sections were prepared in an EM Ultracut UC6/FC6 ultracryomicrotome (Leica Microsystems, Wetzlar, Germany). Ultrathin cryosections were collected with 2% methylcellulose in 2.3 M sucrose.
Cryosections were incubated at room temperature on drops of 2% gelatine in PBS for 20 minutes at 37°C, followed by 50 mM glycine in PBS for 15 minutes, 10% FBS in PBS for 10 minutes, and 5% FBS in PBS for 5 minutes. Then they were incubated with 5 μL of rabbit anti-LAMP-1 polyclonal antibody (Abcam, Cambridge, UK) for 30 minutes. After three washes on drops of PBS for 10 minutes, sections were incubated for 20 minutes using colloidal gold conjugated goat anti-rabbit IgG (cat. 111-205-144) Jackson Immunoresearch Laboratories Inc, West Grove, PA) using a 1:30 dilution in 5% FBS/PBS. This was followed by three washes on drops of PBS for 10 minutes, and two washes with distilled water. As a control for nonspecific binding of the colloidal gold conjugated antibody, the primary antibody was omitted.
The observations were done in an electron microscope (Jeol) with a CCD camera SIS Megaview III.
Early endosome antigen 1 protein (EEA-1) and LAMP-1 immunolabeling
To visualize the location of the microparticles 24 hours after the transfection procedure, cells were seeded at a density of 1.5 × 10⁵ cells/dish on 35 mm–diameter gridded glass-bottom coverslip dishes (MatTek Corp). After 24 hours of incubation, transfection with PEI 0.05 M mixed with 3 μm diameter polystyrene functionalized microparticles (previously described) at a final concentration of 106 microspheres/mL was performed as described above. After 24 hours, cells were washed twice with PBS fixed in 4% paraformaldehyde/PBS, permeabilized with 0.25% Triton X-100 in PBS, and blocked with 5% PBS/BSA. Then, cells were incubated for 1 hour at 37°C with one of two primary antibodies, mouse anti-EEA-1 monoclonal antibody (cat. 610456 BD Biosciences) or mouse anti-LAMP-1 polyclonal antibody (cat. 555798 BD Biosciences), to label the endosomal or the lysosomal compartment, respectively. Finally, cells were incubated for 1 hour at room temperature with Alexa 488-conjugated chicken anti-mouse IgG antibody (Life Technologies), counterstained with Hoescht 33258, and analyzed by CSLM. For each marker, 40 cells with microparticles were analyzed.
Statistical analyses
Normal distribution of data was verified with the Kolmogorov–Smirnov test, and homoscedasticity was assessed with the Levene’s test. When necessary, data (x) on percentages were transformed with arcsin square root transformation (arcsin√x) for accomplishing the parametric assumptions. The comparison among the different treatments was done with a one-way analysis of variance (ANOVA), followed by a posthoc t-test with Bonferroni’s correction for multiple comparisons. P < 0.05 was considered to be statistically significant.
Results
Cytotoxic effect of transfection reagents
The percentage of cells that remained attached to the dish after the transfection procedures can be seen in , showing that all treatments resulted in a significant decrease in the percentage of attached cells. Normalized to the control group, PEI 0.05 mM was the less aggressive treatment (77.4% of cells remaining attached) when compared with the rest of the treatments (47.5%, 36.5%, 20.8%, and 20.1% for PEI 0.10 mM, FuGENE 6, LF2000, and PEI 0.15 mM, respectively).
Figure 1 Cytotoxicity of transfection treatments. (A) Percentage of cells that remained attached to the dish after treatments, normalized to the control. (B) Percentage of viable attached cells after treatments. (C) Percentage of viable cells.
Note: a, b, c denote significant differences among groups.
Abbreviations: PEI, polyethyleneimine; LF, Lipofectamine™.
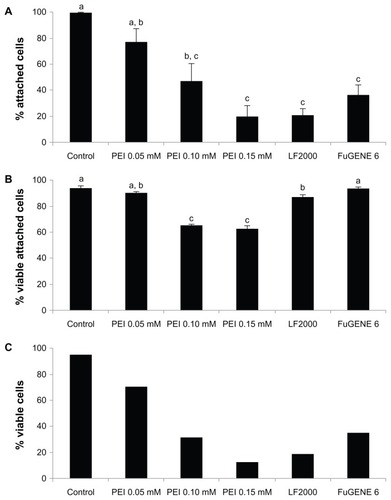
The viability of the attached cells was determined by calcein AM/ethidium homodimer-1staining. shows that after PEI 0.10 mM and 0.15 mM treatments, the percentages of living cells were significantly lower (65.6% and 62.5%, respectively) than those observed following the other treatments (94.7% [control], 94.1% [FuGENE 6], 90.4% [PEI 0.05 mM], and 87.6% [LF2000]). Moreover, the difference between control and LF2000 was also significant.
When both parameters are considered (), PEI 0.05 mM appears as the least cytotoxic treatment, with 70% of cells remaining viable; whereas in the other treatments, less than 35% of the cells remained alive (34.3% FuGENE 6; 31.2% PEI 0.10 mM; 12.6% PEI 0.15 mM; and 18.2% LF2000).
Effect of transfection reagents on microparticle surface charge
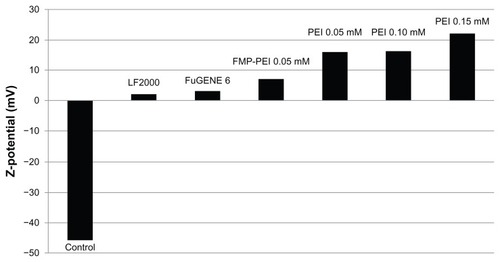
To evaluate the electrochemical changes at the microparticle surface due to the treatment with the transfection reagents, their Z potential was analyzed. As can be seen in , nontreated fluorescent microparticles showed a highly negative Z potential (-45.9), whereas treatment with the transfection reagents clearly changed the surface to positively charged. This change also occurred in functionalized microparticles after PEI 0.05 treatment.
Figure 2 Z potential of control microparticles and of microparticles treated with PEI, LF2000 and FuGENE 6®.
Note: The Zeta potential of the functionalized microparticle is also shown.
Abbreviations: FMP, functionalized microparticle; PEI, polyethyleneimine; LF, Lipofectamine™.
Internalization of polystyrene microparticles by HeLa cells
Microparticle internalization by HeLa cells was evaluated by two approaches, FC and CSLM. By FC, it was observed that for all treatments, the number of cells in contact with microparticles was clearly increased from twofold (PEI 0.15 mM) to fivefold (PEI 0.05 mM) when compared with the control (). In addition, for all treatments, in the population of cells associated with microparticles, there were no differences among the percentages of cells with one, two, three, or more microparticles ().
Figure 3 Flow cytometry analysis. Percentage of cells in contact with at least one microparticle.
Notes: a, b, c, d denote significant differences among groups.
Abbreviations: PEI, Polyethyleneimine; LF, Lipofectamine™.
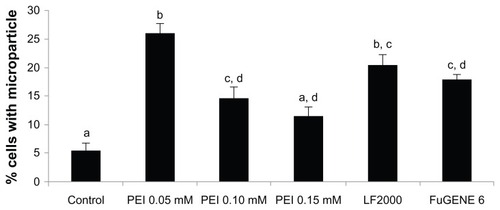
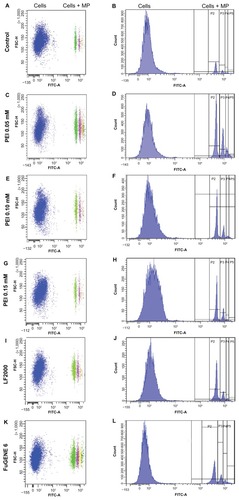
Figure 4 Flow cytometry analysis. Transfection agents’ effect on the internalization of fluorescent microparticles by HeLa cells. (A), (C), (E), (G), (I) and (K) Dot plots showing two populations of cells: associated (cells + MP) or not associated (cells) with green fluorescent microparticles. (B), (D), (F), (H), (J) and (L) Histograms showing the fluorescence intensity of the different populations of cells.
Notes: Cells = cell population not associated with microparticles. Cells + MP = cell population associated with at least one microparticle. P2, P3, P4, P5 = cell population associated with one, two, three, or more than three microparticles, respectively.
Abbreviations: MP, microparticle; PEI, polyethyleneimine; LF, Lipofectamine™.
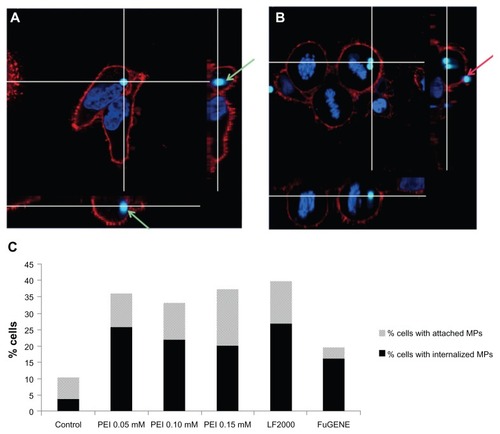
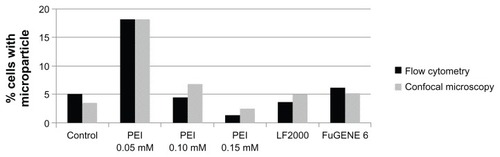
Confocal microscopy analyses were performed next to precisely determine whether microparticles were located inside or outside the cells (). As can be seen in , in the cells that remained attached to the dish, a significant increase (P < 0.05) in the percentage of cells in contact with microparticles and in the percentage of cells with internalized microparticles was observed for all treatments compared with the control group, these results being consistent with those previously obtained by FC.
Figure 5 CSLM analyses of microparticle location. (A and B) CSLM-obtained images (middle) and their orthogonal projections of the z-stack reconstructions (right and bottom) of consecutive focal planes (0,5 μm each). (C) Percentage of cells in contact with microparticles, either attached or internalized, analyzed by CSLM.
Notes: Green arrows indicate a microparticle located inside the cell, clearly surrounded by the plasma membrane. The red arrow points to a microparticle attached to the plasma membrane but outside the cell. Plasma membrane appears in red (WGA-Texas Red® Staining) and chromatin in blue (Hoescht 33258).
Abbreviations: CSLM, confocal scanning laser microscopy; PEI, polyethyleneimine; LF, Lipofectamine™.
Finally, the results obtained from FC and CSLM analyses were compared taking into account the cytotoxic effect of the different treatments (see ). shows that PEI 0.05 mM provided the highest microparticle internalization efficiency, doubling at least the efficiency of the other treatments.
Figure 6 Microparticle internalization efficiency. Percentage of viable cells with one or more internalized microparticles after the different transfection treatments.
Notes: Results were obtained from internalization analyses by both CSLM and FC, taking into account the number of cells that remained attached to the dish after treatments and their viability.
Abbreviations: CSLM, confocal scanning laser microscopy; FC, flow cytomtery; PEI, polyethyleneimine; LF, Lipofectamine™.
Internalization of functionalized polystyrene microparticles by HeLa cells
To test whether PEI 0.05 mM could also enhance microparticle internalization when a cargo is covalently attached to their surface, the internalization efficiency of antibody-functionalized microparticles was determined by CSLM. This analysis showed that 18.9% of the cells had internalized at least one functionalized microparticle, a percentage equivalent to that for non-functionalized microparticles (25.5%) and significantly higher than that for the control group (3.7%).
Intracellular location of microparticles
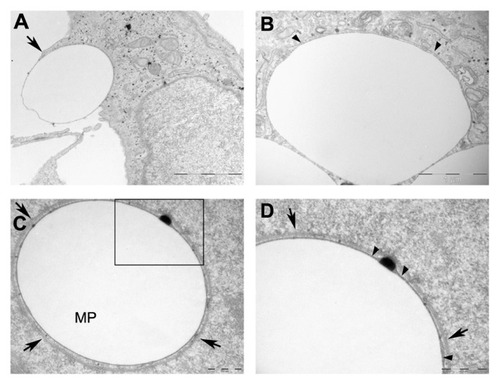
To investigate the intracellular fate of microparticles, TEM analyses were carried out in Epon-embedded samples. According to the previous results, only the PEI 0.05 mM treatment was selected for these analyses. A plasma membrane evagination was clearly observed around microparticles whilst they were being engulfed by HeLa cells (). Once internalized, microparticles appeared to be tightly surrounded by a single membrane in the majority of cases (), and occasionally, they were additionally surrounded by a two-membrane complex ().
Figure 7 Microparticle localization by transmission electron microscopy. Micrographs of HeLa cells with internalized microparticles. (A) Illustration of the internalization of microparticles; arrow indicates a cell membrane evagination, typical of macropinocytosis. (B) A single membrane surrounding an internalized microparticle. (C) Microparticle surrounded by a double membrane. (D) Enlarged view of the microparticle shown in C.
Notes: Arrow heads point to a single membrane tightly associated to microparticle. Arrows indicate the two membrane complex. Scale bars: (A) 2 μm (B) 1 μm (C) and (D) 500 nm.
Abbreviation: MP, microparticle.
The immunolocalization of LAMP-1 showed that in the majority of cells analyzed, the membrane surrounding the microparticles was positive for LAMP-1, indicating that microparticles were trapped in a lysosomal compartment ().
Figure 8 LAMP-1 immunogold detection. Cryotransmission electron micrographs of LAMP-1 immunogold performed in HeLa cells. (A–C) Arrow heads indicate positive LAMP-1 marks. (D) Arrow heads indicate positive LAMP-1 marks whereas arrows point to the lysosome membrane.
Abbreviation: LAMP-1, lysosome associated membrane protein 1; L, lysosome.
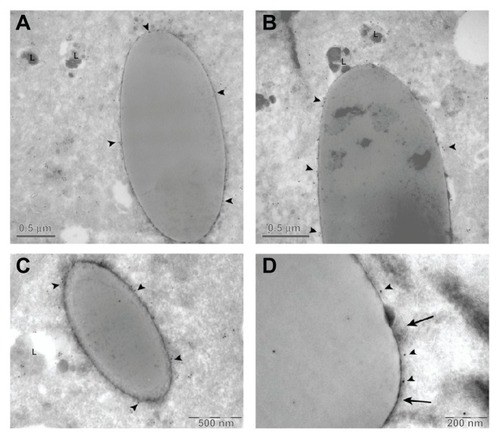
Figure 9 Intracellular location analysis of functionalized microparticles by CSLM. (A) Endosomal labeling with EEA-1. (B) Lysosomal labeling with LAMP-1. (C and D) Microparticles functionalized with an Alexa Fluor®-594 conjugated antibody. (E and F) Merged images of compartment and microparticles.
Abbreviations: CSLM, confocal scanning laser microscopy; EEA-1, early endosome antigen 1 protein; LAMP-1, lysosome associated membrane protein 1.
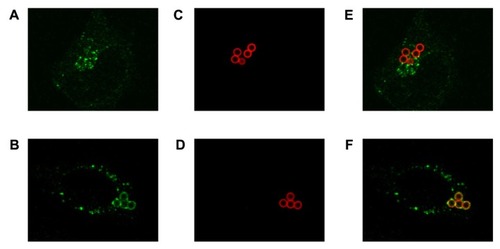
To quantify the number of internalized microparticles located inside lysosomes, CSLM analysis using two cell compartment markers (EEA-1 for endosomes and LAMP-1 for lysosomes) was carried out. In this case, antibody-functionalized microparticles were used because their lower fluorescence intensity in relation to fluorescent microparticles allowed us to observe the colocalization of the internalized microparticles and the endosomal/lysosomal compartments. It was observed that 24 hours after treatment, none of the microparticles colocalized with endosomes and 83.4% colocalized with lysosomes, confirming the results previously obtained by TEM.
Discussion
The use of micro- and nanoparticles as carriers for drug delivery applications has gained interest in recent years.Citation7 It has been shown that their uptake by cells is highly dependent on their physical and chemical properties, especially their size and surface charge (being that cationic particles are more easily uptaken by cells).Citation11 However, the low capacity of nonphagocytic cells for the internalization of micron-sized particles is a handicap that needs to be improved.
In order to increase microparticle uptake by nonphagocytic cells, PEI, LF2000, and FuGENE 6 were chosen because of their efficiency in DNA transfection procedures. Moreover, PEI and LF2000 have also been used in microparticle-Citation14,Citation20,Citation21 and nanoparticle-internalizationCitation22 experiments.
In our study, we analyzed the effect of free PEI (ie, noncovalently bound to microparticle surface) on the microparticle-internalization efficiency. Considering that these microparticles are expected to be drug-delivery carriers in the future and that the cargo will need to be attached to their surface, we considered the use of free PEI as a more appropriate approach to avoid competition for the same substrate. To the best of our knowledge, this is the first time that free PEI has been used for internalizing microparticles. In this regard, although PEI, LF2000, and FuGENE 6 have been widely used in DNA transfection procedures with positive results, it has been described that they produce a considerable cytotoxic effect, which has to be taken into account.Citation18,Citation23 Thus, with the aim of finding the best balance between efficiency of microparticle internalization and cytotoxicity, three different concentrations of PEI were tested in the present study. The highest concentration was set at 0.15 mM since it has been reported that an intense cytotoxic effect is observed at higher concentrations.Citation24 In the case of LF2000 and FuGENE 6, the concentrations used were those recommended by the manufacturers, which provided good results when used for internalizing 1 or 3 μm–sized beads in the case of LF2000.Citation21
In our study, the number of cells remaining attached to the culture plates after their exposure to the transfection reagents was determined, together with the viability of these attached cells. This combined analysis allowed us to more accurately determine the cytotoxic effect of the treatments. We observed that compared with the control culture, the percentage of viable cells among those attached was high in all treatments (more than 60% viable cells), but a reduction in the percentage of attached cells was observed for all treatments. These data demonstrate the usefulness of taking into account not only the viability of the cells but also the percentage of remaining cells after treatments in the cytotoxicity assays and moreover, showed that PEI at 0.05 mM was the least cytotoxic treatment. On the other hand, our viability results are in agreement with previous reports in that free PEI treatments produced a dose-dependent cytotoxic effect.Citation25 None of the reported studies that used LF2000 to improve microparticle uptakeCitation21,Citation26 analyzed the cytotoxic effect of this agent.
To calculate the efficiency of microparticle uptake, two different strategies were used. FC studies allowed us to clearly identify the population of cells associated with microparticles but also to discriminate among cells associated with one or more microparticles. The results obtained by FC showed that all treatments increased the percentage of cells associated with microparticles, especially PEI 0.05 mM (25.9%) and LF2000 (20.4%). Furthermore, no significant differences were found between these two treatments, indicating that both would be equally efficient in terms of microparticle internalization. In the case of PEI, a decrease in the percentage of cells in contact with microparticles was observed as PEI concentration was increased. However, FC did not allow us to distinguish between internalized microparticles and those only bound to the cell surface.
To complement the FC data and to determine the location of microparticles, confocal analyses of cells were performed. By confocal microscopy, it was possible to discriminate and quantify the number of microparticles that had been internalized or that were only in contact with the cell surface. With regards to the use of LF2000, our results are in agreement with those of Kobayashi et al,Citation21 who reported an increase in the rate of internalization of 1 μm–sized microparticles by HeLa cells when using this reagent. On the other hand, and concerning the use of PEI, the data obtained in the present study agree with previous studies, such as that of Thiele et al,Citation14 who demonstrated that microparticles covalently bound to PEI are more efficiently internalized by macrophages and dendritic cells than are microparticles alone. In the present study, we demonstrated that PEI could also increase microparticle internalization in nonphagocytic cells, and that this could be accomplished without its covalent attachment to the microparticle surface. In addition, we observed a dose-dependent, inverse relationship between PEI concentration and internalization efficiency. In agreement with FC, quantification by CSLM indicated that increasing concentrations of PEI not only resulted in an increase in the number of microparticles in contact with cells, but also in a decreased internalization. Our results suggest that the lower internalization rates at higher PEI concentrations could be related to its higher cytotoxic effect, especially membrane damage,Citation27,Citation28 which would lead to an incapability of the affected cells for microparticle internalization.
The higher efficiency of microparticle internalization after their treatment with a transfection reagent seems to be related to the changes in surface charges, as determined by the results of the Z potential analysis. Our results also showed that although surface properties of the microparticles were modified after the antibody conjugation, PEI could still interact with them, increasing their uptake by cells without affecting the fluorescence emission of the functionalizing molecule.
Both FC and CSLM analyses showed that, when the cytotoxic effect of the transfection reagents is considered, PEI 0.05 mM turns out to have been the most effective treatment, since it led to at least a twofold increased microparticle internalization rate. The advantage of FC was the high number of cells that could be analyzed in a short period of time, whereas the advantage of CSLM was its ability to ascertain internalization.
Considering that microparticles are expected to deliver their cargo inside the cell, it is necessary to determine their exact location inside the cell. Our results, using TEM analyses, showed that they were engulfed by a cell membrane evagination and no discernible coat was visible. We also observed that once inside the cell, they appeared to be tightly surrounded by a single membrane, positive for the LAMP-1 lysosome marker, indicating that after 24 hours, the majority of microparticles were entrapped in lysosomes. These results have been confirmed by the use of nonfluorescent microparticles functionalized with an Alexa 594-conjugated secondary antibody, as the majority of internalized microparticles were also localized in the lysosomal compartment. We anticipated that using PEI, microparticles would be found in the cytosol, because it has been previously reported that the capability of protonation of PEI results in the disruption of endosomes.Citation29–Citation31 Authors that have covalently attached PEI to microparticlesCitation20 have reported that these particles can be found free in the cytosol as early as 4–6 hours posttransfection when using PEI 70 KDa but not when using PEI 25 KDa. Kobayashi et alCitation21 demonstrated that the use of free cationic lipids increases the internalization of microparticles and that once in the endosomes compartment, they escape in a few minutes. According to this author, the rupture of the endosome membrane induces the formation of an autophagosome. In our study by TEM, we found that a few microparticles were surrounded by a double membrane, which could correspond to endoplasmic reticulum, indicating that an autophagic process was taking place. Our results regarding the intracellular location of microparticles by CSLM confirmed the results of the TEM studies, indicating that in the majority (83.4%) of cells, the internalized microparticles were located in the lysosomal compartment. As no endosomal association with microparticles was observed, the microparticles that were not located in lysosomes could be either free in the cytosol, or part of an autophagic process. Further studies will be necessary to analyze whether, when microparticles are functionalized with a specific cargo, the cargo can be released into the cytosol even if the microparticle remains trapped inside an organelle.
Conclusion
To sum up, our results show that PEI 25 kDa at a concentration of 0.05 mM significantly increases microparticle internalization by nonphagocytic HeLa cells with a low cytotoxic effect, and that this can be achieved without the covalent binding of PEI to the microparticle surface. Both CSLM and FC can be used for the quantification of internalization efficiency, yielding similar results, but FC allows a fast analysis of high numbers of cells whereas CSLM allows distinction between cells with internalized microparticles and cells with microparticles attached to their surface. Finally, our results show that 0.05 mM PEI 25 kDa does not induce endosomal disruption, as internalized microparticles remain surrounded by a lysosomal membrane. With a view to drug delivery, further studies will be necessary to evaluate whether functionalized microparticles entrapped in lysosomes are still able to release their cargo into the cytosol.
Acknowledgments
This work was supported by the Spanish Ministerio de Ciencia e Innovación (MINAHE 3; TEC2008-06883-C03-03 y MINAHE 4; TEC2011-29140-C03-03), the Generalitat de Catalunya (2009 SGR-282), and the AGAUR FI-DGR 2011 and FI-DGR 2012 grants. The authors wish to thank the staff at the Servei de Microscòpia and the Unitat de Citometria de Flux of the Universitat Autònoma de Barcelona, and the staff at the Unitat de Microscòpia Electrònica i Reconeixement Molecular in Situ, especially Carmen López at the Universitat de Barcelona.
Disclosure
The authors report no conflicts of interest in this work.
References
- GraysonACRShawgoRSJohnsonAMA BioMEMS review: MEMS technology for physiologically integrated devicesProc IEEE2004921621
- Fernandez-RosasEGómezRIbanezEIntracellular polysilicon barcodes for cell trackingSmall20095212433243919670393
- NovoSBarriosLSantalóJA novel embryo identification system by direct tagging of mouse embryos using silicon-based barcodesHum Reprod20112619610521088013
- TaoZTomsBGoodismanJAsefaTMesoporous silica microparticles enhance the cytotoxicity of anticancer platinum drugsACS Nano20104278979420131868
- TasciottiELiuXBhavaneRMesoporous silicon particles as a multistage delivery system for imaging and therapeutic applicationsNat Nanotechnol20083315115718654487
- SerdaREGuJBhavaneRCThe association of silicon microparticles with endothelial cells in drug delivery to the vasculatureBiomaterials200930132440244819215978
- Caldorera-MooreMPeppasNAMicro- and nanotechnologies for intelligent and responsive biomaterial-based medical systemsAdv Drug Deliv Rev200961151391140119758574
- ZaunerWFarrowNAHainesAMIn vitro uptake of polystyrene microspheres: effect of particle size, cell line and cell densityJ Control Release2001711395111245907
- RejmanJOberleVZuhornISHoekstraDSize-dependent internalization of particles via the pathways of clathrin- and caveolae-mediated endocytosisBiochem J2004377Pt 115916914505488
- GengYDalhaimerPCaiSShape effects of filaments versus spherical particles in flow and drug deliveryNat Nanotechnol20072424925518654271
- GrattonSERoppPAPohlhausPDThe effect of particle design on cellular internalization pathwaysProc Natl Acad Sci U S A200810533116131161818697944
- MakinoKYamamotoNHiguchiKHaradaNOhshimaHTeradaHPhagocytic uptake of polystyrene microspheres by alveolar macrophages: effects of the size and surface properties of the microspheresColloid Surf B20032713339
- FosterKAYazdanianMAudusKLMicroparticulate uptake mechanisms of in-vitro cell culture models of the respiratory epitheliumJ Pharm Pharmacol2001531576611206193
- ThieleLMerkleHPWalterEPhagocytosis and phagosomal fate of surface-modified microparticles in dendritic cells and macrophagesPharm Res200320222122812636160
- BühlerOTWiedigCASchmidYGrasslGABohnEAutenriethIBThe Yersinia enterocolitica invasin protein promotes major histocompatibility complex class I- and class II-restricted T-cell responsesInfect Immun20067474322432916790806
- TsudaKAmanoAUmebayashiKMolecular dissection of internalization of Porphyromonas gingivalis by cells using fluorescent beads coated with bacterial membrane vesicleCell Struct Funct2005302819116428861
- Tros de IlarduyaCSunYDüzgünesNGene delivery by lipoplexes and polyplexesEur J Pharm Sci201040315917020359532
- GodbeyWTWuKKMikosAGPoly(ethylenimine) and its role in gene deliveryJ Control Release1999602–314916010425321
- PichonCBillietLMidouxPChemical vectors for gene delivery: uptake and intracellular traffickingCurr Opin Biotechnol201021564064520674331
- KasturiSPSachaphibulkijKRoyKCovalent conjugation of polyethyleneimine on biodegradable microparticles for delivery of plasmid DNA vaccinesBiomaterials200526326375638515913771
- KobayashiSKojidaniTOsakadaHArtificial induction of autophagy around polystyrene beads in nonphagocytic cellsAutophagy201061364519901555
- HuCPengQChenFZhongZZhuoRLow molecular weight polyethylenimine conjugated gold nanoparticles as efficient gene vectorsBioconjug Chem201021583684320438071
- DuanYZhangSWangBYangBZhiDThe biological routes of gene delivery mediated by lipid-based non-viral vectorsExpert Opin Drug Deliv20096121351136119780710
- LambertRCMauletYDupontJLPolyethylenimine-mediated DNA transfection of peripheral and central neurons in primary culture: probing Ca2+ channel structure and function with antisense oligonucleotidesMol Cell Neurosci1996732392468726106
- DengRYueYJinFRevisit the complexation of PEI and DNA – how to make low cytotoxic and highly efficient PEI gene transfection non-viral vectors with a controllable chain length and structure?J Control Release20091401404619625007
- Gómez-MartinezRVázquezPDuchMIntracellular silicon chips in living cellsSmall20106449950220025079
- HelanderIMAlakomiHLLatva-KalaKKoskiPPolyethyleneimine is an effective permeabilizer of gram-negative bacteriaMicrobiology1997143Pt 10319331999353921
- HelanderIMLatva-KalaKLounatmaaKPermeabilizing action of polyethyleneimine on Salmonella typhimurium involves disruption of the outer membrane and interactions with lipopolysaccharideMicrobiology1998144Pt 23853909493375
- BoussifOLezoualc’hFZantaMAA versatile vector for gene and oligonucleotide transfer into cells in culture and in vivo: polyethylenimineProc Natl Acad Sci U S A19959216729773017638184
- CreusatGRinaldiASWeissEProton sponge trick for pH-sensitive disassembly of polyethylenimine-based siRNA delivery systemsBioconjug Chem2010215994100220481503
- SonawaneNDSzokaFCJrVerkmanASChloride accumulation and swelling in endosomes enhances DNA transfer by polyamine-DNA polyplexesJ Biol Chem200327845448264483112944394