Xue J, Sun N, Liu Y. Int J Nanomedicine. 2022;17:2459-2474.
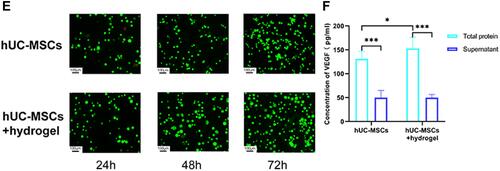
The authors have advised that an error was made during the preparation of the AO/EB images shown in on page 2466. All the original data was retained and correct images for the hUC-MSCs, 48h and 72h timepoints were selected as suitable replacements. The corrected is shown below.
Figure 2 Continued.
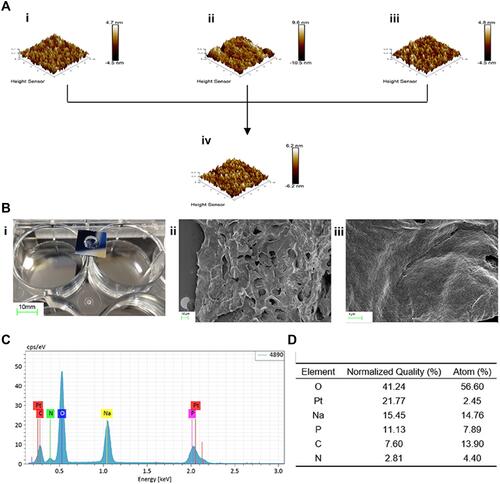
Figure 2 Characteristics of peptide hydrogel and co-culture with hUC-MSCs. (A) Microstructure of peptide hydrogel including RADA16-I (i), RGD (ii), KLT (iii), and mixed peptide hydrogel (iv) were observed by atomic force microscopy. (B) Macrostructure of a self-assembled mixed peptide hydrogel using a transwell chamber (Corning 7007). Scale bar: 10 mm (i) Microstructure of a mixed peptide hydrogel was observed using scanning electron microscopy. Scale bar: 10 μm (ii) and 1 μm (iii). (C and D) The elemental composition of the mixed peptide hydrogel and their percentages were obtained by mapping analysis. (E) The state of the mixed peptide hydrogel co-cultured with hUC-MSCs in hUC-MSCs and hUC-MSCs+hydrogel groups was examined by AO/EB staining after 24, 48, and 72h. (F) The concentration of VEGF in the total protein and supernatant after co-culture of hUC-MSCs with or without mixed peptide hydrogels was measured with a VEGF kit. Scale bar: 100 µm. *p<0.05, ***p<0.001.