
Abstract
Background
Oxidative stress induced reactive oxygen species (ROS) and aggregation of amyloid β (Aβ) in the nervous system are significant contributors to Alzheimer’s disease (AD). Cerium dioxide and manganese oxide are known as to be effective and recyclable ROS scavengers with high efficiency in neuroprotection.
Methods
A hollow-structured manganese-doped cerium dioxide nanoparticle (LMC) was synthesized for loading Resveratrol (LMC-RES). The LMC-RES were characterized by TEM, DLS, Zeta potential, and X-ray energy spectrum analysis. We also tested the biocompatibility of LMC-RES and the ability of LMC-RES to cross the blood-brain barrier (BBB). The antioxidant effects of LMC-RES were detected by SH-SY5Y cells. Small animal live imaging was used to detect the distribution of LMC-RES in the brain tissue of AD mice. The cognitive abilities of mice were tested by water maze and nesting experiments. The effects of LMC-RES in reducing oxidative stress and protecting neurons was also explored by histological analysis.
Results
The results showed that LMC-RES had good sustained release effect and biocompatibility. The drug release rate of LMC-RES at 24 hours was 80.9 ± 2.25%. Meanwhile, LMC-RES could cross the BBB and enrich in neurons to exert antioxidant effects. In Aβ-induced SH-SY5Y cells, LMC-RES could inhibits oxidative stress through the Nrf-2/HO-1 signaling pathway. In AD model mice, LMC-RES was able to reduce ROS levels, inhibit Aβ-induced neurotoxicity, and protect neurons and significantly improve cognitive deficits of AD mice after drug administration.
Conclusion
LMC-RES can effectively across the BBB, reduce oxidative stress, inhibit Aβ aggregation, and promote the recovery of neurological function.
Introduction
Alzheimer’s disease (AD) is the most common neurodegenerative disease characterized by a progressive decline in cognitive ability. Amyloid plaques and neurofibrillary tangles are the main pathological features of AD.Citation1,Citation2 As early as 1906, it was demonstrated that almost all amyloid plaques in the AD brain consist of β amyloid (Aβ). The molecular event of aggregation of Aβ protofibrils into Aβ oligomers and amyloid plaques ultimately leads to AD. Many studies have shown that the elevated markers for oxidative stress precede Aβ deposition and neurofibrillary tangles.Citation3 As a result, oxidative stress plays a critical role in AD neuropathology. Reactive oxygen species (ROS), a product of oxidative stress, causes mitochondrial dysfunction, induces neuroinflammation, upregulate associated pro-inflammatory factors, affects neuronal function, and facilitates AD pathogenesis.Citation4–6 Therefore, reducing ROS is crucial to slowing neurodegeneration in brain with AD.
Nanotechnology is increasingly being applied in medical research. Nanomaterials have attracted much attention in medicine because of their excellent properties such as low toxicity, high drug loading capacity, and precise targeting of injury sites.Citation7–10 Cerium is a rare earth metal that exists in the form of oxides (CeO2 and Ce2O3) in nature and has received special attention for its excellent biocompatibility. Cerium has two valence states, namely, trivalent and tetravalent, and its antioxidant capacity depends on the variation between the valence states. Tetravalent cerium can mimic the activity of various enzymes such as superoxide dismutase and catalase.Citation11 Cerium dioxide nanoparticles have been reported to reduce oxidative stress damage and improve the learning ability and cognitive function in mice with AD.Citation12–14 In addition, the unique antioxidant properties of CeO2 can be enhanced by blending it with other nanomaterials. Manganese has an ionic radius similar to that of cerium, so it is often used as a dopant for CeO2 nanoparticles.Citation15 Manganese-doped CeO2 hollow spheres exhibit enhanced catalytic activity toward H2O2 compared to pure MnO2 and pure CeO2 hollow spheres.Citation16 The strong synergy between CeO2 and MnO2 contributes to the eminent catalytic activity.Citation16–18 Based on the above characteristics, in this study, we synthesized mesoporous hollow nanoparticles of manganese-doped CeO2 dominated by tetravalent cerium (MC). This special hollow structure can not only inhibit oxidative stress but also store large amounts of drugs.
Resveratrol (3,5,40-trihydroxystilbene, RES) is a natural plant pheromone with various active effects, including reducing inflammation, scavenging oxidative stress and immunomodulatory effects.Citation19,Citation20 Some studies have shown that it has a potential therapeutic effect on AD.Citation21,Citation22 However, due to the difficulty of dissolving RES in water, the clinical application and therapeutic efficiency of RES are limited by its low bioavailability and the presence of the blood–brain barrier (BBB).Citation23,Citation24 Therefore, we integrated RES into the manganese-doped CeO2 nanoparticles (MC) to improve their bioavailability. Since the surface of BBB containing lactoferrin transporters, we chose to modify the surface of MC with lactoferrin (LMC) to carry the drug to the brain without interference from the BBB. In addition, the lactoferrin modification not only modulates the drug release rate of MC but also improves their biocompatibility.Citation25–27 In this study, lactoferrin-functionalized manganese-doped CeO2 nanoparticles loaded with resveratrol (LMC-RES) were prepared to treat AD. We conducted in vivo and in vitro studies to demonstrate the antioxidant and neuroprotective effects of LMC-RES and to explore its mechanism of action. This has important implications for the treatment of AD ().
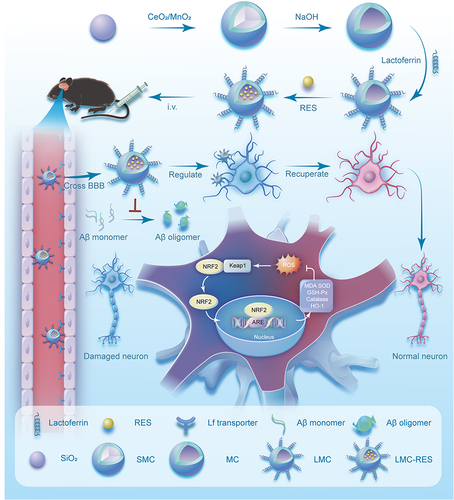
Scheme 1 Preparation of LMC-RES and its mechanism of action in the treatment of Alzheimer’s disease.
Materials and Methods
Material
Dicyclohexyl carbodiimide (DCC) and n-hydroxysuccinimide (NHS) were obtained from Sinopharm Chemical Reagent Co.Ltd. RES ordered with Aladdin. CeN3O9·6H2O, MnCl2·4H2O, phloretin, sodium carboxymethylcellulose, prepared by Aladdin Chemical Reagent Company. Ammonia, and styrene are purchased from Sinopharm Chemical Reagent Co. Ltd. Superoxide Malondialdehyde (MDA) Assay Kit, Total Glutathione (GSH-Px) Assay Kit, Dismutase (SOD) Assay Kit, Reactive Oxygen Species Assay Kit, Catalase Anti-Catalase are purchased from Beyotime Biotechnology Co. Dimethyl sulfoxide (DMSO), Hematoxylin-Esin/HE Staining Kit purchased from solarbio. Mouse Aβ (Amyloid beta) (1–42) ELISA kit is purchased from Elabscience. The antibodies of Nrf-2, Keap1, HO-1, BDNF and β-Tubulin are purchased from Affinity. Aβ (25–35) was purchased from MedChemExpress Reagent. The SH-SY5Y cells and brain derived vascular endothelial cells.3 (bEnd.3) are provided by the Cell Bank of the Chinese Academy of Sciences. The animals come from The Jackson Laboratory in the United States.
Preparation of SiO2 Template, MC, and LMC
SiO2 Template
Solid silica nanoparticles (SiO2) were prepared using the sol-gel method. SiO2 powder was obtained by adding 6 mL of TEOS to an ethanol solution, adjusting the pH to 11.5 with 25% ammonia, stirring for 8 h at room temperature, centrifuging for 15 min, and drying under vacuum for 12 h. The resulting powder was used as the SiO2 template.
MC
MC was prepared by improving on the basis of previous studies.Citation15 First, 150 mg SiO2 was added to 30 mL of ethanol and sonicated for 30 min. Afterward, 0.072 g of CeN3O9·6H2O and 0.018 g of MnCl2·4H2O were added to a 0.5 M urea solution and mixed. Then, an ethanol solution containing SiO2 was added and the mixture was sonicated for 30 min. The mixed solution was placed in an autoclave at 160°C and reacted for 8 h. The precipitate was mixed with a 2 M NaOH solution and reacted at 80°C for 24 h to remove the template. Finally, it was centrifuged and vacuum dried for 12 h to obtain MC powder.
LMC
First, 100 mg of MC powder was mixed with 1 mg/mL of lactoferrin, stirred for 6 h, and then freeze-dried. The dried powder constituted the LMC.
Determination of Surface Protein Components of LMC
The presence of lactoferrin in LMC was first qualitatively determined using sodium dodecyl sulfate (SDS)-polyacrylamide gel electrophoresis. Subsequently, the lactoferrin was eluted from the surface of the LMC by repeated centrifugation. The supernatant was collected and the protein content in the supernatant was measured using the bicinchoninic acid (BCA) method to determine the amount of lactoferrin adsorbed by the LMC.
LMC-RES Drug Loading Assay
MC powder was dispersed in an RES methanol solution (100 mg/mL), stirred for 6 h, centrifuged, and dried to obtain MC-RES. Next, MC-RES powder was stirred with an aqueous lactoferrin solution (1 mg/mL) for 5 h, centrifuged, and dried to obtain LMC-RES. The drug content was measured using ultraviolet spectrophotometry.
Loading ratio (LC) = (amount of loaded drug)/ (total amount of nanocomposite) *100%
In vitro Detection of Drug Release
The detection of drug release in vitro were tested by a dissolution apparatus. Samples (equivalent to 5 mg of RES) were placed in pH 7.2 and 5.4 phosphate buffer solutions. The temperature was 37°C and the paddle speed was 100 rpm. The dissolution medium (5 mL) was collected for filtration at predetermined time intervals and then supplemented with an equal amount of a blank medium. Finally, the RES concentration in the filtrate was measured at 306 nm using UV light. All experiments were measured three times.
Cell Culture and Treatment
SH-SY5Y cells and bEnd.3 cells were cultured using complete medium (DMEM/F12+12% fetal bovine serum+1% penicillin-streptomycin) in a cell culture incubator at 37°C with 5% CO2 until cells grew stably. Aβ25-35 were added to the medium of SH-SY5Y cells to mimic damaged neurons in Alzheimer’s disease. The cell experiments were divided into 6 groups as Control, Aβ, RES, LMC, LMC-RES, LMC-RES+ML385.
Animal Experiments
Animal Model
5xFAD mice were purchased from Beijing Huafukang Biotechnology Co. Genotype was identified from the tail-end DNA of the offspring mice by PCR according to the Jackson Laboratory method (The primers used are as follows ). The steps for gene identification were as follows: 1 cm of tissue was taken from the tail end of mice. DNA was extracted by alkaline lysis. PCR amplification was performed according to the BeyoFusion™ PCR Master Mix (2X) reaction system. Genotypes of mice were directly distinguished based on the differences in agarose gel electrophoresis bands. Mice genotyped as hemizygous were identified as 5xFAD mice. All experiments were conducted in accordance with the NIH Guide for the care and use of laboratory animals and approved by the Animal Care and Use Committee of Jinzhou Medical University. Mice were housed in the SPF Laboratory of Jinzhou Medical University. 5xFAD mice produce Aβ-42 almost exclusively and rapidly accumulate in the brain. After 6 months of age, the mice were administered the drug by tail vein injection for 8 weeks. Behavioral experiments and other experiments were performed. The animal experiments were divided into 5 groups, for Control, Aβ, RES, LMC, LMC-RES.
Table 1 Protocol Primers
Behavioral Experiments
Water maze trial: The experiment was performed after treating the mice for 8 weeks. Measurements were performed in a 1.2 m diameter water maze. During the first 5 days, mice were trained at random locations in 4 quadrants within the maze. On the 6th day, the platform was taken away and each mouse was placed in a quadrant away from the platform and allowed to roam freely for 60s. The distance and time taken by each mouse to reach the platform position were recorded, as was the number of times each mouse crossed the original platform area. The distance and time that each mouse reached the platform and the number of times it passed through the platform were recorded.
Nesting experiment: Different groups of mice were moved to the cage, and 6 sheets of paper (6 × 6 cm2) were added. The mice were allowed to move randomly and their nesting behavior was recorded daily by taking pictures and calculating scores.
Aβ Concentration Determination
Thioflavine T Experiment
Aβ monomer solution was diluted to 20uM and mixed with certain concentrations of RES, LMC and LMC-RES solutions. Thioflavine T(THT) was then added and incubated at 37°C. The fluorescence signal intensity at 450 nm excitation wavelength and 485 nm emission wavelength was recorded at four time points of 0, 24, 48 and 72h.
ELISA Kit
Mouse Aβ1-42 ELISA kit was used to detect the content of Aβ in brain of mice.
Statistical Analysis
All data are reported as mean ± standard deviation. Comparisons between groups were made using univariate ANOVA and the Kruskal–Wallis test. The Mann–Whitney U-test was used to compare the two groups. Statistical significance was considered when the P value was less than 0.05.
Results and Discussion
Synthesis and Characterization of LMC-RES Nanoparticles
In order to synthesize hollow nanoparticles, SiO2 is used as templates. MC were prepared using the sol-gel method. Lactoferrin was freely adsorbed onto MC and dried to obtain LMC. The TEM results showed that both SiO2 () and LMC () have good dispersion, with diameters of approximately 90 and 120 nm, respectively. The DLS results in further confirmed that the particle sizes of SiO2 and LMC are approximately 90 and 120 nm, respectively. These results confirmed the successful synthesis of the carrier material, and the regular hollow structure of LMC is suitable for loading a large quantity of drugs. As shown in , the zeta potential of MC and LMC are −51.3 ± 2.85 mV and −44.0 ± 2.32 mV, the increased potential of LMC indicates that lactoferrin is successfully encapsulated on the surface. The LMC BCA assay result shows a lactoferrin content of 1.46 ± 0.121 mg, which further verified this point ().
Figure 1 Characterization of Nanoparticles. (A) TEM images of SiO2 (i) and LMC (ii). (B) Distribution of particle size on SiO2 and LMC in PBS (pH 7.2). (C) Zeta potential of MC and LMC in PBS (pH 7.2). (D) Lactoferrin content in LMC. (E) Elemental distribution energy spectrum of MC. (F) The DSC patterns of LMC, LMC-RES, PM-LMC-RES and RES. (G) The PXRD analysis of LMC, LMC-RES, PM-LMC-RES and RES. (H) Drug release profiles of MC-RES, LMC-RES and RES at pH 7.2. (I) Drug release profiles of MC-RES, LMC-RES and RES at pH 5.4. (J) The plasma concentration-time curve of MC-RES, LMC-RES, and RES. (K and L) Hemolysis test of MC and LMC. All data are expressed as mean ± SD (n = 3).
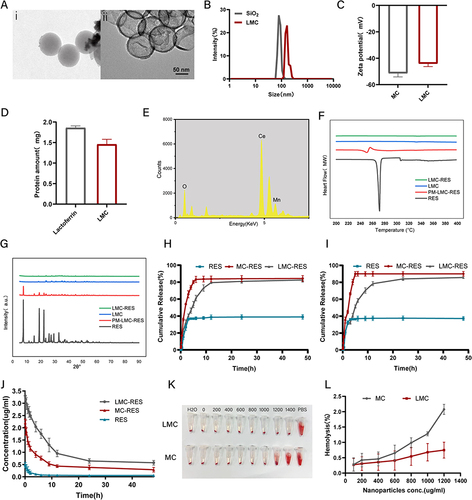
The SDS gel electrophoresis also provides direct evidence for the successful encapsulation of lactoferrin on the MC surface (Figure S1). The EDS results reveal the presence of cerium and manganese in MC, which again confirmed the successful synthesis of MC (). We used X-ray photoelectron spectroscopy (XPS) to analyze the valence of the synthesized nanoparticles, and the results showed that the ratio of Ce (III) to Ce (IV) was 1:3, which proved that our synthesized cerium nanoparticles were mainly dominated by Ce (IV), which proved that the LMC nanoparticles had good antioxidant ability (Supplementary Material 1 and Figure S2).
Currently, the application of most drugs such as RES is greatly hindered by their poor stability, low bioavailability, and difficulty in crossing the BBB.Citation28 In our study, LMC-RES, this drug delivery system allowed RES to exist in an amorphous form owing to its nanoscale spatial confinement effect, thus improving its aqueous solubility and dissolution rate. The drug load showed 39.8% ± 3.65 for RES as a model drug. The encapsulation efficiency was 66.7% ± 10.4. DSC and XRD were used to investigate the presence of RES in LMC-RES. The DSC curves show a melting point of 272°C for RES and the physical mixture (PM), indicating that RES is a crystalline drug. The DSC curve for LMC is smooth, which means that LMC have no phase transition process and they are in a noncrystalline state. In the DSC curve of LMC-RES, the characteristic peak of RES disappears, which indicates that RES in the nanoscale channel is amorphous (). These results were further confirmed by PXRD analysis. The RES and the PM show characteristic diffraction peaks at 6.6, 13.3, 16.4, 19.3, 22.4, 25.3, and 28.3°. In contrast, LMC and LMC-RES show no characteristic diffraction peaks (Supplementary Material 1 and Figure 1G). All the above results indicate that the amorphous form contributes to the increased aqueous solubility of RES, as confirmed by drug release studies. As shown in and , in the release medium at pH 7.2, the release of RES is only 38.9 ± 2.62% at 48 h. MC-RES show a rapid release of 83.2 ± 3.59% at 6 h, indicating that MC significantly increase the rate of dissolution of RES. In contrast, LMC-RES only reach 80.9 ± 2.25% in 24 h. The release behavior of RES in LMC-RES exhibits a slow release effect. This suggests that the encapsulation of lactoferrin effectively modulates the release rate of RES, which is advantageous for improving drug bioavailability. The presence of inflammation in AD and the pH isoelectric point of Aβ in the lesioned region of about 5.0 have been reported in the literature.Citation29–32 Therefore, we also inspected the release behavior of drugs in an in vitro simulated microenvironment. The release rate of RES after 48 h was 37.1% in a release medium at pH 5.4. The release rate of both MC-RES and LMC-RES was faster than that at pH 7.2, indicating that the vector had pH-sensitive release properties, which could facilitate drug utilization and therapeutic efficacy. The results of pharmacokinetic experiments support this conclusion. As displayed in , the t1/2 values for RES, MC-RES, and LMC-RES are 0.967 ± 0.491 h, 2.52 ± 1.29 h, and 7.50 ± 1.55 h, respectively. The AUC0-t of LMC-RES (24.6 ± 0.905 mg/L*h) is 10-fold higher than that of free RES (2.40 ± 0.558 mg/L*h), suggesting that LMC significantly improve the bioavailability of RES (Supplementary Material 2).
The cytotoxicity assays for MC and LMC are depicted in Figure S3. The results of CCK-8 test indicate that LMC have a good biosafety profile. This is supported by the results of the hemolysis assay. LMC show no significant hemolysis at 1200 mg/mL (0.750%), whereas MC exhibit a slight tendency toward hemolysis at the same concentration (2.08%) (Supplementary Material 3 and and ). In addition, after 8 weeks of RES, LMC, and LMC-RES treatments, the HE staining results reveal that no significant damage occurred in the vital organs of the mice (Supplementary Material 13 and Figure S4). All the above experimental results prove that LMC have no significant toxic side effects on mice.
LMC-RES Inhibit Oxidative Stress in SH-SY5Y Cells Through Nrf-2/HO-1 Signaling Pathway
We verified whether LMC can enter neurons through endothelial cells by transwell experiments. The transwell experiments show a higher-intensity green signal in the lower luminal SH-SY5Y receptor cells in the LMC group (Supplementary Material 4). The fluorescence intensity of the LMC group is 3–4 times higher than that of the MC group (Supplementary Material 5 and ). This indicates that LMC can penetrate the BBB and exert therapeutic effects.
Figure 2 LMC-RES inhibit oxidative stress in SH-SY5Y cells. (A) Schematic diagram of Transwell mimicking the BBB in vitro. (B and C) Uptake of LMC and MC by SH-SY5Y cells and quantitative analysis. (D) CCK-8 assay of Aβ concentration. (E) Fluorescence images of DCFH-DA probes in different groups of SH-SY5Y cells. (F) Quantitative analysis of ROS fluorescence in different groups. (G–I) MDA and SOD concentrations and GSH activity of SH-SY5Y cells in different groups. (J) Fluorescence images of HO-1 in different groups of SH-SY5Y cells. (K) RT-PCR of Nrf2, HO-1 in different groups of SH-SY5Y cells. All data are expressed as mean ± SD (n = 3). *P < 0.05, **P < 0.01, ***P < 0.001.
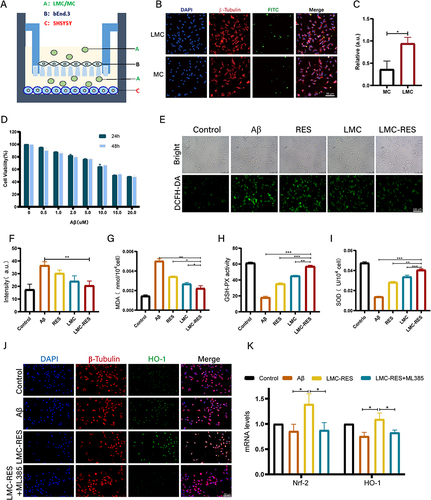
The oxidative stress response maintains a dynamic oxidative homeostasis in the body by scavenging excess ROS. ROS abnormalities affect the mitochondria, cellular enzymes, and proteins in the brain, thereby reducing the activity of antioxidant enzymes.Citation33 The accumulation of Aβ in the brain is a key initial event in the pathogenesis of AD, which leads to the production of large amounts of ROS.Citation34 To elucidate the antioxidant effect of LMC-RES after AD injury, 10 μM of Aβ peptide solution was added into SH-SY5Y cells (Supplementary Material 6 and ). We verified the formation of Aβ oligomers by TEM (Supplementary Material 7 and Figure S5). After different treatments, the oxidative stress levels of each group were measured using a DCFH-DA fluorescence probe and an oxidative stress kit. The results of DCFH-DA probe show that the ROS fluorescence signal in the Aβ group is 2.2 times higher than that in the control group. The fluorescence signals in the RES, MC-RES, and LMC-RES groups gradually decrease after treatment. Among them, the fluorescence signal intensity of the LMC-RES group, which is 0.57 times that of the Aβ group ( and ), decreases the most. The results of the oxidative stress assay also demonstrate the antioxidant capacity of LMC-RES. The MDA level in the cells of the Aβ group is significantly higher (approximately 2.6-fold greater) than that of the LMC-RES group (). The GSH and SOD levels are the lowest in the Aβ group and highest in the LMC-RES group, namely, 3.2-fold and 2.9-fold higher than those in the Aβ group, respectively ( and ). To further investigate the antioxidant activity of LMC-RES, we used ML385 (a specific inhibitor of Nrf2) to interfere with this effect. The results of the kits reveal that the levels of MDA, SOD, and GSH in the ML385-treated cells are 2, 0.46, and 0.43 times higher than those in the LMC-RES group, respectively. These results indicate that the antioxidant capacity of LMC-RES is significantly inhibited by ML385 (Supplementary Material 8 and Figure S6).
As an important component of the endogenous antioxidant pathway, Nrf2 plays a key role in many oxidative stress-related diseases. Under oxidative stress conditions due to the overproduction of ROS, Nrf2 is isolated from Keap1 and translocated to the nucleus, triggering the expression of downstream antioxidant enzymes such as HO-1, SOD, CAT, and NQO1.Citation35 Immunofluorescence results showed that the expression level of Nrf-2 tended to increase after RES, LMC and LMC-RES treatments. The LMC-RES group expressed the most, approximately 3.16-fold more than the Aβ group (Figures S7 and S8). To further investigate the role of Nrf2/HO-1 in the antioxidant activity of LMC-RES, we used ML385 (a specific inhibitor of Nrf2) to interfere with this pathway. We examined the expression levels of Nrf2 and HO-1 by immunofluorescence and RT-PCR. The immunofluorescence results show that the fluorescence signal intensity of HO-1 was significantly higher in the LMC-RES group compared with the Aβ group. After the addition of ML385 intervention, the fluorescence signal intensity of HO-1 in the LMC-RES group was significantly reduced by 5-fold ( and S9). RT-PCR results show that the mRNA expression levels of Nrf2 and HO-1 were substantially increased in the LMC-RES group compared to the Aβ group. After ML385 treatment, the mRNA expression levels of Nrf2 and HO-1 were significantly reduced by 1.5-fold and 1.2-fold (Supplementary Material 9 and ). The above results suggest that LMC-RES alleviate the oxidative stress generated by Aβ induction through the Nrf-2/HO-1 pathway.
The Ability of LMC to Penetrate the BBB in AD Mice
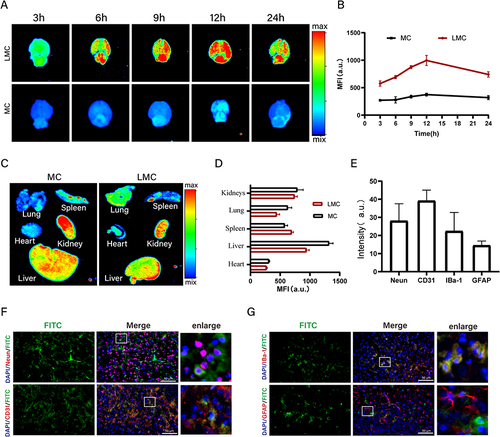
Drug delivery to the CNS is limited by the BBB.Citation36 Various receptors, such as transferrin, lipoprotein, insulin, and acetylcholine receptors, on the BBB help molecules such as proteins, peptides, and antibodies cross the BBB.Citation26 Lactoferrin acts as a ligand that binds to the Lf15 receptor on the BBB and crosses it through receptor-mediated transcytosis. Therefore, it is often used as a tool for nanoparticles to cross the BBB.Citation25,Citation37 The in vivo imaging results reveal that the fluorescence intensity of the LMC group reaches its highest at 12 h, which is 2.6 times higher than that of the MC group (Supplementary Material 10 and and ). This indicates that LMC can penetrate the BBB and exert therapeutic effects. The in vivo results for each organ show that the fluorescence intensities of the spleen and heart are weaker than those of the liver. The fluorescence intensity ratio between the liver and brain further explains the ability of LMC to cross the BBB ( and ). In addition, we performed immunofluorescence staining of brain tissue sections labeled with neuronal cells, vascular endothelial cells, microglia, and astrocytes to determine which cells could take up LMC. The results demonstrate that LMC can be taken up by neurons (Supplementary Material 11 and ). Based on the above experiments, LMC not only cross the BBB to aggregate at the site of brain injury but also act precisely on neurons and microglia in the brain.
Figure 3 The ability of LMC to traverse the BBB in AD mice. (A and B) Fluorescence imaging and quantitative analysis of brain at different time points after tail vein injection of FITC-labeled LMC and MC. (C and D) Fluorescence imaging and quantitative analysis of lung, heart, liver, spleen, and kidney 12 h after tail vein injection of FITC-labeled LMC and MC. (E) Fluorescence quantification in neurons, vascular endothelial cells, microglia, and astrocytes 12 h after tail vein injection of FITC-labeled LMC and MC. (F and G) Fluorescence imaging in neurons, vascular endothelial cells, microglia, and astrocytes 12 h after tail vein injection of FITC-labeled LMC and MC (Enlarged image in white box on the right). All data are expressed as mean ± SD (n = 3).
LMC-RES Inhibit Oxidative Stress in AD Mice Through Nrf-2/HO-1 Signaling Pathway
We assessed the ability of LMC-RES to inhibit oxidative stress in AD mice. As depicted in , the highest MDA content is in the mice with AD, and the MDA content gradually decreases in the RES, LMC, and LMC-RES groups. The most significant decrease is in the LMC-RES group, which is only 0.42 times that of the AD group. Compared with the AD group, the GSH activity and SOD concentration are significantly higher in the LMC-RES group, which are 2.6 and 1.8 times higher than those in the AD group (Supplementary Material 8). These results indicate the strong antioxidant capacity of LMC-RES. The antioxidant ability of LMC-RES was further verified using CAT fluorescence staining. It was found that the expression of CAT in the brain of mice with AD is significantly lower than that of the control group, while the expression of CAT in the RES, LMC, and LMC-RES groups gradually increases, specifically, 1.9, 3.3, and 4.2 times greater than that in the AD group. This can be considered as the most significant increase in the LMC-RES group, which also proves the optimal antioxidant effect of LMC-RES ( and ). These results again prove that LMC-RES can scavenge ROS and have a strong antioxidant capacity.
Figure 4 LMC-RES inhibit oxidative stress in AD mice. (A–C) MDA and SOD concentrations and GSH activity in different groups of AD mice. (D) Quantitative analysis of peroxidase in different groups of brain tissue. (E) Fluorescence images of catalase in different groups of brain tissues. (F) Mechanistic pathways of ROS action. (G) Fluorescence images of Nrf2 in different groups of brain tissues. (H) Quantitative analysis of Nrf2 fluorescence in different groups of brain tissues. All data are expressed as mean ± SD (n = 3). *P < 0.05, **P < 0.01, ***P < 0.001, ****P < 0.0001.
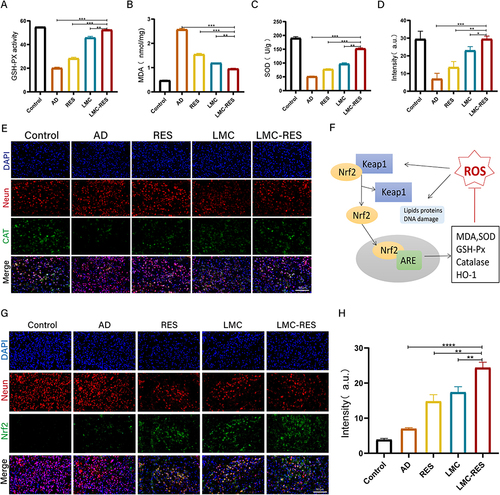
In diseased states with low levels of Nrf2 and antioxidant enzymes, the brain is more susceptible to ROS damage than other organs, causing progressive and irreversible damage.Citation38 Nrf2 deficiency exacerbates cognitive deficits in mice with AD.Citation39 The in vivo antioxidant mechanism of action is shown in . To explore the mechanism by which LMC-RES attenuate oxidative stress, we assessed the expressions of Nrf-2/HO-1 in the brain tissues of mice with AD using immunofluorescence. The immunofluorescence results indicate that the Nrf-2 expression level was low fluorescence signal intensity in the AD group and gradually increased in the RES, LMC and LMC-RES groups. The increase in fluorescence signal intensity was most pronounced in the LMC-RES group, with an approximately 3.49-fold decrease (Supplementary Material 12 and and ). The above results suggest that LMC-RES attenuated oxidative stress in AD mice via the Nrf-2/HO-1 pathway.
Inhibition of Aβ Aggregation and Neuronal Exacerbation of LMC-RES
The increase in ROS accelerates Aβ aggregation and the production of Aβ plaques is a major pathological feature of patients with AD.Citation40 It has been verified that inhibition aggregation of Aβ can help to slow down the development of AD.Citation41 We used immunofluorescence, THT staining, ELISA kits, and Nissl staining to investigate the effects of LMC-RES on Aβ and neurons. The Aβ fluorescence images show that Aβ deposition is most severe in the cortex and hippocampal regions in the AD group (). But the Aβ deposition is reduced in the RES, LMC, and LMC-RES groups, with the most pronounced reduction in the LMC-RES group. The effect of LMC-RES on Aβ aggregation was further verified by THT staining. The results show that the fluorescence intensity of the Aβ group increases with time, which indicates that the Aβ aggregation phenomenon becomes more severe with time. The fluorescence intensity of the RES, LMC, and LMC-RES groups show a decreasing trend over time. The most significant change is observed in the LMC-RES group. The fluorescence intensity of the LMC-RES group is only 0.58 times that of the AD group at 72 h (). These data provide good evidence that RES, LMC, and LMC-RES have certain inhibitory effects on Aβ aggregation, and the effect of LMC-RES is the most obvious. ELISA kits were used to further validate the clearance of Aβ by LMC-RES. As displayed in , the amount of Aβ in the brain tissue is 155.5 ± 4.63 pg/mL in the AD group but is smaller in the RES, LMC, and LMC-RES groups. The amount of Aβ in the LMC-RES group is approximately 111.9 ± 6.09 pg/mL, which is the most significant decrease relative to that in the AD group. All these experimental results effectively prove that RES, LMC, and LMC-RES have some inhibitory effects on Aβ, and LMC-RES are more advantageous in terms of the inhibitory effect.
Figure 5 LMC-RES inhibits Aβ aggregation and neuronal exacerbation. (A) Fluorescence images of Aβ in hippocampus and cortex of different groups of mice. (B) Analysis of THT fluorescence intensity in different groups. (C) ELISA kits of Aβ content in the brain tissue of different groups of mice. (D and E) Fluorescence images and quantitative analysis of neurons in brain slices from different groups of mice. (F) Nissl staining of the cortex and hippocampus of different groups of mice. All data are expressed as mean ± SD (n = 3). *P < 0.05, **P < 0.01, ***P < 0.001.
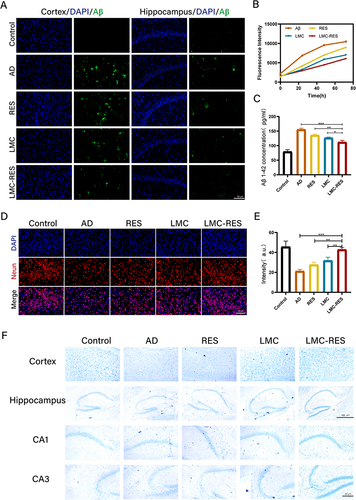
Neuronal damage is an important pathological process in degenerative neurological diseases. The changes in the number of neurons were examined using immunofluorescence. The fluorescence results reveal that the number of neurons in the cortical region of the brain is significantly lower in the mice with AD than in the control group. The number of neurons in the cortical region is improved to some extent in the RES, LMC, and LMC-RES groups. Compared with the AD group, the density of neurons in the LMC-RES group is significantly increased by approximately 1-fold ( and ). The Nissl staining results show an increase in Nissl vesicles in the RES, LMC, and LMC-RES groups relative to those in the AD group. The most pronounced changes are observed in the LMC-RES group (Supplementary Material 13 and ). All these results indicate that LMC-RES have not only a suppressive effect on Aβ but also a facilitative effect on neuronal recovery.
Cognitive Improvement of LMC-RES in AD Mice
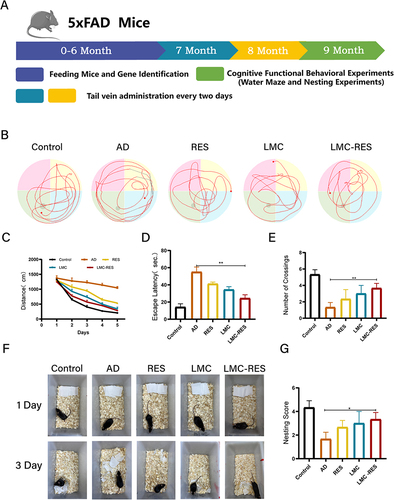
After 8 weeks of administration, we assessed the spatial cognitive ability and memory capacity of the model mice using the Morris water maze (). Compared with normal mice, mice with AD show significant deficits in spatial learning, memory, and cognitive abilities. As displayed in , the swimming paths of the mice with AD are evenly dispersed in the four quadrants, whereas those of the mice in the RES, LMC, and LMC-RES groups are relatively concentrated in the target area. The results in show that the distance to the platform is shortened to different degrees in the RES, LMC, and LMC-RES groups compared to that in the AD group. The distance shortening is most pronounced in the LMC-RES group, which is 3.7 times that in the AD group. In addition, the escape latency is significantly reduced in the RES, LMC, and LMC-RES groups and is lower in the LMC-RES group than in the AD group (). After platform removal, the LMC-RES group exhibits a significantly higher platform crossover than the AD group (). Nesting experiments further validated the therapeutic effects of LMC-RES. Owing to cognitive deficits, the mice with AD were unable to complete nesting and had lower nesting scores than the normal group. In contrast, all mice in the RES, LMC, and LMC-RES groups showed significantly improved nesting abilities, with the LMC-RES group showing the most significant improvement ( and ).
Figure 6 Assessment of treatment efficacy in AD mice. (A) Genetic identification and dosing schedule of AD mice. (B) Swimming trajectories of different groups of mice and the number of times they crossed the platform. (C) The distance required to reach the platform area for different groups of mice. (D) The time taken by different groups of mice to reach the platform area. (E) The number of crossings with the platform in different groups of mice. (F) Nesting behavior of different groups of mice. (G) Nesting function scores of mice in different groups. All data are expressed as mean ± SD (n = 3). *P < 0.05, **P < 0.01.
Conclusion
We prepared lactoferrin-functionalized manganese-doped CeO2 hollow nanospheres capable of carrying RES across the BBB. The strong antioxidant capacity of LMC-RES was demonstrated in vitro and in vivo experiments. It could reduce ROS, protect neurons, and improve the cognitive function of AD mice. Overall, this study provides a new therapeutic approach for AD with great benefits for the treatment of neurodegenerative diseases.
Institutional Review Board Statement
The animal research protocol was approved by the Laboratory Animal Ethics Committee of Jinzhou Medical University.
Disclosure
The authors report no conflicts of interest in this work.
Acknowledgments
This work was supported by Liaoning Revitalization Talents Program (NO. XLYC2002037) and Natural Science Foundation of Liaoning Province (NO. 2022-MS-390).
References
- Liu R, Yang J, Liu L, et al. An “Amyloid-β Cleaner” for the treatment of Alzheimer’s disease by normalizing microglial dysfunction. Adv Sci. 2020;7(2):1901555. doi:10.1002/advs.201901555
- Sun J, Wei C, Liu Y, et al. Progressive release of mesoporous nano-selenium delivery system for the multi-channel synergistic treatment of Alzheimer’s disease. Biomaterials. 2019;197:417–431. doi:10.1016/j.biomaterials.2018.12.027
- Butterfield DA, Boyd-Kimball D. Oxidative stress, Amyloid-β peptide, and altered key molecular pathways in the pathogenesis and progression of Alzheimer’s disease. J Alzheimers Dis. 2018;62(3):1345–1367. doi:10.3233/JAD-170543
- Bai R, Guo J, Ye XY, Xie Y, Xie T. Oxidative stress: the core pathogenesis and mechanism of Alzheimer’s disease. Ageing Res Rev. 2022;77:101619. doi:10.1016/j.arr.2022.101619
- Ionescu-Tucker A, Cotman CW. Emerging roles of oxidative stress in brain aging and Alzheimer’s disease. Neurobiol Aging. 2021;107:86–95. doi:10.1016/j.neurobiolaging.2021.07.014
- Zhang W, Feng C, Jiang H. Novel target for treating Alzheimer’s diseases: crosstalk between the Nrf2 pathway and autophagy. Ageing Res Rev. 2021;65:101207. doi:10.1016/j.arr.2020.101207
- Zhong G, Long H, Zhou T, et al. Blood-brain barrier Permeable nanoparticles for Alzheimer’s disease treatment by selective mitophagy of microglia. Biomaterials. 2022;288:121690. doi:10.1016/j.biomaterials.2022.121690
- Furtado D, Björnmalm M, Ayton S, Bush AI, Kempe K, Caruso F. Overcoming the blood-brain barrier: the role of nanomaterials in treating neurological diseases. Adv Mater. 2018;30(46):e1801362. doi:10.1002/adma.201801362
- Wong KH, Riaz MK, Xie Y, et al. Review of current strategies for delivering alzheimer’s disease drugs across the blood-brain barrier. Int J Mol Sci. 2019;20(2):381. doi:10.3390/ijms20020381
- Zhang Q, Jeppesen DK, Higginbotham JN, et al. Supermeres are functional extracellular nanoparticles replete with disease biomarkers and therapeutic targets. Nat Cell Biol. 2021;23(12):1240–1254. doi:10.1038/s41556-021-00805-8
- Bao Q, Hu P, Xu Y, et al. Simultaneous blood-brain barrier crossing and protection for stroke treatment based on edaravone-loaded ceria nanoparticles. ACS Nano. 2018;12(7):6794–6805. doi:10.1021/acsnano.8b01994
- Naz S, Beach J, Heckert B, et al. Cerium oxide nanoparticles: a ‘radical’ approach to neurodegenerative disease treatment. Nanomedicine. 2017;12(5):545–553. doi:10.2217/nnm-2016-0399
- Li X, Han Z, Wang T, et al. Cerium oxide nanoparticles with antioxidative neurorestoration for ischemic stroke. Biomaterials. 2022;291:121904. doi:10.1016/j.biomaterials.2022.121904
- Ge K, Mu Y, Liu M, et al. Gold nanorods with spatial separation of CeO(2) deposition for plasmonic-enhanced antioxidant stress and photothermal therapy of Alzheimer’s disease. ACS Appl Mater Interfaces. 2022;14(3):3662–3674. doi:10.1021/acsami.1c17861
- Zhang J, Cao Y, Wang CA, Ran R. Design and preparation of MnO2/CeO2-MnO2 double-shelled binary oxide hollow spheres and their application in CO oxidation. ACS Appl Mater Interfaces. 2016;8(13):8670–8677. doi:10.1021/acsami.6b00002
- Atif M, Iqbal S, Fakhar-E-Alam M, et al. Manganese-doped cerium oxide nanocomposite as a therapeutic agent for MCF-7 adenocarcinoma cell line. Saudi J Biol Sci. 2021;28(2):1233–1238. doi:10.1016/j.sjbs.2020.12.006
- Dai Y, Wang X, Zhu X, et al. Electrochemical assays for determination of H(2)O(2) and prostate-specific antigen based on a nanocomposite consisting of CeO(2) nanoparticle-decorated MnO(2) nanospheres. Mikrochim Acta. 2020;187(8):428. doi:10.1007/s00604-020-04403-7
- Kim J, Kim HY, Song SY, et al. Synergistic oxygen generation and reactive oxygen species scavenging by manganese Ferrite/Ceria Co-decorated nanoparticles for rheumatoid arthritis treatment. ACS Nano. 2019;13(3):3206–3217. doi:10.1021/acsnano.8b08785
- Gao J, Ma F, Wang X, Li G. Combination of dihydroartemisinin and resveratrol effectively inhibits cancer cell migration via regulation of the DLC1/TCTP/Cdc42 pathway. Food Funct. 2020;11(11):9573–9584. doi:10.1039/d0fo00996b
- Huang DD, Shi G, Jiang Y, Yao C, Zhu C. A review on the potential of Resveratrol in prevention and therapy of diabetes and diabetic complications. Biomed Pharmacother. 2020;125:109767. doi:10.1016/j.biopha.2019.109767
- Griñán-Ferré C, Bellver-Sanchis A, Izquierdo V, et al. The pleiotropic neuroprotective effects of resveratrol in cognitive decline and Alzheimer’s disease pathology: from antioxidant to epigenetic therapy. Ageing Res Rev. 2021;67:101271. doi:10.1016/j.arr.2021.101271
- Moussa C, Hebron M, Huang X, et al. Resveratrol regulates neuro-inflammation and induces adaptive immunity in Alzheimer’s disease. J Neuroinflammation. 2017;14(1):1. doi:10.1186/s12974-016-0779-0
- Zhang W, Mehta A, Tong Z, Esser L, Voelcker NH. Development of polymeric nanoparticles for blood-brain barrier transfer-strategies and challenges. Adv Sci. 2021;8(10):2003937. doi:10.1002/advs.202003937
- Rege SD, Geetha T, Griffin GD, Broderick TL, Babu JR. Neuroprotective effects of resveratrol in Alzheimer disease pathology. Front Aging Neurosci. 2014;6:218. doi:10.3389/fnagi.2014.00218
- Aslam Saifi M, Hirawat R, Godugu C. Lactoferrin-decorated cerium oxide nanoparticles prevent renal injury and fibrosis. Biol Trace Elem Res. 2022;201(4):1837–1845. doi:10.1007/s12011-022-03284-6
- Mazibuko Z, Choonara YE, Kumar P, et al. A review of the potential role of nano-enabled drug delivery technologies in amyotrophic lateral sclerosis: lessons learned from other neurodegenerative disorders. J Pharm Sci. 2015;104(4):1213–1229. doi:10.1002/jps.24322
- Tsatsanis A, McCorkindale AN, Wong BX, et al. The acute phase protein lactoferrin is a key feature of Alzheimer’s disease and predictor of Aβ burden through induction of APP amyloidogenic processing. Mol Psychiatry. 2021;26(10):5516–5531. doi:10.1038/s41380-021-01248-1
- Mota I, De lima LS, Santana BM, et al. Alzheimer’s disease: innovative therapeutic approaches based on peptides and nanoparticles. Neuroscientist. 2023;29(1):78–96. doi:10.1177/10738584211016409
- Yang X, Yang W, Xia X, et al. Intranasal delivery of BACE1 siRNA and rapamycin by dual targets modified nanoparticles for alzheimer’s disease therapy. Small. 2022;18(30):e2203182. doi:10.1002/smll.202203182
- Forloni G, Balducci C, Perry G, Avila J, Tabaton M, Zhu X. Alzheimer’s disease, oligomers, and inflammation. J Alzheimers Dis. 2018;62(3):1261–1276. doi:10.3233/JAD-170819
- Sung PS, Lin PY, Liu CH, Su HC, Tsai KJ. Neuroinflammation and neurogenesis in Alzheimer’s disease and potential therapeutic approaches. Int J Mol Sci. 2020;21(3):701. doi:10.3390/ijms21030701
- Zhou J, Yu W, Zhang M, Tian X, Li Y, Lü Y. Imbalance of microglial TLR4/TREM2 in LPS-Treated APP/PS1 transgenic mice: a potential link between alzheimer’s disease and systemic inflammation. Neurochem Res. 2019;44(5):1138–1151. doi:10.1007/s11064-019-02748-x
- Zhai Z, Huang Y, Zhang Y, Zhao L, Li W. Clinical research progress of small molecule compounds targeting Nrf2 for treating inflammation-related diseases. Antioxidants. 2022;11(8):1564. doi:10.3390/antiox11081564
- Dal Magro R, Vitali A, Fagioli S, et al. Oxidative stress boosts the uptake of cerium oxide nanoparticles by changing brain endothelium microvilli pattern. Antioxidants. 2021;10(2):266. doi:10.3390/antiox10020266
- Kahroba H, Ramezani B, Maadi H, Sadeghi MR, Jaberie H, Ramezani F. The role of Nrf2 in neural stem/progenitors cells: from maintaining stemness and self-renewal to promoting differentiation capability and facilitating therapeutic application in neurodegenerative disease. Ageing Res Rev. 2021;65:101211. doi:10.1016/j.arr.2020.101211
- Li Y, Li Y, Wang H, Liu R. Yb(3+), Er(3+) codoped cerium oxide upconversion nanoparticles enhanced the enzyme like catalytic activity and antioxidative activity for Parkinson’s Disease treatment. ACS Appl Mater Interfaces. 2021;13(12):13968–13977. doi:10.1021/acsami.1c00157
- Meng Q, Wang A, Hua H, et al. Intranasal delivery of Huperzine A to the brain using lactoferrin-conjugated N-trimethylated chitosan surface-modified PLGA nanoparticles for treatment of Alzheimer’s disease. Int J Nanomedicine. 2018;13:705–718. doi:10.2147/IJN.S151474
- Fão L, Mota SI, Rego AC. Shaping the Nrf2-ARE-related pathways in Alzheimer’s and Parkinson’s diseases. Ageing Res Rev. 2019;54:100942. doi:10.1016/j.arr.2019.100942
- Meng M, Zhang L, Ai D, Wu H, Peng W. β-Asarone ameliorates β-amyloid-induced neurotoxicity in PC12 cells by activating P13K/Akt/Nrf2 signaling pathway. Front Pharmacol. 2021;12:659955. doi:10.3389/fphar.2021.659955
- Ma T, Tan MS, Yu JT, Tan L. Resveratrol as a therapeutic agent for Alzheimer’s disease. Biomed Res Int. 2014;2014:350516. doi:10.1155/2014/350516
- Tiwari S, Atluri V, Kaushik A, Yndart A, Nair M. Alzheimer’s disease: pathogenesis, diagnostics, and therapeutics. Int J Nanomedicine. 2019;14:5541–5554. doi:10.2147/IJN.S200490