 ?Mathematical formulae have been encoded as MathML and are displayed in this HTML version using MathJax in order to improve their display. Uncheck the box to turn MathJax off. This feature requires Javascript. Click on a formula to zoom.
Abstract
Surface roughness and energy significantly influence protein adsorption on to biomaterials, which, in turn, controls select cellular adhesion to determine the success and longevity of an implant. To understand these relationships at a fundamental level, a model was originally proposed by Khang et al to correlate nanoscale surface properties (specifically, nanoscale roughness and energy) to protein adsorption, which explained the greater cellular responses on nanostructured surfaces commonly reported in the literature today. To test this model for different surfaces from what was previously used to develop that model, in this study we synthesized highly ordered poly(lactic-co-glycolic acid) surfaces of identical chemistry but altered nanoscale surface roughness and energy using poly(dimethylsiloxane) molds of polystyrene beads. Fibronectin and collagen type IV adsorption studies showed a linear adsorption behavior as the surface nanoroughness increased. This supported the general trends observed by Khang et al. However, when fitting such data to the mathematical model established by Khang et al, a strong correlation did not result. Thus, this study demonstrated that the equation proposed by Khang et al to predict protein adsorption should be modified to accommodate for additional nanoscale surface property contributions (ie, surface charge) to make the model more accurate. In summary, results from this study provided an important step in developing future mathematical models that can correlate surface properties (such as nanoscale roughness and surface energy) to initial protein adsorption events important to promote select cellular adhesion. These criteria are critical for the fundamental understanding of the now well-documented increased tissue growth on nanoscale materials.
Introduction
Upon the insertion of an implant inside the body, proteins adsorb on to the surface within the first couple of seconds, and these adsorbed proteins mediate cellular adhesion on to the implant surfaces.Citation1,Citation2 One of the most influential parameters controlling the adsorption of proteins centers on surface properties (such as roughness and energy) of an implant. By altering implant surface properties, it is possible to guide select protein adsorption, as well as control the quantity and conformation of the adsorbed proteins, allowing researchers to guide select cell adhesion on to the implant surfaces, potentially improving the success of the implant.Citation3 Some of the important parameters that control protein adsorption on to biomaterial surfaces are surface chemistry, roughness, wettability, and charge.Citation4–Citation7
Along this line, one of the most promising approaches to altering surface properties of biomaterials is decreasing the material surface feature size into the nanophase regime. When using a nanophase material, where at least one surface feature size is less than 100 nm, implant surface properties will change (ie, surface area, energy, topography, and charge).Citation8 In fact, researchers have been proposing the use of nanophase materials for a variety of tissue engineering applications, including for bone, cartilage, vascular, neural applications, and the bladder.Citation9 Cumulatively, there is plenty of evidence showing enhanced cellular functions on nanophase materials compared with their nanosmooth counterparts.Citation7 Specifically in orthopedics, some of the chemistries that demonstrate higher cellular adhesion and long-term cellular functions upon the creation of a nanophase topography are TiO2, Al2O3, hydroxyapatite, poly(lactic-co-glycolic acid) (PLGA), carbon nanotubes, and carbon nanofibers.Citation10,Citation11 Although the list can be expanded with various other surface chemistries and tissue types, the major reason for this enhancement in cellular functions has been correlated with the interaction of the adherent cells with the initially adsorbed proteins on to the biomaterial surface.Citation12,Citation13
As it is crucial to understand the effect of surface properties on protein adsorption experimentally,Citation14,Citation15 a simplified equation elucidating the influence of unique surface parameters (ie, chemistry, charge, micron/nanophase topography, wettability, and crystallinity) on protein adsorption was proposed by Khang et al.Citation16 However, the Khang et al equation has not been tested using other materials to date. Toward this goal, in this research we utilized that simplified Khang et al equation to model the influence of PLGA surface nanoroughness and energy on the protein adsorption events important for controlling select cell adhesion.Citation16 To investigate the efficacy of the proposed protein adsorption model, we synthesized PLGA surfaces with varying nanoscale topographies, while keeping the surface chemistry the same, and assessed collagen type IV and fibronectin adsorption on to these surfaces. The results provided significant clues into how one can develop improved mathematical models to correlate nanoscale surface roughness to initial protein adsorption events.
Materials and methods
PLGA film synthesis
The details of the process used to create PLGA nanoscale surface topographies are explained in a previous publication.Citation14 Briefly, 18 mm borosilicate glass coverslips (Thermo Fisher Scientific, Waltham, MA, USA) were cleaned by acetone and 70% ethanol (soaked in each liquid for 10 minutes and then sonicated for another 10 minutes) followed by rinsing with diH2O. A total of 300 μL of a 10 wt% solution of polystyrene (PS) beads 190 nm, 300 nm, or 400 nm in diameter (Bangs Laboratories, Fishers, IN, USA) were separately dispersed on to the coverslips and allowed to evaporate in ambient air. PS beads were secured to a 1 cm (height) × 18 mm diameter glass rod. Poly(dimethylsiloxane) (PDMS, Sylgard® 184 silicone elastomer, Dow Corning Corporation, Midland MI, USA) was mixed at 1:10 vol% (curing agentbase) and poured on to the glass rod/PS construct, before the bubbles were removed under vacuum (25 in Hg, for 20 minutes), and was cured at room temperature for 48 hours. PDMS molds were peeled and rinsed with chloroform to remove any residual PS beads from the PDMS surfaces. PLGA (50:50 wt:wt %, molecular weight 12–16 × 103 g, Polysciences, Inc., Warrington, PA, USA) was dissolved by sonicating at a ratio of 0.5 g PLGA to 8 mL chloroform and then poured on to the PDMS molds, allowing for evaporation of the chloroform to occur for 48 hours at room temperature. The PLGA films were then peeled and cut into 12 mm diameter disks. The control surfaces were created by dissolving PLGA in chloroform, before 300 μL of the solution was cast on to 12 mm coverslips, allowing chloroform to evaporate for 4 hours at room temperature.
Sample characterization
Atomic force microscopy (AFM) topographies of nano/submicron featured PLGA films were obtained in ambient air using a Digital Instruments DI-310 AFM (Santa Barbara, CA, USA). Tapping mode was used at 320 kHz with a scan rate of 0.5 Hz and 256 lines/scan. A scan area of 5 μm × 5 μm or 2 μm × 2 μm was investigated. The AFM tip had a radius of curvature less than 10 nm, a cone angle of 30°, and a cantilever force constant of roughly 40 N/m coated on the back with aluminum (DP15/Al BS, MikroMasch®, Nano World AG, Neuchâtel, Switzerland). Images were analyzed using Nanoscope 4.42 software (Digital Instruments). As was done by Khang et al,Citation16 the obtained root mean squared (RMS) roughness values were multiplied by an area factor SN (S = Sunit/Smeasured; Sunit = 2D surface area, and Smeasured = measured greater surface area due to increased roughness) to compensate for the incremental changes in surface area. In addition, and similar to Khang et al,Citation16 in this research RMSeffective was used as a new roughness factor (RMSeffective = RMSmeasured × SN).
A drop-shaped analysis system (DSA-10, Krüss GmbH, Hamburg, Germany) was used to complete the contact angle measurements. Static contact angles were obtained immediately after the deposition of 3 μL diH2O on to the sample under ambient conditions. Surface energy was calculated using Es = Elv × cosθ, where Es is the surface energy of PLGA, θ is the water contact angle, and Elv (surface energy between air and water) is 72.8 mJ/m2 at 20°C for pure water.
Protein adsorption
Samples were rinsed with phosphate-buffered saline and incubated for 1 hour with 1% bovine fibronectin (Sigma-Aldrich, St Louis, MO, USA) or 1% collagen type IV (Abcam plc, Cambridge, UK). Following this, sample surfaces were blocked by incubating in 1% bovine serum albumin (Sigma-Aldrich) for 1 hour, and then incubated with a 3:1,000 solution of rabbit antibovine fibronectin polyclonal antibody (Chemicon, EMD Millipore Corporation, Billerica, MA, USA) or rabbit antibovine collagen type IV polyclonal antibody (Abcam plc) in 1% bovine serum albumin. After washing with 0.05% Tween 20 (Sigma-Aldrich) in phosphate-buffered saline, a horseradish peroxidase conjugated secondary goat antirabbit IgG (H + L) (Bio-Rad Laboratories, Hercules, CA, USA) was added. Samples were tested for the horseradish peroxidase activity using an ABST kit (Vector Laboratories, Inc, Burlingame, CA, USA), according to the manufacturer’s instructions. Light absorbance measurements at 405 nm were completed using a spectrophotometer and associated software (SoftMax Pro 5, Molecular Devices LLC, Sunnyvale, CA, USA). The absorbance readings were normalized with the surface area of the samples obtained from AFM measurements and with the control sample without any imprinted topography.
Statistics
All experiments were run in triplicate and repeated at least three separate times. Results were analyzed for statistical significance using a Student’s t-test, where P < 0.05 was defined to assess the statistical significance. Linear regression analysis and 10% confidence intervals (shown with the pink shaded area on the graphs []) were determined using JMP® software (SAS Institute Inc, Cary, NC, USA) for statistical analysis.
Results
Experimental data
AFM images () showed that the spherical surface topography was effectively transferred to the PLGA surfaces. Interestingly, the line scan analysis (not shown) indicated that the lateral and vertical feature sizes were not similar. Although the lateral feature sizes were approximately (±5%) similar to the original PS bead size, the vertical feature sizes (shown in ) did not follow a similar pattern. PLGA surfaces created using 300 nm beads had higher vertical dimension than the ones with 400 nm dimension. In fact, the surfaces created using 350 nm PS beads had vertical feature sizes ~17× larger than the ones created using 190 nm beads. Furthermore, the surface free energy studies () showed that as the surface feature size increased, so did the hydrophobicity of the samples, with the exception of samples with the 18.9 nm feature size. Hydrophilicity was significantly different (P < 0.05) when comparing any two substrates of interest in this study. In this study, surface chemistry analysis was not conducted because it was shown in a previous publication that PLGA casting using PDMS molds had identical chemistries.Citation15
Table 1 Summary of polystyrene bead size and corresponding vertical surface feature dimension (obtained by atomic force microscopy height profiles) and effective root mean squared roughness (RMSeff) values
Figure 1 Atomic force microscopy images of the poly(lactic-co-glycolic acid) surfaces synthesized using a template covered with polystyrene nanobeads. The dimensions of the polystyrene nanobeads were: (A) 190 nm, (B) 300 nm, and (C) 400 nm. Spherical surface features were effectively transferred to the poly(lactic-co-glycolic acid) surfaces, and ordered surface features were observed.
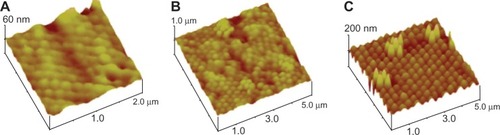
Figure 2 The effect of the change in the poly(lactic-co-glycolic acid) surface feature size on (A) surface energy (red) and water contact angles (blue), and (B) relative collagen type IV (blue or left) and fibronectin (red or right) adsorption. Surface energy and water contact angle results are significantly (P < 0.05) different between all data points. Values are mean ± standard error of the mean. *P < 0.05 compared with control surfaces.
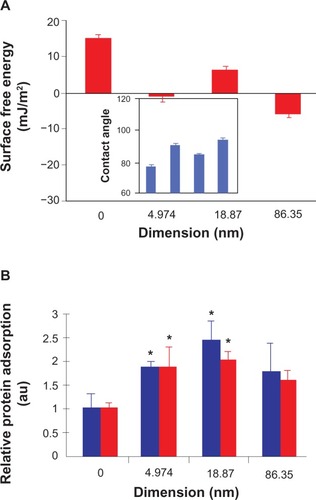
The results in this study showed that fibronectin and collagen type IV exhibited similar adsorption affinities on PLGA surfaces (). In fact, protein adsorption followed a γ distribution with regard to the surface feature size, with a maximum at 18.9 nm feature size. Surfaces with 4.9 nm and 18.9 nm features showed enhanced fibronectin and collagen type IV adsorption (P < 0.05) compared with the control surfaces.
Mathematical model
As mentioned in this study a previously derived protein adsorption model was used to understand the adsorption of collagen type IV and fibronectin on to PLGA surfaces with varying topographies and surface energy.Citation16 Firstly, RMSeffective and surface energy of the PLGA samples were correlated using a linear equation, as shown in . The relationship between RMSeffective (RMSeff) and surface energy (Es) can be formatted as shown in EquationEquation 1(1) :Citation16
Figure 3 Graphs showing the linear correlation between (A) RMSeff and surface energy, (B) RMSeff and collagen type IV adsorption, (C) RMSeff and fibronectin adsorption, (D) surface energy and collagen type IV adsorption, and (E) surface energy and fibronectin adsorption. Poly(lactic-co-glycolic acid) sample synthesized using a polystyrene template bead size of 190 nm is blue, 300 nm is black, 400 nm is green, and red is the control sample. EquationEquation 1(1) (Es[RMSeff] =ρ × RMSeff + Eo,s) was used to model RMSeff and surface energy interactions in , EquationEquation 3
(3) (Fadsortion[RMSeff] = A × RMSeff + β × Eo,s) was used to model surface nanoroughness and protein adsorption in , and EquationEquation 4
(4) (Fadsorption [Es]= [κ + β] × Es −κ × Eo,s) was used to model surface energy and protein adsorption in . In these equations ρ, α, β, A, and κ are coupling constants, where A = α + β × ρ and κ = α/ρ.
Abbreviations: Colladsorp, amount of adsorbed collagen; Eo,s, initial ground surface energy determined by chemical interactions but not nanoroughness; ES, surface energy; FNadsorp, amount of adsorbed fibronectin; RMSeff, effective root mean squared roughness.
![Figure 3 Graphs showing the linear correlation between (A) RMSeff and surface energy, (B) RMSeff and collagen type IV adsorption, (C) RMSeff and fibronectin adsorption, (D) surface energy and collagen type IV adsorption, and (E) surface energy and fibronectin adsorption. Poly(lactic-co-glycolic acid) sample synthesized using a polystyrene template bead size of 190 nm is blue, 300 nm is black, 400 nm is green, and red is the control sample. EquationEquation 1Es(RMSeff)=ρ×RMSeff+Eo,s(1) (Es[RMSeff] =ρ × RMSeff + Eo,s) was used to model RMSeff and surface energy interactions in Figure 3A, EquationEquation 3Fadsorption(RMSeff)=A×RMSeff+β×Eo,s(3) (Fadsortion[RMSeff] = A × RMSeff + β × Eo,s) was used to model surface nanoroughness and protein adsorption in Figure 3B and C, and EquationEquation 4Fadsorption=(κ+β)×Es−κ×Eo,s(4) (Fadsorption [Es]= [κ + β] × Es −κ × Eo,s) was used to model surface energy and protein adsorption in Figure 3D and E. In these equations ρ, α, β, A, and κ are coupling constants, where A = α + β × ρ and κ = α/ρ.Abbreviations: Colladsorp, amount of adsorbed collagen; Eo,s, initial ground surface energy determined by chemical interactions but not nanoroughness; ES, surface energy; FNadsorp, amount of adsorbed fibronectin; RMSeff, effective root mean squared roughness.](/cms/asset/08b39214-effb-41ae-be31-bdbf0a55bb6d/dijn_a_47286_f0003_c.jpg)
In this formula, Eo,s (ground surface energy) is a material property determined purely by chemical interactions between the surface and the interacting liquid for negligible surface roughness (not a function of nanoscale topography), and ρ is a coupling constant, which determines the extent of the influence of nanoscale topography on the surface energy of material. Line fitting the present experimental results gave ES = −0.47 × RMSeff + 8.92 (R2 = 0.46), where ρ = −0.47 and Eo,s = 8.92.
As previously stated surface nanophase topography and surface energy both affect protein adsorption on to biomaterial surfaces. If we ignore the other parameters and consider only these two parameters, the simplified formula for adsorption of a protein is:Citation16
where Fadsorptionis protein adsorption (normalized with AFM surface area), Es is surface energy of the material, and α and β are coupling constants correlating protein adsorption with surface nanophase roughness (α) and surface energy (β). When EquationEquations 1(1) and Equation2
(2) are coupled it is possible to define protein adsorption as a function of only RMS ff, as shown in EquationEquation 3
(3) :Citation16
Here, A and β are coupling constants for nanophase roughness and ground surface energy, respectively, where A = α + β × ρ. Coupling constant A indicates the contribution of nanophase surface roughness, and β indicates the contribution of ground surface energy on the protein adsorption on to a biomaterial surface. When the protein adsorption results in this study are fit linearly with RMSeff (), the derived equation for collagen type IV adsorption is Colladsorp = 0.02 × RMSeff + 1.52 (R2 = 0.22), and for fibronectin adsorption is FNadsorp = 0.01 × RMSeff + 1.47 (R2 = 0.13).
On the other hand when EquationEquations 1(1) and Equation3
(3) are combined it is possible to write the protein adsorption as a function of only surface energy, as shown in EquationEquation 4
(4) :Citation16
where κ = α/p is a coupling constant to correlate surface energy with protein adsorption. When the protein adsorption data are correlated with surface energy (), the obtained linear regression for the collagen type IV adsorption is Colladsorp = −0.03 × Es + 1.87 (R2 = 0.26), and for fibronectin adsorption it is FNadsorp = −0.03 × Es + 1.71 (R2 = 0.36). summarizes the coupling constants obtained by linear fitting the experimental results to the proposed protein adsorption model. As can be seen, the aforementioned equations that were developed by Khang et alCitation16 did not correlate well with the data from the present experiment, although the general trend of greater protein adsorption with surface roughness held true.
Table 2 Parameters obtained by line fitting the experimental values with the proposed protein adsorption model
Discussion
In this study we synthesized a model PLGA surface with varied nanofeature surface topographies, while keeping the chemistry of the surfaces the same. Our results are in accord with many previously published results that as the surface nanoroughness of PLGA is increased, fibronectin and collagen adsorption increases.Citation16,Citation13 A linear regression model developed by Khang et alCitation16 was tested to correlate protein adsorption with surface nanoroughness (RMSeff) and surface energy. Importantly, the proposed model could predict the adsorption of collagen type IV and fibronectin in terms of only surface nanoroughness.
Having said that, the R2 values for the linear regression developed by Khang et alCitation16 did not indicate a strong correlation. We did attempt other curve fit parameters (such as a quadratic polynomial fit); however, it was not mathematically possible to calculate the individual contribution of surface roughness (α) and surface energy (β) on protein adsorption. One of the possible reasons for this behavior could be the lack of enough data points to fit a curve. Alternative reasons for this behavior could be the fact that the proposed model does not take into account some of the important surface properties for the characterized PLGA materials (ie, surface charge and combined micron and nanosized surface topography). In the future, the proposed model will be revised, perhaps using a more generalized curve fitting approach, to take into account the effect of nanorough (but micron smooth) surfaces, as well as micron rough (but nanosmooth) surfaces on the adsorption of proteins. Alternatively, it is possible to add another parameter to model the surface charge on protein adsorption, where the control experiments can be completed using proteins with a net positive (lysozyme) and negative (albumin) charge (at a pH of 7.4).Citation17,Citation18 Most importantly, to increase applicability to medical devices, the model should be modified for the exposure of the arginine–glycine–aspartic acid peptide sequence containing proteins (ie, fibronectin, vitronectin, laminin, and collagen type I) to better assess the accuracy of the proposed equations to model cell attachment.
Conclusion
In this research, the effect of a nanophase topography and corresponding surface energy on fibronectin and collagen type IV adsorption was investigated using a model PLGA surface. A linear regression model developed by Khang et alCitation16 was used to correlate surface topography and wettability with protein adsorption. Although general trends of greater protein adsorption correlated to greater nanoscale roughness, correlation coefficients when fitting the Khang et alCitation16 equation were not strong. It is imperative to better understand the influence of each biomaterial surface property on select protein adsorption, where protein adsorption controls cellular adhesion and long-term cellular functions. The proposed linear regression-based protein adsorption model is one of the first steps to deriving a universal equation to fulfill this aim.
Acknowledgments
The authors would like to thank Northeastern University, Boston, MA, USA, for funding this research.
Disclosure
The authors report no conflicts of interest in this work.
References
- SharpeJRSammonsRLMarquisPMEffect of pH on protein adsorption to hydroxyapatite and tricalcium phosphate ceramicsBiomaterials19971864714769111950
- KiuHWebsterTJNanomedicine for implants: a review of studies and necessary experimental toolsBiomaterials200728235436921898921
- BalasundaramGWebsterTJA perspective on nanophase materials for orthopedic implant applicationsJ Mater Chem2006163837373745
- ScopellitiPEBorgonovoAIndrieriMThe effect of surface nanometre-scale morphology on protein adsorptionPLoS One20105719
- SinghAVVyasVPatilRQuantitative characterization of the influence of the nanoscale morphology of nanostructured surfaces on bacterial adhesion and biofilm formationPLoS One201169112
- WangKZhouCHongYZhangXA review of protein adsorption on bioceramicsInterface Focus20122325927723741605
- SofosFKarakasidisTELiakopoulosASurface wettability effects on flow in rough wall nanochannelsMicrofluid Nanofluid2012121–42531
- ParkGEWebsterTJA Review of nanotechnology for the development of better orthopedic implantsJ Biomed Nanotechnol2005111829
- ZhangLWebsterTJNanotechnology and nanomaterials: promises for improved tissue regenerationNano Today2009416680
- YaoCWebsterTJAnodization: a promising nano-modification technique of titanium implants for orthopedic applicationsJ Nanosci Nanotechno200669–1026822692
- MeirellesLAlbrektssonTKjellinPBone reaction to nano hydroxyapatite modified titanium implants placed in a gap-healing modelJ Biomed Mater Res A200887A362463118189300
- WebsterTJSchadlerLSSiegelRWBiziosRMechanisms of enhanced osteoblast adhesion on nanophase alumina involve vitronectinTissue Eng20017329130111429149
- MillerDCHaberstrohKMWebsterTJMechanism(s) of increased vascular cell adhesion on nanostructured poly(lactic-co-glycolic acid) filmsJ Biomed Mater Res A200573447648415880725
- CarpenterJKhangDWebsterTJNanometer polymer surface features: the influence on surface energy, protein adsorption and endothelial cell adhesionNanotechnology2008195050510319942760
- MillerDCHaberstrohKMWebsterTJPLGA nanometer surface features manipulate fibronectin interactions for improved vascular cell adhesionJ Biomed Mater Res A200781367868417187386
- KhangDKimSYLiu-SnyderPPalmoreGTDurbinSMWebsterTJEnhanced fibronectin adsorption on carbon nanotube/poly(carbonate) urethane: independent role of surface nano-roughness and associated surface energyBiomaterials200728324756476817706277
- GarcovichMZoccoMAGasbarriniAClinical use of albumin in hepatologyBlood Transfus20097426827720011638
- LiuGAmroNAPositioning protein molecules on surfaces: a nanoengineering approach to supramolecular chemistryProc Natl Acad Sci U S A20029985165517011959965