

Abstract
Background
Finding a suitable delivery system to improve the water solubility of hydrophobic drugs is a critical challenge in the development of effective formulations. In this study, we used A6K, a self-assembling surfactant-like peptide, as a carrier to encapsulate and deliver hydrophobic pyrene.
Methods
Pyrene was mixed with A6K by magnetic stirring to form a suspension. Confocal laser scanning microscopy, transmission electron microscopy, dynamic light scattering, atomic force microscopy, fluorescence, and cell uptake measurements were carried out to study the features and stability of the nanostructures, the state and content of pyrene, as well as the pyrene release profile.
Results
The suspension formed contained pyrene monomers trapped in the hydrophobic cores of the micellar nanofibers formed by A6K, as well as nanosized pyrene crystals wrapped up and stabilized by the nanofibers. The two different encapsulation methods greatly increased the concentration of pyrene in the suspension, and formation of pyrene crystals wrapped up by A6K nanofibers might be the major contributor to this effect. Furthermore, the suspension system could readily release and transfer pyrene into living cells.
Conclusion
A6K could be further exploited as a promising delivery system for hydrophobic drugs.
Supplementary data
Calibration curve for pyrene at higher concentrations in ethanol
Standard pyrene solutions in ethanol were prepared at concentrations ranging from 1×10⁻⁴ mM to 2×10⁻² mM. The fluorescence spectrum of each standard solution was measured to obtain its value at 374 nm. The parameters for measurement of fluorescence were set as follows: exciting wavelength 336 nm, scan speed 240 nm/min, excitation slit width 5 nm, emission slit width 5 nm, and photomultiplier tube voltage 400 V. The calibration curve was obtained as a concentration-versus-fluorescence plot (), from which the following equation could be obtained:
Calibration curve for pyrene at lower concentrations in phosphate-buffered saline
Standard pyrene solutions in phosphate-buffered saline (0.02 M) were prepared by diluting a stock pyrene solution (1 mM in ethanol) with phosphate-buffered saline, at concentrations ranging from 1×10⁻⁵ mM to 6×10⁻⁴ mM. The fluorescence spectrum of each standard solution was measured to obtain its value at 374 nm. Parameters for fluorescence measurement were set as follows: exciting wavelength 336 nm, scan speed 240 nm/min, excitation slit width 20 nm, emission slit width 10 nm, and photomultiplier tube voltage 400 V. The calibration curve was obtained as a concentration-versus-fluorescence plot (), according to which the following equation could be obtained:
Figure S1 Calibration curve for pyrene at higher concentrations in ethanol.
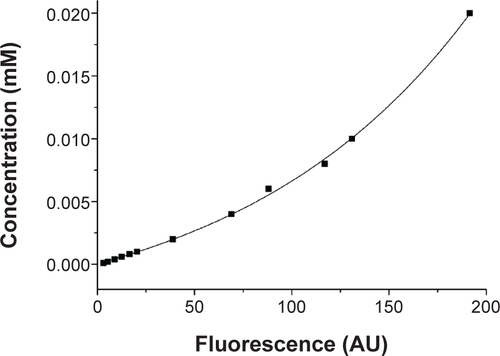
Figure S2 Calibration curve for pyrene at lower concentrations in phosphate-buffered saline.
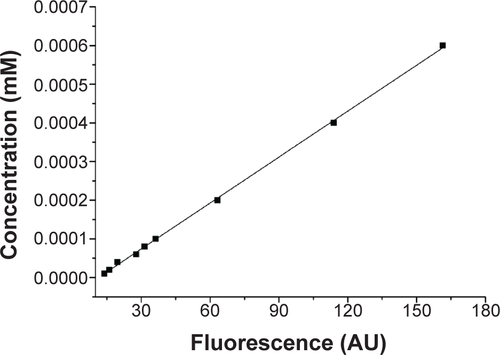
Figure S3 Fluorescent pyrene particles in the initial mixture of pyrene and A6K.
Notes: (A) Normal light, (B) fluorescence, and (C) merged image. Large pyrene particles could be seen in these images. Scale bar, 5 μm.
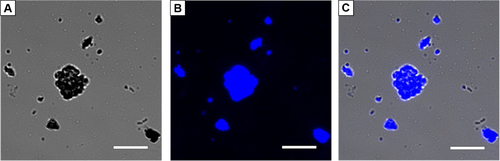
Figure S4 Transmission electron microscopic image of the initial mixture of pyrene and A6K. Large pyrene particles with an irregular shape can be seen in this image.
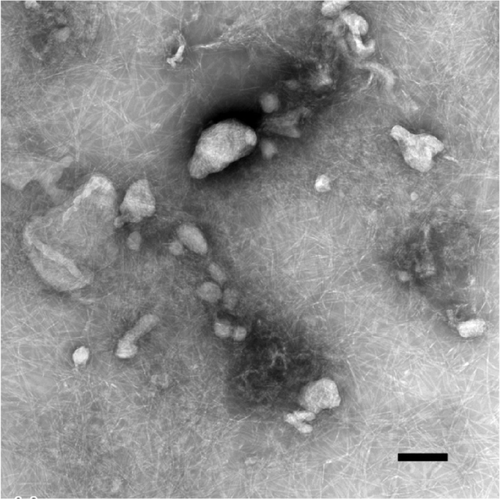
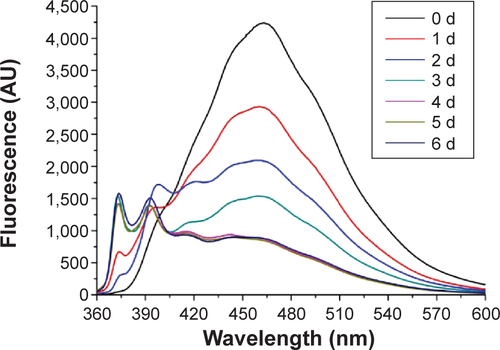
Figure S5 Fluorescence spectra for the pyrene-A6K mixture at different storage times. In the first 4 days, the fluorescence value between 440–500 nm dropped markedly, indicating the decreasing of pyrene eximers. After 4 days, the spectra reached an equilibrium state, indicating that a stable suspension had been obtained.
Acknowledgments
This work was financially supported by the National Natural Science Foundation of China (81000658 and 31100565).
Disclosure
The authors report no conflicts of interest in this work.