
 ?Mathematical formulae have been encoded as MathML and are displayed in this HTML version using MathJax in order to improve their display. Uncheck the box to turn MathJax off. This feature requires Javascript. Click on a formula to zoom.
Abstract
Schwann cells (SCs) are attractive seed cells in neural tissue engineering, but their application is limited by attenuated biological activities and impaired functions with aging. Therefore, it is important to explore an approach to enhance the viability and biological properties of SCs. In the present study, a magnetic composite made of magnetically responsive magnetic nanoparticles (MNPs) and a biodegradable chitosan–glycerophosphate polymer were prepared and characterized. It was further explored whether such magnetic nanocomposites via applied magnetic fields would regulate SC biological activities. The magnetization of the magnetic nanocomposite was measured by a vibrating sample magnetometer. The compositional characterization of the magnetic nanocomposite was examined by Fourier-transform infrared and X-ray diffraction. The tolerance of SCs to the magnetic fields was tested by flow-cytometry assay. The proliferation of cells was examined by a 5-ethynyl-2-deoxyuridine-labeling assay, a PrestoBlue assay, and a Live/Dead assay. Messenger ribonucleic acid of BDNF, GDNF, NT-3, and VEGF in SCs was assayed by quantitative real-time polymerase chain reaction. The amount of BDNF, GDNF, NT-3, and VEGF secreted from SCs was determined by enzyme-linked immunosorbent assay. It was found that magnetic nanocomposites containing 10% MNPs showed a cross-section diameter of 32.33±1.81 µm, porosity of 80.41%±0.72%, and magnetization of 5.691 emu/g at 8 kOe. The 10% MNP magnetic nanocomposites were able to support cell adhesion and spreading and further promote proliferation of SCs under magnetic field exposure. Interestingly, a magnetic field applied through the 10% MNP magnetic scaffold significantly increased the gene expression and protein secretion of BDNF, GDNF, NT-3, and VEGF. This work is the first stage in our understanding of how to precisely regulate the viability and biological properties of SCs in tissue-engineering grafts, which combined with additional molecular factors may lead to the development of new nerve grafts.
Introduction
In the peripheral nervous system, Schwann cells (SCs) are the main gliocyte type, and undergo dedifferentiation and proliferation in the distal injured segment after injury. They form Büngner bands at injury sites, which create comfortable milieus for axon regeneration and ensuing remyelination.Citation1 Multiple factors, including neurotrophic factors, hormones, and extracellular matrix protein, participate in this process.Citation2 Driven by these considerations, the combination of SCs with nerve scaffolds has been becoming a more and more attractive therapy to enhance nerve regeneration after nerve injuries.Citation3–Citation6 In these cases, a considerable number of SCs with enhanced cell viability and biological properties would be required. However, attenuated biological activities have been found in SC cultures, which significantly limit the efficiency of SCs in nerve-injury repair.Citation7 Therefore, it is important to explore an approach to enhance the viability and biological properties of SCs.
Magnetic fields (MFs) have been shown to be safe and effective in regulating cell biological properties.Citation8–Citation10 Recently, magnetic composites via applied MFs have been shown to further improve the biological properties of cells. It has been shown that a magnetic composite via MF is capable of stimulating endothelial cell proliferation, promoting organization of endothelial cells into capillary-like structures,Citation11 facilitating organization of cardiac cells into myocardial tissue in vitro,Citation12 and enhancing osteogenesis for bone repair in vivo.Citation13 In a previous study, using MF, regulation of alignment of SCs has been reported.Citation14 However, it is unclear whether magnetic nanocomposites via MF can regulate SC biological properties, which is important for the in vitro and in vivo application of SCs.
In the present study, a magnetic nanocomposite with magnetically responsive magnetic nanoparticles (MNPs) was fabricated. We investigated the magnetization of the magnetic nanocomposites. We next examined their compositional and morphological characteristics. In addition, we explored whether the magnetic nanocomposites via MF would promote SC biological activities.
Materials and methods
Preparation of magnetic nanocomposites
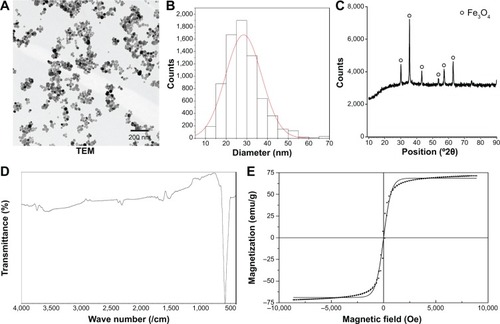
MNPs were synthesized using an oxidative hydrolysis approach as described previously.Citation15 In brief, 1.364 g KNO3 (99%; Acros Organics, Belgium) and 0.486 g NaOH (≥99%; Sigma-Aldrich, St Louis, MO, USA) were mixed together, and then the mixture was dissolved in 135 mL of deionized water bubbled with N2 flow. Then, a solution that had been previously prepared under 3 hours of N2 flow with 15 mL of 0.01 M H2SO4 (96%; Panreac, Spain) solution containing 0.308 g FeSO4·7H2O (≥99%; Sigma-Aldrich) was added drop by drop under constant stirring. When the precipitation was finished, N2 flow for an additional 10 minutes was allowed to pass, and the temperature was heated to 90°C for 24 hours. Finally, the product was cooled to room temperature by means of an ice bath. The synthetic black product was isolated by magnetic decantation, and then rinsed several times using deionized water to remove all residual impurities. The crystallization of MNPs was determined using X-ray diffraction (XRD) by Cu Kα X-radiation (Rigaku Miniflex, Japan), and the morphology, distribution, and average size of MNPs were examined by transmission electron microscopy (TEM; H-600; Hitachi, Japan). The chemical composition of MNPs was recorded using Fourier-transform infrared (FTIR) spectrophotometry (8400s; Shimadzu, Japan), and spectra were measured in the mid-IR range (128 scans) from 4,000 to 400 cm−1 (at a resolution of 4.0 cm−1). Magnetization was determined with a vibrating sample magnetometer (665; Lake Shore Cryotronics, USA).
To prepare magnetic nanocomposites (5%, 10%, 20% w/w MNPs), 5 mL of 0.1 M acetic acid aqueous solution and 100 mg chitosan powder (molecular weight >310 kD, deacetylation ≈90%, Sigma-Aldrich) were mixed well to prepare a chitosan solution. The glycerophosphate salt (Fluka, USA) solution, prepared by adding 1 mL phosphate-buffered saline (PBS) to 500 mg glycerophosphate salt, was added to the chitosan solution drop-wise with an ice bath. The final solution was homogeneous and clear, with a pH of 7.04. Then, a chitosan–glycerophosphate mixture was stored at −80°C for 24 hours and lyophilized for another 24 hours. Then, 100 mg chitosan–glycerophosphate lyophilized powder was redissolved in 5 mL of deionized water, and MNPs were added to the chitosan–glycerophosphate solution with vigorous stirring in an ice bath for 2 hours. Later, the MNP–chitosan mixture was vacuumized for 24 hours at 4°C and stored at 4°C. For different experimental purposes, the MNP–chitosan mixture was fabricated into membranes or scaffolds. For magnetic membranes, the MNP–chitosan mixture was later modeled onto a plastic dish and air-dried at room temperature for 24 hours. The dried magnetic membranes were washed using deionized water to remove spare MNPs, and air-dried again at room temperature. For magnetic scaffolds, the MNP–chitosan mixture was injected into a tailor-made mold, which was immediately stored at −80°C for 24 hours and then lyophilized for 24 hours. Then, the magnetic scaffolds were separated from the mold and cut into cylinders (2.0 cm in length, 2.0 mm in diameter). The dried magnetic scaffolds were rinsed with deionized water to remove spare MNPs, and lyophilized again for 24 hours. Ethylene dioxide gas was used to sterilize the magnetic membranes and magnetic scaffolds at 37°C according to standard industrial procedures.
Magnetic measurements
Magnetization of magnetic nanocomposites at a low field was detected at 34 Oe via a YSZ 01C/02C susceptometer (Sartorius Mechatronics, Italy). Calibration for high-field magnetization was measured using the sample magnetometer at room temperature. The magnetic potentiality of the magnetic scaffolds was investigated by using an external magnet.
Compositional characterization
FTIR spectral analysis is necessary for the identification of functional groups present in a chemical product based on their vibration energy. The FTIR spectrum of the magnetic mixtures was recorded using FTIR. In parallel, XRD analysis was also performed.
Morphological characterization
Morphological observation of the magnetic membranes and magnetic scaffolds was performed on each type using scanning electron microscopy (SEM; JSM-4800; Hitachi) at an accelerating voltage of 5 kV. The samples had been previously sputter-coated with gold and analyzed under partial vacuum.
Porosity
The porosity of the magnetic scaffolds was tested by a specific customized bottle (Hubbard; Hanil, South Korea) on the basis of Archimedes’s principle.Citation16 Briefly, the porosity of scaffolds was calculated as follows:
SC culture and identification
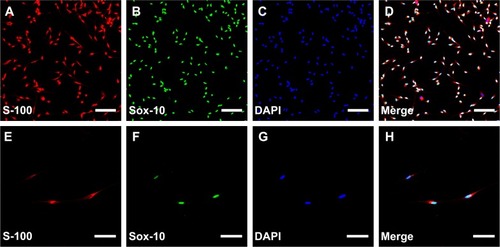
SCs were prepared and purified following a protocol described previously.Citation17 All the experimental procedures were performed in accordance with the Guide for the Care and Use of Laboratory Animals.Citation18 In brief, SCs were isolated from the sciatic nerves of 1- to 2-day-old Sprague Dawley rats (provided by the Experimental Animal Center of the Fourth Military Medical University) and further selected from fibroblasts using fibronectin-specific antibody and rabbit complement. The purity of the SCs was determined by double-immunofluorescent staining with S-100 (red) and Sox-10 (green). The numbers of S-100- and Sox-10-positive cells and 4′,6-diamidino-2-phenylindole (DAPI)-labeled cells were compared. The final preparations consisted of a high purity (>96%) of SCs (). SCs were maintained in Dulbecco’s Modified Eagle’s Medium nutrient mixture F-12 (DMEM/F12; Gibco, USA) containing 10% fetal calf serum (FCS; Gibco), antibiotics (100 UI/mL penicillin and 100 µg/mL streptomycin solution), 20 µg/mL bovine pituitary extract (Biomedical Technologies, USA) and 2 µM/mL forskolin (Sigma-Aldrich) at 37°C under humidified 5% CO2. SC cultures were passaged no more than five times before conducting experiments.
Figure 1 Characterization of SCs.
Notes: Double-immunofluorescent staining showed the expression of S-100 (A and E) and Sox-10 (B and F) with DAPI nuclear counterstaining (C and G). Merge image showed a purity of more than 96% SCs (D and H). Scale bars: (A–D) 100 µm (magnification 20×), (E–H) 50 µm (magnification 40×).
Abbreviations: SCs, Schwann cells; DAPI, 4′,6-diamidino-2-phenylindole.
Magnetic exposure system
The magnetic exposure system comprised a solenoid and a MF generator to produce MFs with adjustable magnetic induction of 0–20 mT and frequency of 0–100 Hz. The dimensions of the solenoid were 40 mm high, 400 mm long, 100 mm inner diameter, and 200 mm outer diameter (). This customized solenoid was wrapped with 1.00 mm-diameter enamel-coated copper wire (500 turns). A MF generator (GHY-III, patent ZL02224739.4; FMMU, People’s Republic of China [PRC]) connected with the solenoid to produce an open-circuit output waveform MF. The measurement accuracy of the electromagnetic field output was confirmed with a Gaussmeter (Model 455 DSP; Lake Shore Cryotronics). A small 2 Ω resistor was laid correctly in series with the solenoid, and the wave shape and frequency were visualized by an oscilloscope (6000 series; Agilent Technologies, USA). The MF parameter was set to a frequency of 50 Hz, as described in previous experiments.Citation9,Citation19,Citation20 In the nonstimulated group, the cell-culture plate was put correctly in a solenoid that was connected to the MF generator, but had no output waveform.
Figure 2 Schematic view of this experiment.
Notes: (A) Experimental time scale. (B) The device used to expose SCs to the MF and the no-MF stimulations. The solenoid was wired to a pulse generator. (C) The membrane and scaffold seeded with SC model. (D) The distribution of the MF in the solenoid. Models were placed in the axial plane of the solenoid.
Abbreviations: SCs, Schwann cells; MF, magnetic field.
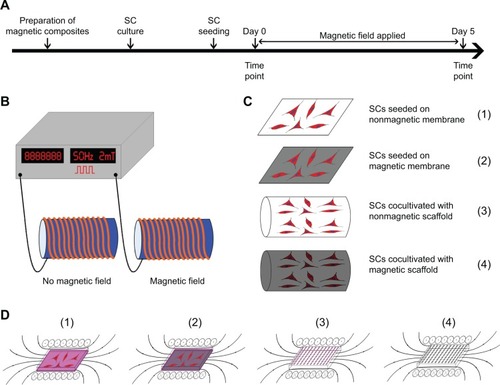
Nanocomposites prepared for biological testing
Only 10% MNP magnetic membranes (thickness, 0.4 mm) and 10% MNP magnetic scaffolds were used for biological testing. Nonmagnetic membranes and nonmagnetic scaffolds were also used as controls. All membranes were cut into rectangular sections (76×25 mm). The membrane sections were fastened to the bottom of the customized magnetic cell-culture plate. All scaffolds were cut into cylinders (5.0 mm in height, 2.0 mm in diameter).
Magnetic exposure of SCs
When SCs reached 95% confluence, a 0.05% trypsin solution was used to dissociate SCs, and then they were rinsed gently and resuspended in DMEM/F12 containing 10% FCS. The cells were later seeded on 10% MNP magnetic membranes, nonmagnetic membranes, and culture plates, respectively, and then incubated for cell settling and adhesion within 24 hours. Then, different MF gradients (0.5 mT, 1 mT, 2 mT, 5 mT, 10 mT; 50 Hz) were applied to the cells seeded on the membrane for 2 hours using the MF-exposure system described in the Magnetic exposure system section. After MF exposure, fresh DMEM/F12 with 10% FCS was used to replace the culture medium. The cells were then cultured for an additional 24 hours. Cells cultured on magnetic membranes without MF exposure, nonmagnetic membranes without MF exposure, and culture plates without MF exposure served as controls. For stereoscopic cultivation, the cells (1×10⁴ cells/well) were cocultivated with pieces of the 10% MNP magnetic scaffolds and nonmagnetic scaffolds in 96-well plates for 24 hours to allow settling and adhesion. MF exposure was then applied to the cells for 2 hours. After MF exposure, fresh DMEM/F12 containing 10% FCS was used to replace the culture medium. The cells were cultured for an additional 24 hours. Cells cocultivated with magnetic scaffolds without MF exposure, nonmagnetic scaffolds without MF exposure, and culture plates without MF exposure served as controls.
Flow-cytometry assay
The SCs (1×10⁵ cells/cm2) were cultured on the 10% MNP magnetic membranes, nonmagnetic membranes, and culture plates, respectively, for 24 hours, and then different MF gradients (0.5 mT, 1 mT, 2 mT, 5 mT, 10 mT; 50 Hz) were applied to the cells seeded on the membranes for 2 hours. After MF exposure, SCs were cultured for another 24 hours, and then the percentage of viable cells was analyzed by flow cytometry. All samples were analyzed within 30 minutes.
CCK-8 assay
The viability of SCs seeded on magnetic membranes was detected and quantified using the Cell Counting Kit 8 (CCK-8; Dojindo, Japan). Briefly, the SCs seeded on magnetic membranes were under different exposure times (0.5, 1, 2, 3, and 4 hours) of the MF (2.0 mT). At 24 and 48 hours after MF exposure, SCs were washed three times with PBS. Then, SCs were detached from the magnetic membrane using a 0.05% trypsin solution, washed, and resuspended in DMEM/F12. Thereafter, the cell suspension was inoculated (100 µL/well) in a 96-well plate. The CCK-8 solution (10 µL) was added to each well of the plate and incubated for 4 hours. The absorbance was measured at 492 nm using a microplate reader.
Evaluation of SC morphology on membranes and scaffolds
Twenty-four hours after MF stimulation, the adhesion of SCs in each group was detected with SEM. In brief, SCs were rinsed with PBS twice and then fixed with 4% para-formaldehyde for 25 minutes at room temperature, washed three times using deionized water, and then dehydrated with serial ethanol solutions, followed by brief vacuum-drying. Thereafter, the specimens were sputter-coated with gold, and then observed by SEM. The dendritic segments of SCs on membranes were chosen randomly from apical and basal regions, and at least one soma’s length away from the cell soma, the length of randomly selected dendritic segments was measured.
PrestoBlue assay
Cell viability was analyzed using a PrestoBlue® cell-viability reagent (Life Technologies, USA) according to the procedures given by the manufacturer. PrestoBlue is a nontoxic aqueous fluorescent dye that does not affect the viability, phenotype, or proliferation of cells. In brief, 24 hours after MF stimulation, the membranes with cells seeded were rinsed gently with sterilized PBS. Then, SCs were trypsinized, washed, and resuspended in DMEM/F12. Thereafter, 90 µL of the cell suspension was inoculated in each well of a 96-well plate. Then, 10 µL of the PrestoBlue reagent was added to each well. The plate was then cultured for another 120 minutes. The cells cocultivated with the scaffolds were also tested using the PrestoBlue reagent according to the same method. Twenty-four hours after MF exposure, the medium was replaced with 90 µL of fresh serum-free DMEM/F12 and 10 µL of PrestoBlue reagent. The plate was then cultured for another 120 minutes, and then the media were transferred to a separate 96-well plate for measuring. Optical density readings were collected at 570/630 nm using a microplate reader and compared to culture plate-group cells. A calibration curve was prepared using the data collected from the wells, which contained known numbers of viable cells.
EdU-labeling assay on membranes
Cell-proliferation assays were performed using the Cell-Light™ 5-ethynyl-2-deoxyuridine (EdU) deoxyribonucleic acid (DNA) cell-proliferation kit (RiboBio, PRC) based on the manufacturer’s protocol. In brief, 24 hours after MF exposure, EdU was applied 4 hours prior to fixation of SCs and the EdU immunostaining. To determine the proliferation level of SCs, an EdU-labeling index was calculated as the amount of EdU-stained nuclei divided by the amount of DAPI-stained nuclei calculated from five random fields. Assays were done three times using triplicate wells.
Live/Dead assays on scaffolds
For assessing the survival and proliferation of SCs cocultivated with scaffolds, Live/Dead (BioVision, USA) assays were performed, which employed two color fluorescent dyes (Live/Dead cell-staining kit). Live cells were stained by Live-Dye™, a green fluorescent dye (excitation/emission 488/518 nm), and dead cells were stained by propidium iodide, a red fluorescent dye (excitation/emission 488/615 nm). For the Live/Dead assay, MF exposure was applied to cells for 2 hours every day at the same time point, and then the cells were incubated for an additional 22 hours. Briefly, on day 1, day 3, and day 5 after MF exposure, the SC scaffolds were incubated with 200 µL of fresh serum-free DMEM/F12 with 5 mM of Live-Dye and 5 mM of propidium iodide. After incubation (2 hours at 37°C and 5% CO2), the SC scaffolds were washed three times with sterilized PBS at 5-minute intervals to remove unbound reaction products. The bicolor labeling was visualized using a microscope (FV-1000, Olympus, Japan) equipped for fluorescent detection and fitted with a digital charge-coupled-device camera for image capturing (Optronics, USA). An FV10-ASW 3.1 viewer (Olympus, Japan) was used for image analysis.
Gene-expression analysis
At 12, 24, and 36 hours after MF exposure, SCs both in membranes and scaffolds were first counted and then homogenized in Trizol reagent (Sigma-Aldrich). Total ribonucleic acid (RNA) was isolated and normalized to cell numbers. Complementary DNA was synthesized using Superscript III reagents according to the manufacturer’s instructions (Invitrogen, US). Then, quantitative real-time PCR (QRT-PCR) analysis was performed. The sequencers of primers for BDNF, GDNF, NT-3, VEGF-A, and ACTB (internal control) are shown in . QRT-PCR conditions were as follows: denaturation at 95°C, 30 seconds; primer annealing at 59°C, 30 seconds; and elongation at 72°C, 40 seconds. Quantification of PCR products was performed using the 2-∆∆Ct method. Quantities of messenger RNA (mRNA) were normalized to the housekeeping gene ACTB. Assays were done three times using triplicate wells.
Table 1 Primer sequences used for real-time polymerase chain reaction
ELISA assay
For enzyme-linked immunosorbent assay (ELISA) analysis, the SCs were cultured in fresh DMEM/F12 medium without FCS. At 12, 24, and 36 hours after MF exposure, the number of SCs was counted, and the amount of BDNF, GDNF, NT-3, and VEGF secreted by the cultured SCs was determined by the collected culture mediums. Cell-culture supernatants were centrifuged, and the assays were carried out using an ELISA kit (Antibodies Online, Germany). The absorbance of each well was measured using a micro-ELISA reader (Multiscan MK3; Thermo Labsystems, Finland) at 450 nm. Then, the amount of BDNF, GDNF, NT-3, and VEGF secreted by SCs was normalized to cell numbers in each group.
Statistical analysis
All data presented here are expressed as means ± standard error of the mean. The data were analyzed using one-way analysis of variance with SPSS 13.0 software (SPSS, USA). Values of P<0.05 were considered statistically significant.
Results
Characteristic determination of MNPs
The morphology of the MNPs was observed by TEM. MNPs were relatively uniform in size (), and the mean size of MNPs was 28.44±8.73 nm (). XRD showed that the crystalline pattern of MNPs was almost in accordance with standard iron oxide crystals ().Citation21 The FTIR spectrum showed that the characteristic absorption peak for iron oxide was measured at 584 cm−1 (), which was the specific Fe–O vibration. In addition, MNPs showed superparamagnetism ().
Figure 3 Characterization of MNPs.
Notes: (A) TEM. (B) Size distribution of MNPs. (C) XRD. (D) FTIR spectrum. (E) Magnetization of MNPs.
Abbreviations: MNPs, magnetic nanoparticles; TEM, transmission electron microscopy; XRD, X-ray diffraction; FTIR, Fourier-transform infrared.
FTIR and XRD
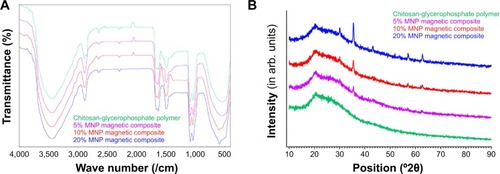
The FTIR spectra of the magnetic nanocomposites and chitosan–glycerophosphate mixture are shown in . The FTIR spectrum of the chitosan–glycerophosphate mixture showed a broad absorption band in the range of 3,600–3,000 cm−1, which was attributable to the overlap of ν(OH) and ν(NH) stretching. A smaller absorption band at 2,880 cm−1 was due to ν(CH) stretching. The characteristic bands at 1,650 and 1,560 cm−1 resulted from ν(C=O) stretching and δ(N–H) bending, respectively. The FTIR spectrum exhibited double peaks at 1,070 and 1,000 cm−1 for ν(C–O–C) stretching. In addition, a broad band in the range of 600–500 cm−1 (bending motion of the O=C–N groups) was also observed. The characteristic of the Fe–O vibration was not measured, because of the low content of MNPs in the nanocomposites. In addition, its characteristic absorption peak drowned in the chitosan–glycerophosphate absorption band. The XRD-specific spectrum of MNPs was observed in the magnetic nanocomposites (). The FTIR and XRD spectra of all the magnetic nanocomposites were similar, although they differed slightly from one another due to different weight ratios of MNPs.
Figure 4 FTIR spectrum and XRD images of the magnetic nanocomposites.
Notes: The FTIR (A) and XRD (B) spectra of all the magnetic nanocomposites were similar, although they differed slightly from each other due to different weight ratios of MNPs.
Abbreviations: FTIR, Fourier-transform infrared; XRD, X-ray diffraction; MNPs, magnetic nanoparticles.
Magnetic characterization
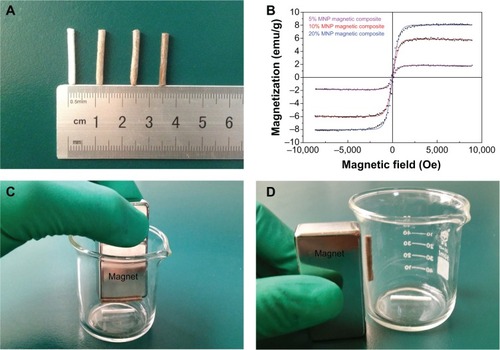
The magnetic properties of magnetic nanocomposites under MF were determined for ML, which represents the magnetization measured at 34 Oe (low MF), and for MH, which represents the magnetization measured at 8 kOe (high MF). The magnetic nanocomposites showed strong ML, with 0.091 emu/g in 5% MNP magnetic nanocomposite, 0.173 emu/g in 10% MNP magnetic nanocomposite, and 0.256 emu/g in 20% MNP magnetic nanocomposite, respectively. The nanocomposites showed superparamagnetism at room temperature (). The MH was 1.721 emu/g in 5% MNP magnetic nanocomposite, 5.691 emu/g in 10% MNP magnetic nanocomposite, and 8.063 emu/g in 20% MNP magnetic nanocomposite, respectively. The magnetic property of magnetic scaffolds was confirmed using a magnet (). The magnetic scaffolds were attracted by the magnet in all directions (up-down, in–out), rather than nonmagnetic scaffolds.
Figure 5 The appearance and magnetization of magnetic scaffolds.
Notes: (A) The appearance of magnetic scaffolds. From left to right: nonmagnetic scaffold, 5% MNP magnetic scaffold, 10% MNP magnetic scaffold, and 20% MNP magnetic scaffold. (B) The magnetization of magnetic nanocomposites was tested with a VSM. Photographs showing the attraction of the 10% MNP magnetic scaffold to a standard magnet after magnetization: up–down (C), and in–out (D).
Abbreviations: MNP, magnetic nanoparticle; VSM, vibrating sample magnetometer.
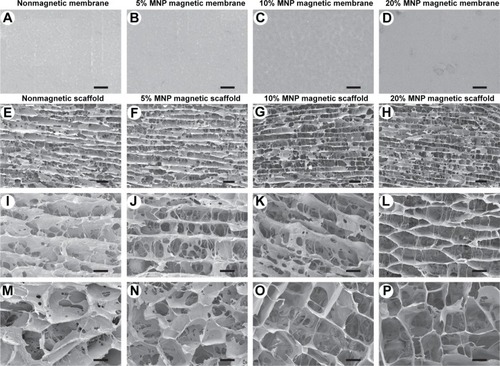
Morphology of magnetic membranes and magnetic scaffolds
SEM was introduced to study the morphology of magnetic membranes and magnetic scaffolds. The surface of the membranes was neat, and showed almost no cracks (, A–D). All scaffolds displayed lengthwise-oriented microchannels with various lengths in the longitudinal section (), and a honeycomb-like pattern of the microchannels was arranged in the cross section (). The average cross-sectional diameter of different-content magnetic scaffolds was variable, with 34.52±1.93 µm in 5% MNP magnetic scaffolds, 32.33±1.81 µm in 10% MNP magnetic scaffolds, and 26.75±1.71 µm in 20% MNP magnetic scaffolds, as well as 36.55±1.87 µm in nonmagnetic scaffolds.
Figure 6 SEM images of the magnetic membranes and scaffolds.
Notes: (A–D) Representative images of nonmagnetic membrane, 5% MNP magnetic membrane, 10% MNP magnetic membrane, and 20% MNP magnetic membrane are shown in the first row. (E–L) Representative images of nonmagnetic scaffold, 5% MNP magnetic scaffold, 10% MNP magnetic scaffold, and 20% MNP magnetic scaffold in a longitudinal section, showing the longitudinally oriented microchannels and interconnected porous structure. (M–P) Representative images of nonmagnetic scaffold, 5% MNP magnetic scaffold, 10% MNP magnetic scaffold, and 20% MNP magnetic scaffold in a transverse section, showing that the microchannels were arranged in a honeycomb-like pattern. Scale bars: (A–D) 1.5 µm, (E–H) 60 µm, (I–P) 30 µm.
Abbreviations: SEM, scanning electron microscopy; MNPs, magnetic nanoparticles.
Scaffold porosity
The composition had an effect on the porosity of the magnetic scaffolds. Porosity was 78.48%±0.89% in 20% MNP magnetic scaffolds, which was significantly lower than that in nonmagnetic scaffolds (82.70%±0.85%) and 5% (81.09%±0.64%) and 10% (80.41%±0.72%) MNP magnetic scaffolds (P<0.05). The 10% MNP magnetic nanocomposites were used for the remainder of the experiments in this study, due to their good morphological features and magnetic performance.
SC survival on magnetic nanocomposites under MFs
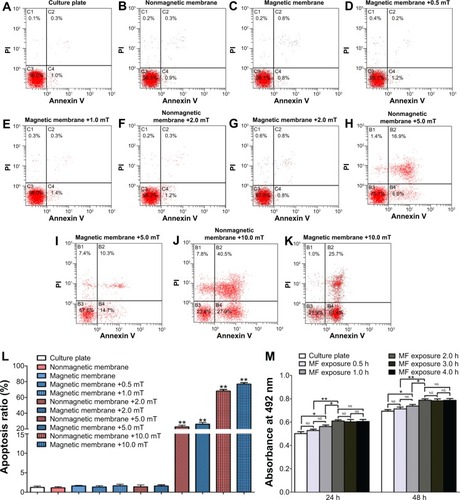
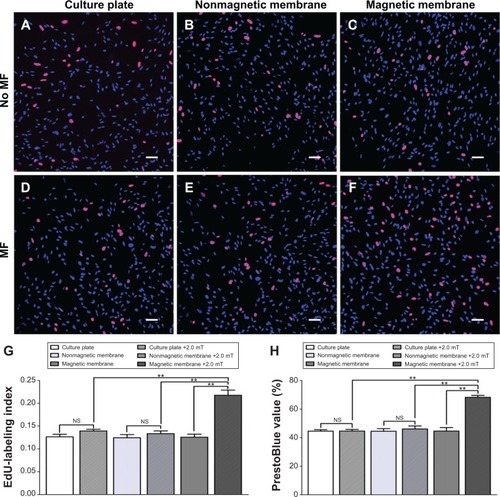
The effect of MFs on the survival of SCs with or without 10% MNP magnetic nanocomposites was investigated by flow-cytometry. As shown in , the apoptosis ratio of SCs cultured on magnetic membranes was 1.34%±0.15% at 0.5 mT, 1.66%±0.18% at 1.0 mT, and 1.58%±0.14% at 2.0 mT 24 hours after MF exposure, respectively, which was in a similar range to that on culture plates and nonmagnetic and magnetic membranes with no MF. When the MF was increased to 5.0 mT, the percentages of apoptotic cells cultured on nonmagnetic membranes and magnetic membranes significantly increased to 22.70%±0.93% (P<0.01) and 26.06%±1.03% (P<0.01), respectively. Furthermore, when the MF was increased to 10.0 mT, the percentages of apoptotic cells cultured on nonmagnetic membranes and magnetic membranes increased significantly to 68.08%±0.94% (P<0.01) and 76.92%±0.84% (P<0.01), respectively, indicating that higher MFs (5 and 10 mT) are detrimental to SCs seeded on magnetic or nonmagnetic substrates. Therefore, MF at 2.0 mT was applied in the remaining experiments, as it led to nonsignificant cell apoptosis.
Figure 7 Apoptosis assay of SCs in each group by flow cytometry and CCK-8 assay.
Notes: (A) Culture-plate group; (B) nonmagnetic membrane group; (C) magnetic membrane group; (D) magnetic membrane + MF group (0.5 mT); (E) magnetic membrane + MF group (1.0 mT); (F) nonmagnetic membrane + MF group (2.0 mT); (G) magnetic membrane + MF group (2.0 mT); (H) nonmagnetic membrane + MF group (5.0 mT); (I) magnetic membrane + MF group (5.0 mT); (J) nonmagnetic membrane + MF group (10.0 mT); (K) magnetic membrane + MF group (10.0 mT). (L) The percentage of apoptotic cells in each group was obtained by averaging the results of five flow-cytometry assays for each group. (M) The CCK-8 values of viable cells in each group were obtained. All data are expressed as means ± standard error of mean. *P<0.05; **P<0.01, one-way ANOVA when compared with culture-plate group.
Abbreviations: SCs, Schwann cells; MF, magnetic field; CCK, Cell Counting Kit; ANOVA, analysis of variance; PI, propidium iodide; h, hours; NS, not significant.
CCK-8 assay
Twenty-four hours after MF exposure, the CCK-8 value of SCs under 2 hours of MF stimulation was 1.15- and 1.08-fold higher than that under 0.5 and 1 hour of MF stimulation, respectively; however, the CCK-8 values under 2, 3, and 4 hours of MF stimulation showed no significant difference (). Forty-eight hours after MF exposure, the CCK-8 value of SCs under 2 hours of MF stimulation was 1.10- and 1.07-fold higher than that under 0.5 and 1 hour of MF stimulation, respectively; however, the CCK-8 values under 2, 3, and 4 hours of MF stimulation showed no significant difference (). Therefore, a 2-hour exposure time of MFs was applied in the remaining experiments.
SC morphology on membranes and scaffolds under MFs
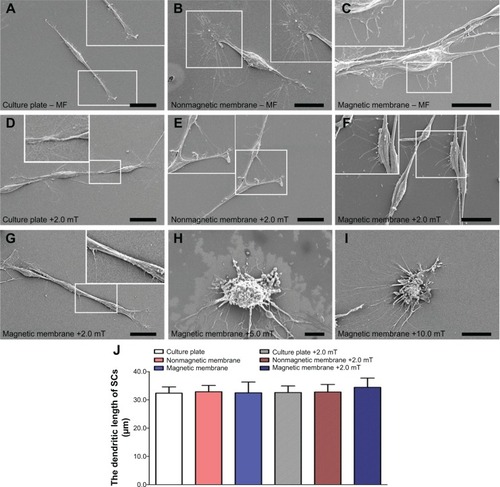
Without MF exposure, SCs attached and expanded on the magnetic membranes 24 hours after seeding (), which was comparable to those cultured on nonmagnetic membranes () and culture plates (), indicating that magnetic membranes were nontoxic to SCs. Twenty-four hours after MF exposure (2.0 mT), SCs exhibited a spindle shape and attached well on both nonmagnetic () and magnetic membranes (). In particular, cell division was observed on the 10% magnetic membranes under MF (2.0 mT, ). In contrast, cells were almost round, with damaged membranes and cell debris under MFs at 5.0 mT or 10.0 mT after 24 hours’ exposure (). The SEM results on membranes were consistent with the flow-cytometry assay. The dendritic length of SCs on culture plates and nonmagnetic and magnetic membranes with MF exposure (2.0 mT) was 32.58±2.35 µm, 32.77±2.69 µm, and 34.41±3.30 µm, respectively, and without MF exposure was 32.37±2.20 µm, 32.86±2.24 µm, and 32.49±3.82 µm, respectively (), indicating that magnetic membranes via MF had no significant effect on the dendritic length of SCs.
Figure 8 Representative SEM photomicrographs of SCs in each group at 24 hours after seeding.
Notes: (A) Culture-plate group; (B) nonmagnetic membrane group; (C) magnetic membrane group; (D) culture plate + MF group (2.0 mT); (E) nonmagnetic membrane + MF group (2.0 mT); (F) magnetic membrane + MF group (2.0 mT); (G) dividing phase in magnetic membrane + MF group (2.0 mT); (H) magnetic membrane + MF group (5.0 mT); (I) magnetic membrane + MF group (10.0 mT). (J) The dendritic length of SCs in each group was measured (n=20). Scale bar: (A, D, E, G) 20 µm, (B, F, I) 15 µm, (C) 10 µm, (H) 5 µm.
Abbreviations: SCs, Schwann cells; MF, magnetic field.
SCs cocultivated with scaffolds were also observed (, A–D). Without MF exposure, SCs attached, adhered, and expanded on the nonmagnetic and magnetic scaffolds 24 hours after coculture, confirming that the 10% MNP magnetic scaffold was nontoxic to SCs. Twenty-four hours after MF exposure (2.0 mT), SCs exhibited a spindle shape and adhered well on both nonmagnetic and magnetic scaffolds.
SC viability on magnetic nanocomposites under MFs
The cell viability and number of SCs on magnetic membranes or scaffolds were investigated with or without MF. The EdU-labeling index was used to quantify cell proliferation on membranes. We first examined the effect of MF on cell proliferation. It was found that MF had no significant effect on the EdU-labeling index on culture plates or nonmagnetic membranes. We next examined whether magnetic membranes via MF could influence the effect of cell proliferation. When SCs were cultured on magnetic membranes, the EdU-labeling index of SCs was 1.73-fold higher than that without MF (), indicating that magnetic membranes via MF are capable of promoting cell proliferation. Without MF exposure, the PrestoBlue value of SCs was in a similar range on culture plates and nonmagnetic and magnetic membranes after 24 hours. Under MF exposure, the PrestoBlue value of SCs cultured on magnetic membranes was 1.53-fold higher than that without MF after 24 hours’ culture. In addition, the PrestoBlue value of SCs on culture plates and nonmagnetic membranes showed no significant difference compared to that without MF after 24 hours’ culture ().
Figure 9 EdU staining and PrestoBlue assay in magnetic membranes at 24 hours after seeding.
Notes: (A) culture plate group; (B) nonmagnetic membrane group; (C) magnetic membrane group; (D) culture plate + MF group (2.0 mT); (E) nonmagnetic membrane + MF group (2.0 mT); (F) magnetic membrane + MF group (2.0 mT). The EdU-labeling index (G) and PrestoBlue assay values (H) in each group were obtained by averaging the results of five samples for each group. Scale bar: (A–F) 50 µm (magnification 20×). All data are expressed as means ± standard error of mean. **P<0.01.
Abbreviations: EdU, 5-ethynyl-2-deoxyuridine; MF, magnetic field; NS, not significant.
The survival of SCs in magnetic scaffolds with or without MF was then investigated by Live/Dead staining. The representative images of Live/Dead assays are shown in . Without MF exposure, the percentage of live cells was in a similar range on nonmagnetic and magnetic scaffolds after 24 hours. Under MF exposure, the percentage of live cells was 78.97%±1.03% on nonmagnetic scaffolds and 84.84%±1.31% on magnetic scaffolds after 24 hours’ exposure (). In addition, the percentage of live cells on magnetic scaffolds under MF exposure increased by 1.05-fold at day 3 and 1.09-fold at day 5 compared to that at day 1 ().
Figure 10 SEM and Live/Dead staining of the SCs cocultivated with scaffold in each group.
Notes: (A–D) Representative images of SEM at 24 hours after seeding, (E–H) Live/Dead staining at Day 1, (I–L) Day 3, and (M–P) Day 5 in the nonmagnetic scaffold group, nonmagnetic scaffold + MF group (2.0 mT), magnetic scaffold group, and magnetic scaffold + MF group (2.0 mT). The percentage of living SCs (Q) and PrestoBlue assay values (R) in each group were obtained by averaging the results of five samples for each group. Scale bars: (E–P) 50 µm (magnification 60×). All data are expressed as means ± standard error of mean. *P<0.05; **P<0.01.
Abbreviations: SEM, scanning electron microscopy; SCs, Schwann cells; MF, magnetic field; NS, not significant.
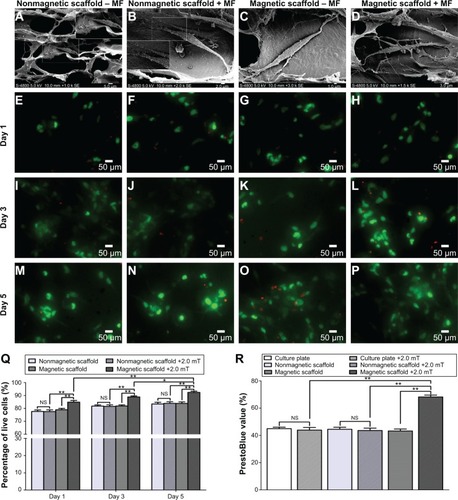
The viability of SCs in magnetic scaffolds was further examined with or without MF by PrestoBlue assay. Without MF exposure, the PrestoBlue value of SCs was in a similar range on culture plates and nonmagnetic and magnetic scaffolds after 24 hours (). Under MF exposure, the PrestoBlue value of SC-cocultivated magnetic scaffolds was 1.58-fold higher than that without MF after 24 hours’ culture.
Expression of regeneration-related genes
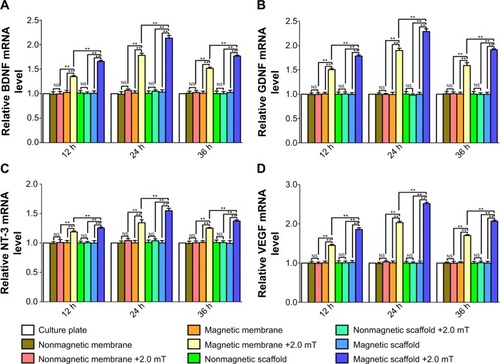
The effect of MFs on expression of BDNF, GDNF, NT-3, and VEGF of SCs seeded with membranes and scaffolds was examined by RT-PCR 12, 24, and 36 hours after MF exposure. The mRNA levels of BDNF, GDNF, NT-3, and VEGF were in a similar range as SCs cultured in groups without MF exposure at 12, 24, and 36 hours, respectively. Under MF exposure, the BDNF mRNA level cultured on magnetic membranes and magnetic scaffolds at 12 hours was 1.31- and 1.64-fold higher than that without MF exposure, respectively, at 24 hours was 1.76- and 2.07-fold higher than that without MF exposure, respectively, and at 36 hours was 1.50- and 1.72-fold higher than that without MF exposure, respectively (). The GDNF mRNA level cultured on magnetic membranes and magnetic scaffolds at 12 hours was 1.50- and 1.79-fold higher than that without MF exposure, respectively, at 24 hours was 1.91- and 2.29-fold higher than that without MF exposure, respectively, and at 36 hours was 1.58- and 1.92-fold higher than that without MF exposure, respectively (). The NT-3 mRNA level cultured on magnetic membranes and magnetic scaffolds at 12 hours was 1.18- and 1.26-fold higher than that without MF exposure, respectively, at 24 hours was 1.34- and 1.55-fold higher than that without MF exposure, respectively, and at 36 hours was 1.24- and 1.38-fold higher than that without MF exposure, respectively (). The VEGF mRNA level cultured on magnetic membranes and magnetic scaffolds at 12 hours was 1.44- and 1.83-fold higher than that without MF exposure, respectively, at 24 hours was 2.02- and 2.51-fold higher than that without MF exposure, respectively, and at 36 hours was 1.69- and 2.07-fold higher than that without MF exposure, respectively ().
Figure 11 mRNA levels of BDNF, GDNF, NT-3, and VEGF in each group with or without MF at 12, 24, and 36 hours after MF.
Notes: mRNA levels of (A) BDNF, (B) GDNF, (C) NT-3, and (D) VEGF were determined for the culture-plate group, nonmagnetic membrane group, nonmagnetic membrane + MF group (2.0 mT), magnetic membrane group, magnetic membrane + MF group (2.0 mT), nonmagnetic scaffold group, nonmagnetic scaffold + MF group (2.0 mT), magnetic scaffold group, and magnetic scaffold + MF group (2.0 mT). Each test was repeated three times. The ratio of mRNA levels of the SC nonmagnetic membrane group, nonmagnetic membrane + MF group (2.0 mT), magnetic membrane group, magnetic membrane + MF group (2.0 mT), nonmagnetic scaffold group, nonmagnetic scaffold + MF group (2.0 mT), magnetic scaffold group, and magnetic scaffold + MF group (2.0 mT) to the culture plate group are shown. All data are expressed as means ± standard error of mean. **P<0.01.
Abbreviations: mRNA, messenger ribonucleic acid; BDNF, brain-derived neurotrophic factor; GDNF, glial cell-derived neurotrophic factor; NT-3, neurotrophin 3; VEGF, vascular endothelial growth factor; MF, magnetic field; SC, Schwann cell; NS, not significant; h, hours.
Secretion of regeneration-related proteins
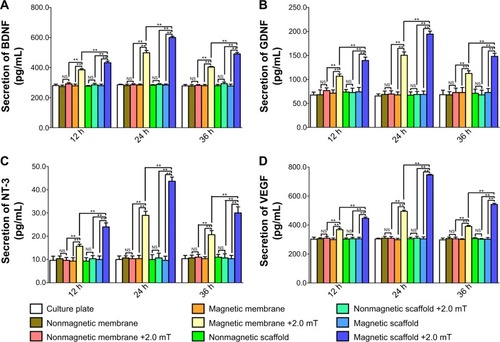
The effect of MFs on the secretion of BDNF, GDNF, NT-3, and VEGF of SCs seeded with membranes and scaffolds was examined 12, 24, and 36 hours after MF exposure. The secretion of BDNF, GDNF, NT-3, and VEGF were in a similar range in SCs cultured in groups without MF exposure at 12, 24, and 36 hours, respectively. Under MF exposure, the secretion of BDNF cultured on magnetic membranes and magnetic scaffolds at 12 hours was 1.38- and 1.54-fold higher than that without MF exposure, respectively, at 24 hours was 1.75- and 2.11-fold higher than that without MF exposure, respectively, and at 36 hours was 1.44- and 1.77-fold higher than that without MF exposure, respectively (). The secretion of GDNF cultured on magnetic membranes and magnetic scaffolds at 12 hours was 1.50- and 1.88-fold higher than that without MF exposure, respectively, at 24 hours was 2.22- and 2.83-fold higher than that without MF exposure, respectively, and at 36 hours was 1.55- and 2.04-fold higher than that without MF exposure, respectively (). The secretion of NT-3 cultured on magnetic membranes and magnetic scaffolds at 12 hours was 1.64- and 2.40-fold higher than that without MF exposure, respectively, at 24 hours was 2.81- and 4.52-fold higher than that without MF exposure, respectively, and at 36 hours was 2.00- and 2.90-fold higher than that without MF exposure, respectively (). The secretion of VEGF cultured on magnetic membranes and magnetic scaffolds at 12 hours was 1.23- and 1.46-fold higher than that without MF exposure, respectively, at 24 hours was 1.65- and 2.45-fold higher than that without MF exposure, respectively, and at 36 hours was 1.30- and 1.79-fold higher than that without MF exposure, respectively ().
Figure 12 Secretion of BDNF, GDNF, NT-3, and VEGF in each group with or without MF at 12, 24, and 36 hours after MF.
Notes: Secretion levels of (A) BDNF, (B) GDNF, (C) NT-3, and (D) VEGF were determined for the culture-plate group, nonmagnetic membrane group, nonmagnetic membrane + MF group (2.0 mT), magnetic membrane group, magnetic membrane + MF group (2.0 mT), nonmagnetic scaffold group, nonmagnetic scaffold + MF group (2.0 mT), magnetic scaffold group, and magnetic scaffold + MF group (2.0 mT). Each test was repeated three times. Protein-level ratios of the SC nonmagnetic membrane group, nonmagnetic membrane + MF group (2.0 mT), magnetic membrane group, magnetic membrane + MF group (2.0 mT), nonmagnetic scaffold group, nonmagnetic scaffold + MF group (2.0 mT), magnetic scaffold group, and magnetic scaffold + MF group (2.0 mT) to the culture-plate group are shown. All data are expressed as means ± standard error of mean. **P<0.01.
Abbreviations: BDNF, brain-derived neurotrophic factor; GDNF, glial cell-derived neurotrophic factor; NT-3, neurotrophin 3; VEGF, vascular endothelial growth factor; MF, magnetic field; SC, Schwann cell; NS, not significant; h, hours.
Discussion
The present study first fabricated and characterized novel magnetically responsive nanocomposites, and then found that magnetic nanocomposites via MFs were capable of enhancing the biological properties of SCs. These findings open up possibilities of promoting nerve regeneration in these magnetically responsive nanocomposites through enhanced viability and neurotrophins secretion of SCs.
MNPs are superparamagnetic at room temperature, which makes them attractive in applications in biomedical fields, such as hyperthermia therapy, drug delivery, and magnetic resonance imaging.Citation22–Citation24 A recent study has reported that MNP-bound BDNF can transmigrate across the blood brain barrier using an in vitro blood brain barrier model and subsequently exert the role of BDNF in neuroprotection, which represents an extensive application of MNPs with additional molecular factors.Citation25 In addition, chitosan and glycerophosphate are biodegradable, mucoadhesive, and nontoxic polymers, which show good biocompatibility for neuron survival and adherence.Citation26 Therefore, the magnetically responsive nanocomposites in the present study were made of chitosan, glycerophosphate, and MNPs. The FTIR and XRD results indicated that the structure of MNPs in the magnetic nanocomposites was well maintained during stirring and lyophilization, and this was very critical for keeping their magnetic behavior. Furthermore, the magnetic nanocomposites exhibited superparamagnetism at room temperature, which made them work like a local MF amplifier. Their intrinsic magnetization could be triggered by an applied MF, and continuous interaction of the nanocomposite with the external field can be activated under the effect of magnetically responsive MNPs.
Microstructural characteristics are crucial for tissue-engineering applications of biomaterials. In this study, the magnetic scaffolds made of 5% and 10% MNP magnetic nanocomposites showed porosities close to 85%, which has been shown to be necessary to allow the migration of regenerating axons in ample space.Citation27 In contrast, the porosity of 20% MNP magnetic scaffolds had porosity of less than 80%, which might be attributable to the cross-linking role of MNPs in the chitosan–glycerophosphate polymer.Citation28 The cross-linking property of MNPs in scaffolds was realized by reducing the biopolymer-chain distance, thus resulting in the possibilities of more sealed pores, less pore interconnection, and lower porosity with more MNPs. In addition, the cross-sectional diameter of microchannels in the 5% and 10% MNP magnetic scaffolds were approximately 30 µm, which has been shown to be most effective for promoting orientated neurite outgrowth,Citation29 since it is small enough to physically align and restrict the orientation of regenerating axons, as well as large enough to allow for vascularization and the infiltration of cells that support regeneration.Citation30–Citation32
It has been shown that the intensity of MFs is crucial for their effect on biological properties of different cell types, including rat bone mesenchymal stromal cells, PC12 cells and neuroblastoma cells.Citation9,Citation19,Citation20 In the present study, we first screened the optimal intensity of MFs for SCs. It was found that MF at 2 mT was beneficial for the attachment and proliferation of SCs in membranes and scaffolds. When MFs increased to high magnetic gradients (5 mT and 10 mT), the apoptosis ratio of SCs significantly increased in contrast to the MF at 2 mT, indicating that MFs at higher magnetic intensities lead to significant cell apoptosis and are detrimental to SC viability. It has been shown that MF at 0.016 mT had no detectable effect on neurite outgrowth in PC12 cells, while a high MF at 1.37 mT significantly promoted neurite outgrowth.Citation19 In addition, MF at 5 mT has been found to facilitate neuronal differentiation of rat bone mesenchymal stromal cells.Citation9 All these findings imply that the sensitivity of different cell types to MFs is distinct. In addition, 2 hours of MF exposure (2.0 mT) was applied in the present study, for this exposure time showed higher CCK-8 value of SCs than that under 0.5 and 1 hour, and no significant difference compared with that under 3 and 4 hours of MF exposure. In a previous study, 20 minutes and 5 days of MF exposure was applied to regulate the biological properties of endothelial cells.Citation12 However, studies comparing the efficacy of MFs with different exposure durations on SCs through magnetic nanocomposites have been lacking, and these may be important for in vivo and clinical applications of MFs in nerve-injury repair. Therefore, optimal parameters of MFs through magnetic nanocomposites for SCs need to be chosen before in vivo and clinical applications of MFs in nerve-injury repair.
We then investigated whether magnetic nanocomposites via MFs are capable of regulating SC biological properties. A significantly greater cell viability and higher EdU-labeling index were found in SCs cultured on magnetic membranes with MF than those without MF, suggesting that MF and magnetic materials worked synergistically to promote SC proliferation. In this study, the effect of MF and magnetic nanocomposites on SCs cocultivated within scaffolds was also investigated. It has been shown that a three-dimensional highly porous scaffold provides surfaces on which cells adhere, thrive, multiply, and generate the extracellular matrix of structural and functional proteins and saccharides that make up living tissue.Citation33 The SEM results showed that most of the SCs adhered well, and stretched out bipolar or multipolar processes with or without MFs, suggesting that magnetic scaffolds are capable of supporting SC adhesion. In addition, a significantly higher cell viability and higher percentage of live cells were found in SCs within magnetic scaffolds with MFs than those without MFs, suggesting that a magnetically responsive microenvironment inside three-dimensional scaffolds is capable of enhancing cell viability and survival. All these findings highlight the possibility of combining MFs and SC-seeded magnetic scaffolds to enhance nerve regeneration in vivo.
SCs produce many neurotrophic factors,Citation34,Citation35 which are of great importance for promoting peripheral regeneration.Citation36–Citation38 In this study, the expression and secretion of BDNF, GDNF, NT-3, and VEGF was detected. BDNF has been reported to improve survival and outgrowth of motor neurons in both peripheral nerve and spinal cord injuries.Citation39 GDNF is a neurotrophic factor that is critical for the growth, survival, and differentiation of motor neurons and central noradrenergic neurons.Citation40 NT-3 is a major support protein for SCs, and loss of NT-3 results in degradation of SC efficiencies.Citation41 In addition, VEGF is an effective protein that is able to promote axonal outgrowth and SC proliferation, and moreover, to stimulate SC infiltration and neovascularization after sciatic nerve transections.Citation42,Citation43 In the present study, magnetic membranes via MFs were capable of increasing the expression and secretion of BDNF, GDNF, NT-3, and VEGF in SCs, which was further enhanced when SCs were seeded within scaffolds, and moreover, the gene expression and protein secretion of these neurotrophic factors through a time-course assay were reversible, which has shown that high prolonged expression of these factors is not necessarily positive in peripheral nerve repair.Citation44 All these findings indicated that magnetic nanocomposites via MFs are capable of regulating the expression and secretion of multiple NTs in a synergistic way in SCs.
Although the mechanism by which magnetic nanocomposites via MFs regulate the functions of SCs is unclear, a few possible causes could be postulated. First, because MNPs became an intrinsic component in the nanocomposites, they can be activated by applied MFs to create enormous miniature magnetic forces, and then trigger cell signaling via receptors, including channels and integrins on plasma membranes, and subsequently lead to activation of regeneration-related neurotrophic factors. Alternatively, it is possible that the magnetic nanocomposite undergoes a shape change by an external MF, creating mechanical forces that exert a mechanical effect on SCs. Further studies are needed to investigate the mechanism underneath the regulated effect on SCs in response to magnetic nanocomposites via MFs. In the present study, we incorporated MNPs in a chitosan–glycerophosphate composite, expecting to exert in the nanomaterial a novel magnetically responsive function. The benefit of incorporation of MNPs in nanocomposites is that MNPs become constitutional components, which through an applied MF continually stimulate SC proliferation and production of neurotrophic factors. Therefore, a combined application of MNP-functionalized nanocomposites and SCs is expected to provide a tunable regenerative microenvironment, which may be instructive for nerve regeneration and functional recovery after nerve injury and repair.
Conclusion
The present study describes the positive effect of magnetic nanocomposites and MFs on SC proliferation and biological properties in vitro. The magnetic nanocomposites in the present study were constructed from a chitosan–glycerophosphate polymer incorporated with magnetically responsive NPs. The magnetic nanocomposites hold the crystalline structure of MNPs, have modest magnetization, and possess a tunable microenvironment, making them appropriate for cellular support and cultivation in both membrane and scaffold environments. The magnetic nanocomposites and MFs work synergistically to regulate the biological properties of SCs and regulate the expression and secretion of BDNF, GDNF, NT-3, and VEGF in SCs. These findings open up possibilities of enhancing nerve regeneration in magnetically responsive scaffolds through enhanced viability and production of biologic factors in SCs via applied MFs.
Acknowledgments
This work was supported by grants from the National Natural Science Foundation of China (81201389 and 30973052), the National Basic Research Program of China (973 Program No 2014CB542206), and the Program for Changjiang Scholar and Innovative Research Team in University (IRT1053). We thank technicians Mr Jintao Hu, Ms Lifeng Lan, Ms Jing Fan, Mr Haifeng Zhang, Mr Yongqiang Li, and Ms Ying Hao for their excellent technical assistance.
Disclosure
The authors report no conflicts of interest in this work.
References
- FawcettJWKeynesRJPeripheral nerve regenerationAnnu Rev Neurosci19901343602183684
- ChenZLYuWMStricklandSPeripheral regenerationAnnu Rev Neurosci20073020923317341159
- ZhangYGShengQSQiFYSchwann cell-seeded scaffold with longitudinally oriented micro-channels for reconstruction of sciatic nerve in ratsJ Mater Sci Mater Med20132471767178023512154
- NovikovaLNPetterssonJBrohlinMWibergMNovikovLNBiodegradable poly-beta-hydroxybutyrate scaffold seeded with Schwann cells to promote spinal cord repairBiomaterials20082991198120618083223
- SchlosshauerBMullerESchröderBPlanckHMüllerHWRat Schwann cells in bioresorbable nerve guides to promote and accelerate axonal regenerationBrain Res20039631–232132612560139
- FansaHKeilhoffGFörsterGSeidelBWolfGSchneiderWAcellular muscle with Schwann-cell implantation: an alternative biologic nerve conduitJ Reconstr Microsurg199915753153710566583
- HeJDingWLLiFXiaRWangWJZhuHPanaxydol treatment enhances the biological properties of Schwann cells in vitroChem Biol Interact20091771343918805406
- KimSImWSKangLLeeSTChuKKimBIThe application of magnets directs the orientation of neurite outgrowth in cultured human neuronal cellsJ Neurosci Methods20081741919618682261
- BaiWFXuWCFengYFifty-Hertz electromagnetic fields facilitate the induction of rat bone mesenchymal stromal cells to differentiate into functional neuronsCytotherapy201315896197023602580
- MaJZhangZSuYMagnetic stimulation modulates structural synaptic plasticity and regulates BDNF-TrkB signal pathway in cultured hippocampal neuronsNeurochem Int2013621849123201339
- SapirYCohenSFriedmanGPolyakBThe promotion of in vitro vessel-like organization of endothelial cells in magnetically responsive alginate scaffoldsBiomaterials201233164100410922417620
- SapirYPolyakBCohenSCardiac tissue engineering in magnetically actuated scaffoldsNanotechnology201425101400924334551
- MengJXiaoBZhangYSuper-paramagnetic responsive nanofibrous scaffolds under static magnetic field enhance osteogenesis for bone repair in vivoSci Rep20133265524030698
- EguchiYOgiue-IkedaMUenoSControl of orientation of rat Schwann cells using an 8-T static magnetic fieldNeurosci Lett2003351213013214583398
- RiggioCCalatayudMPHoskinsCPoly-l-lysine-coated magnetic nanoparticles as intracellular actuators for neural guidanceInt J Nanomedicine201273155316622811603
- OhSHParkIKKimJMLeeJHIn vitro and in vivo characteristics of PCL scaffolds with pore size gradient fabricated by a centrifugation methodBiomaterials20072891664167117196648
- MeyJSchrageKWesselsIVollpracht-CrijnsIEffects of inflammatory cytokines IL-1β, IL-6, and TNFα on the intracellular localization of retinoid receptors in Schwann cellsGlia200755215216417078027
- ZhuSGeJWangYA synthetic oxygen carrier-olfactory ensheathing cell composition system for the promotion of sciatic nerve regenerationBiomaterials20143551450146124246645
- ZhangYDingJDuanWA study of the effects of flux density and frequency of pulsed electromagnetic field on neurite outgrowth in PC12 cellsJ Biol Phys20063211919669431
- TrilloMAMartínezMACidMAUbedaARetinoic acid inhibits the cytoproliferative response to weak 50-Hz magnetic fields in neuroblastoma cellsOncol Rep201329388589423292364
- CornellRMSchwertmannUThe Iron Oxides: Structure, Properties, Reactions, Occurrences and UsesHoboken (NJ)Wiley2003
- BautistaMCBomati-MiguelOZhaoXComparative study of ferrofluids based on dextran-coated iron oxide and metal nanoparticles for contrast agents in magnetic resonance imagingNanotechnology2004154S154S159
- LuJYangSNgKMSolid-state synthesis of monocrystalline iron oxide nanoparticle based ferrofluid suitable for magnetic resonance imaging contrast applicationNanotechnology2006172358125820
- GuptaAKGuptaMSynthesis and surface engineering of iron oxide nanoparticles for biomedical applicationsBiomaterials200526183995402115626447
- Pilakka-KanthikeelSAtluriVSSagarVSaxenaSKNairMTargeted brain derived neurotropic factors (BDNF) delivery across the blood–brain barrier for neuro-protection using magnetic nanocarriers: an in-vitro studyPLoS One201384e6224123653680
- CromptonKEGoudJDBellamkondaRVPolylysine-functionalised thermoresponsive chitosan hydrogel for neural tissue engineeringBiomaterials200728344144916978692
- MaoJSZhaoLGYinYJYaoKDStructure and properties of bilayer chitosan-gelatin scaffoldsBiomaterials20032461067107412504529
- TampieriALandiEValentiniFA conceptually new type of bio-hybrid scaffold for bone regenerationNanotechnology201122101510421135464
- GoldnerJSBruderJMLiGGazzolaDHoffman-KimDNeurite bridging across micropatterned groovesBiomaterials200627346047216115675
- KimYTHaftelVKKumarSBellamkondaRVThe role of aligned polymer fiber-based constructs in the bridging of long peripheral nerve gapsBiomaterials200829213117312718448163
- BozkurtABrookGAMoellersSIn vitro assessment of axonal growth using dorsal root ganglia explants in a novel three-dimensional collagen matrixTissue Eng200713122971297917937537
- BozkurtADeumensRBeckmannCIn vitro cell alignment obtained with a Schwann cell enriched microstructured nerve guide with longitudinal guidance channelsBiomaterials200930216917918922575
- DerbyBPrinting and prototyping of tissues and scaffoldsScience2012338610992192623161993
- TerenghiGPeripheral nerve injury and regenerationHistol Histopathol19951037097187579822
- MirskyRJessenKRBrennanASchwann cells as regulators of nerve developmentJ Physiol Paris2002961–2172411755779
- GuénardVKleitmanNMorrisseyTKBungeRPAebischerPSyngeneic Schwann cells derived from adult nerves seeded in semipermeable guidance channels enhance peripheral nerve regenerationJ Neurosci1992129331033201527582
- MosahebiAWoodwardBWibergMMartinRTerenghiGRetroviral labeling of Schwann cells: in vitro characterization and in vivo transplantation to improve peripheral nerve regenerationGlia200134181711284015
- RodriguezAMPisaniDDechesneCATransplantation of a multipotent cell population from human adipose tissue induces dystrophin expression in the immunocompetent mdx mouseJ Exp Med200520191397140515867092
- ZhangHYJinXBLueTFThree important components in the regeneration of the cavernous nerve: brain-derived neurotrophic factor, vascular endothelial growth factor and the JAK/STAT signaling pathwayAsian J Androl201113223123521170078
- HendersonCEPhillipsHSPollockRAGDNF: a potent survival factor for motoneurons present in peripheral nerve and muscleScience19942665187106210647973664
- WoolleyAGTaitKJHurrenBJFisherLSheardPWDuxsonMJDevelopmental loss of NT-3 in vivo results in reduced levels of myelin-specific proteins, a reduced extent of myelination and increased apoptosis of Schwann cellsGlia200856330631718080292
- HaninecPKaiserRBobekVDubovýPEnhancement of musculocutaneous nerve reinnervation after vascular endothelial growth factor (VEGF) gene therapyBMC Neurosci2012135722672575
- SondellMLundborgGKanjeMVascular endothelial growth factor stimulates Schwann cell invasion and neovascularization of acellular nerve graftsBrain Res1999846221922810556639
- HoyngSADe WinterFGnaviSA comparative morphological, electrophysiological and functional analysis of axon regeneration through peripheral nerve autografts genetically modified to overexpress BDNF, CNTF, GDNF, NGF, NT3 or VEGFExp Neurol201426157859325128265