

Abstract
As United States Food and Drug Administration-approved implantable material, carbon fiber-reinforced polyetheretherketone (CFRPEEK) possesses an adjustable elastic modulus similar to cortical bone and is a prime candidate to replace surgical metallic implants. The bioinertness and inferior osteogenic properties of CFRPEEK, however, limit its clinical application as orthopedic/dental implants. In this study, CFRPEEK–nanohydroxyapatite ternary composites (PEEK/n-HA/CF) with variable surface roughness have been successfully fabricated. The effect of surface roughness on their in vitro cellular responses of osteoblast-like MG-63 cells (attachment, proliferation, apoptosis, and differentiation) and in vivo osseointegration is evaluated. The results show that the hydrophilicity and the amount of Ca ions on the surface are significantly improved as the surface roughness of composite increases. In cell culture tests, the results reveal that the cell proliferation rate and the extent of osteogenic differentiation of cells are a function of the size of surface roughness. The composite with moderate surface roughness significantly increases cell attachment/proliferation and promotes the production of alkaline phosphatase (ALP) activity and calcium nodule formation compared with the other groups. More importantly, the PEEK/n-HA/CF implant with appropriate surface roughness exhibits remarkably enhanced bioactivity and osseointegration in vivo in the animal experiment. These findings will provide critical guidance for the design of CFRPEEK-based implants with optimal roughness to regulate cellular behaviors, and to enhance biocompability and osseointegration. Meanwhile, the PEEK/n-HA/CF ternary composite with optimal surface roughness might hold great potential as bioactive biomaterial for bone grafting and tissue engineering applications.
Supplementary materials
Figure S1 SEM images of different Al2O3 grains used for sandblasting treatment.
Notes: (A) Al2O3 particles with a grain size of 60–80 μm; (B) Al2O3 particles with a grain size of 110–150 μm; (C) Al2O3 particles with a grain size of 180–250 μm.
Abbreviation: SEM, scanning electron microscope.
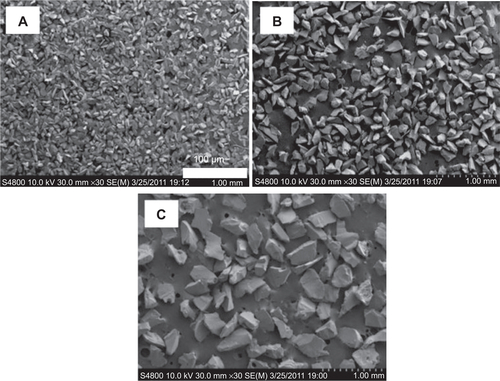
Figure S2 Energy-dispersive X-ray spectroscopy analysis of the control group, group 1, group 2, and group 3 of the PEEK/n-HA/CF ternary biocomposites.
Notes: (A) Control group; (B) group 1; (C) group 2; and (D) group 3 of the PEEK/n-HA/CF ternary biocomposites.
Abbreviations: At%, atom percentage; PEEK/n-HA/CF, carbon fiber-reinforced polyetheretherketone–nanohydroxyapatite.
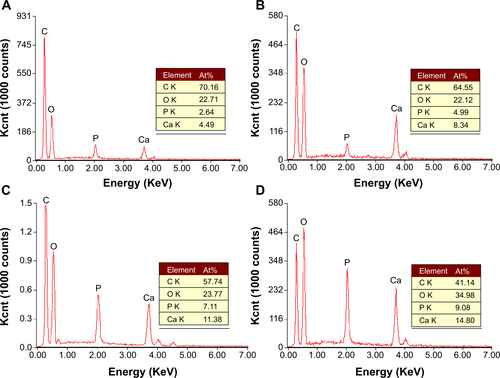
Figure S3 Scanning electron microscope images of osteoblast-like cells on the surfaces of the control and group 2 samples cultured for 14 days.
Notes: (A) Control group; (B) group 2.
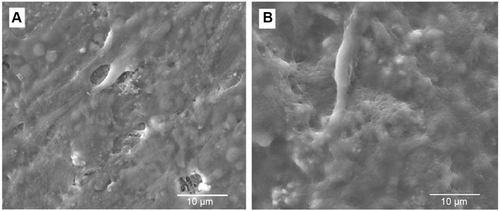
Figure S4 The number of adherent cells per projected area on the different biocomposite surfaces calculated by immunofluorescence.
Note: *P<0.05 compared to other groups.
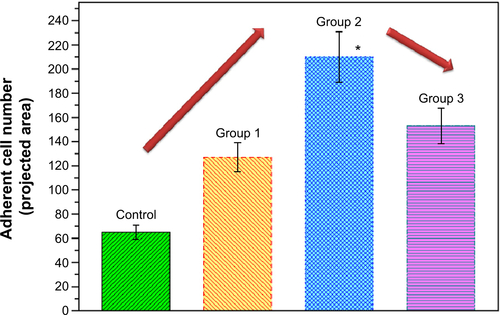
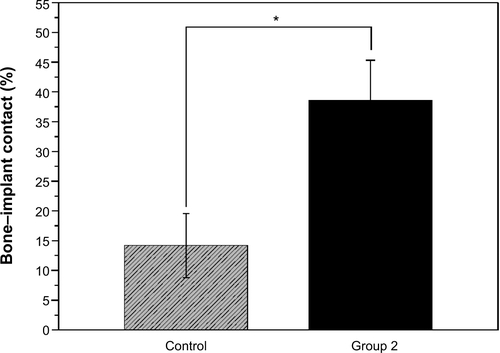
Figure S5 Percentage of bone–implant contact for the control and group 2 implants at 8 weeks.
Note: *P<0.05.
Acknowledgments
This work was supported by the Beijing Natural Science Foundation (7132124), State Key Development Program for Basic Research of China (grant 2007CB936103), and Peking University’s 985 Grant.
Disclosure
The authors report no conflicts of interest in this work.