
Abstract
Tafenoquine (TQ), a new synthetic analog of primaquine, has relatively poor bioavailability and associated toxicity in glucose-6-phosphate dehydrogenase (G6PD)-deficient individuals. A microemulsion formulation of TQ (MTQ) with sizes <20 nm improved the solubility of TQ and enhanced the oral bioavailability from 55% to 99% in healthy mice (area under the curve 0 to infinity: 11,368±1,232 and 23,842±872 min·μmol/L) for reference TQ and MTQ, respectively. Average parasitemia in Plasmodium berghei-infected mice was four- to tenfold lower in the MTQ-treated group. In vitro antiplasmodial activities against chloroquine-sensitive and chloroquine-resistant strains of Plasmodium falciparum indicated no change in half maximal inhibitory concentration, suggesting that the microemulsion did not affect the inherent activity of TQ. In a humanized mouse model of G6PD deficiency, we observed reduction in toxicity of TQ as delivered by MTQ at low but efficacious concentrations of TQ. We hereby report an enhancement in the solubility, bioavailibility, and efficacy of TQ against blood stages of Plasmodium parasites without a corresponding increase in toxicity.
Introduction
Malaria, caused by parasites of the genus Plasmodium, is one of the world’s deadliest infectious diseases. In 2012, approximately 627,000 malaria deaths occurred worldwide and 3.4 billion people were at risk of contracting malaria.Citation1 Over 90% of malaria-associated deaths occur in Sub-Saharan Africa, with 77% of deaths occurring in children under the age of 5 years. On average, a child dies of malaria every 60 seconds, and children who survive the disease are at an increased risk of long-term neurological and cognitive disabilities.Citation2 Malaria, therefore, has a huge societal and economic impact globally and particularly in Sub-Saharan Africa.
Drug treatment remains the mainstay for the treatment of malaria as there is at present no effective vaccine. Currently used antimalarial drugs include 4-aminoquinolines, arylaminoalcohols, 8-aminoquinolines, artemisinins, antifolates, respiratory chain inhibitors, and antibiotics.Citation3 Even though these drugs are available, there has been a failure to eradicate malaria, partially because of the limitations of these drugs.Citation4 Such limitations include a short half-life, erratic absorption, and poor oral bioavailability, which can result in treatment failure; the use of high dosages and dose frequency; toxicity leading to poor patient compliance; and development of drug resistance. Nanoparticle drug delivery systems using microemulsions have the potential to improve drug therapeutic properties and enhance bioavailability by improving solubility of the drugs.Citation5 This will enable the drug to remain in the dissolved state for enhanced absorption, possibly altering the pharmacokinetic parameters of the drug molecule which ultimately enhances drug potency and influences toxicity.
The 8-aminoquinolines, such as primaquine (PQ) and tafenoquine (TQ), have unique modes of action and have the ability to prevent relapses caused by Plasmodium vivax and Plasmodium ovale. Research has shown that TQ has several advantages over PQ; for example, the in vitro activity of TQ is 4 to 100 times higher than PQ while the half-life is 50 times longer.Citation6,Citation7 TQ is also an effective transmission blocking agent,Citation8 has a long half-life of approximately 14 days,Citation9 and acts on all stages of Plasmodium falciparum infection.Citation10–Citation12 However, it has relatively poor aqueous solubility, which affects its oral bioavailability and the treatment dose. Studies have demonstrated the efficacy of a 200 mg or 400 mg dose when administered weekly for 13 weeks as a prophylactic measure,Citation13 or a 400 mg dose per month given over a period of 6 months.Citation14 However, the relatively high doses of drug required for efficacy has resulted in various adverse effects, among them gastrointestinal disturbances and hemolysis in glucose-6 phosphate dehydrogenase (G6PD)-deficient individuals.Citation13,Citation15 Approximately 400 million people worldwide are estimated to be G6PD deficient,Citation16 and this deficiency is quite common in populations in malaria-endemic regions.Citation17 A recent study reported a comparable loss of G6PD-deficient human red blood cells (HuRBCs) in mouse models treated with PQ and those treated with either pamaquine, sitamaquine, TQ, or dapsone, all of which are known to induce hemolytic toxicity.Citation18 We envisage that enhancing the solubility of TQ in a microemulsion could lead to a reduction in toxicity and hence a reduction in the rate at which hemolysis occurs in G6PD-deficient individuals. Reduction in dose and dose frequency could be achieved by enhancing the pharmacokinetic properties of TQ. Over the past 20 years, researchers have reported the therapeutic enhancing properties of microemulsions,Citation19–Citation21 but this system has not been widely applied for malaria treatment.
In the present study, we report on the development of a novel microemulsion of TQ (MTQ) (sizes <20 nm), enhancement in the pharmacokinetic and therapeutic efficacy of MTQ relative to unformulated TQ (RTQ), as well as the comparative evaluation of the toxicity of MTQ in a humanized nonobese diabetic (NOD) severe combined immunodeficiency (SCID) mouse model with G6PD deficiency.
Methods
Formulation of MTQ
TQ, sodium oleate, Tween 80, polyvinyl alcohol (PVA), and ethanol were purchased from Sigma Aldrich Co (St Louis, MO, USA). Citronella essential oil was supplied by SOIL (KwaZulu-Natal, South Africa). Oil-in-water (o/w) microemulsions loaded with or without TQ were prepared by combining a nonionic surfactant and a long-chain carbon fatty acid ester as depicted in . An aqueous solution of a mixture of 1% w/v PVA and sodium oleate (0.2% w/v) was prepared in a volume ratio of 1:1. To this was added, dropwise, an ethanolic solution containing TQ (concentration: 1.25 or 0.625 or 0.125 mg/mL) and the oil phase (citronella oil). Thereafter, 50 μL of Tween 20 or Tween 80 were introduced to the mixture while stirring. The admixture was then heated to 60°C and maintained at this temperature for 5 minutes, followed by a quenching process at ambient temperature, thereby producing spontaneously a transparent microemulsion.
Table 1 Matrix of experiments for the preparation of microemulsions
Characterization of size, size distribution, and zeta potential of microemulsion
The average droplet size, size distribution, and zeta potential were measured by dynamic light scattering techniques using a Malvern Zetasizer Nano ZS (Malvern Instruments, Malvern, UK). Measurements were conducted on undiluted samples at 25°C at an angle of 173°. The intensity-weighted mean value was measured as the average of three independent measurements.
pH and conductivity
The pH values of the microemulsions were determined at ambient temperature. The conductivity of each microemulsion was measured by using a conductivity/TDS/salinity RS232 meter (model AZ-8306; AZ Instruments Corp., Taichung City, Taiwan) at 25°C.
Drug solubility
TQ solubility was evaluated in the microemulsion formulation and in the individual ingredients of the microemulsion. TQ was added in excess to the optimized microemulsion formulation as well as each individual ingredient in the formulation. Maximum solubility of TQ in dimethyl sulfoxide of 5 mg/mL was used as reference concentration. After continuous shaking (100 rpm) for 24 hours at 37°C, samples were withdrawn and centrifuged at 10,000× g for 10 minutes. The supernatant was collected and diluted up to 40-fold with dimethyl sulfoxide. TQ concentration was then determined by ultraviolet spectrometry and absorbance was measured at 376 nm. The solubility of TQ in the microemulsion was compared to TQ solubility in the individual ingredients.
Parasitology
All the parasites used for this experiment were P. falciparum NF54 (MRA-1000, MR4; American Type Culture Collection [ATCC], Manassas, VA, USA) and Dd2 (MRA-156, MR4; ATCC). The asexual erythrocytic stages of these parasites were maintained in a continuous culture using the method of Trager and Jensen.Citation22
In vitro antiplasmodial assay
The antiplasmodial activities of RTQ and MTQ were evaluated against the chloroquine (CQ)-sensitive (NF54) and CQ-resistant (Dd2) strains of P. falciparum. Quantitative assessment of antiplasmodial activity in vitro was determined via the parasite lactate dehydrogenase assay as described in the literature.Citation23 CQ was used as the reference drug. A full dose–response was performed for all compounds to determine the concentration inhibiting 50% of parasite growth (IC50 value). Samples were tested over a concentration range of 1,000–2 ng/mL (the initial concentration was 1000 ng/mL and the final concentration was 2 ng/mL). The IC50 values were obtained using a nonlinear dose–response curve fitting analysis via GraphPad Prism v 4.0 software.
In vivo pharmacokinetic and efficacy studies
Animals
C57/BL6 mice (females 8–12 weeks) weighing 25–30 g were used. Mice were housed in 27×21×18 cm cages, under controlled environmental conditions (26°C±1°C, 60%±5% relative humidity, and a 12-hour light/dark cycle). Their diet consisted of standard laboratory food. Water was available ad libitum throughout the experiment. All studies and procedures were conducted with prior approval of the Ethics Committee of the University of Cape Town, Cape Town, South Africa (approval number 012/050) in accordance with the National Code for animal use in research, education, diagnosis, and testing of drugs and related substances in South Africa.
Pharmacokinetic studies
Oral drug administration
The bioavailability of TQ was evaluated in whole blood samples after oral administration of the RTQ formulation and MTQ formulation in a randomized, single-blind, parallel-group study. The RTQ formulation was prepared in 0.01 M HCl.
A study was conducted in eight mice, randomly divided into two groups (four mice per group), with the reference group receiving RTQ and the microemulsion group receiving MTQ containing the same dosage, namely 20 mg/kg TQ, via oral gavage. Blood samples (50 μL) were collected via tail-bleeding pre-dose and at 2, 8, 12, 24, 48, 72, 120, and 168 hours post-dose in 0.5 mL lithium heparin microvials to prevent blood coagulation.
Intravenous drug administration
The RTQ, which is the reference formulation, was administered intravenously at a dose of 2 mg/kg in 0.01 M HCl (n=5). Blood samples (50 μL) were collected via tail-bleeding pre-dose and at 0.17, 0.5, 1, 3, 5, 7, 12, and 24 hours post-dose in 0.5 mL lithium heparin microvials to prevent blood coagulation.
Liquid chromatography–mass spectrometry (LC/MS/MS) assay
The concentrations of TQ were determined using a validated quantitative LC/MS/MS assay method developed in the Division of Clinical Pharmacology, University of Cape Town. An optimized liquid–liquid extraction method was developed for the extraction of TQ from 20 μL mouse whole blood samples, using a universal Britton–Robinson buffer (pH 7) containing the internal standard (mefloquine) and ethyl acetate. Acetonitrile and formic acid were purchased from EMD Millipore (Billerica, MA, USA). The internal standard (mefloquine) was obtained from Toronto Research Chemicals (Toronto, Ontario, Canada). The organic phase was evaporated under nitrogen at room temperature for 30 minutes. The dried samples were reconstituted with mobile phase and a 3 μL sample was injected onto the analytical column. Chromatography was performed on a Phenomenex Luna 5 μm PFP(2), 100 A, 50×2 mm analytical column (Phenomenex, Torrance, CA, USA) using acetonitrile and 0.1% formic acid (80:20, v/v) as mobile phase at a flow rate of 0.3 mL/min. An AB Sciex API 2000 mass spectrometer was operated at unit resolution in the multiple reaction monitoring mode monitoring the transition of the protonated molecular ions at 464.2 to the product ions at 86.0 for TQ and the protonated molecular ions at 379.2 to the product ions at 361.1 for the mefloquine internal standard. The assay was validated over a range of 11.72 ng/mL to 3,000 ng/mL for TQ. The reliability of the assay was monitored at three levels with quality control samples. The limit of quantification for TQ was 11.72 ng/mL. Quadratic regression (1/x weighting) was used to construct calibration curves. The calibration standards and quality control standards were analyzed in duplicate in each study sample batch. The precision (total-assay coefficients of variation [%]) during sample analysis was less than 10% at high, medium, and low (2,400 ng/mL, 1,200 ng/mL, and 75 ng/mL, respectively) quality control levels for TQ.
Data analysis
A nonlinear mixed-effects model was developed to describe TQ pharmacokinetics in mice. NONMEM software (version 7.2)Citation24 was used for model implementation, while Perl Speaks NONMEM,Citation25 Xpose,Citation26 and PiranaCitation27 were used for model diagnostics and facilitation of the modeling process. Model development was guided by the NONMEM objective function value (assumed to be χ2-distributed), goodness-of-fit plots, and visual predictive checks.Citation28 First-order absorption (for the oral data) and one- and two-compartment disposition models were investigated. An error structure with an additive and a proportional component was used, and data below the limit of quantification were imputed to half of the limit of quantification, but treated with a large, additive-only error component. Allometric scaling,Citation29 based on each mouse body weight, was used to adjust clearance and volume parameters accounting for body size. The presence of between-subject variability in the model parameters was tested as lognormal distribution, and the value of oral bioavailability was investigated. Statistical differences between the particle sizes, IC50s, and pharmacokinetic values were compared by one-way analysis of variance with a Tukey’s post hoc test (with a level of significance P<0.05). shows the pharmacokinetic parameters evaluated from whole blood drug levels obtained.
Table 2 Summary of the pharmacokinetic parameters for RTQ and MTQ (IV n=5, oral n=4)
Efficacy studies in Plasmodium berghei-infected mice
TQ was evaluated in a mouse model of malaria for in vivo efficacy. The efficacy of RTQ was compared to that of MTQ. Additionally, snapshot pharmacokinetic samples were collected to determine the concentration of TQ at predetermined time intervals. The parasite used was the CQ-sensitive isolate P. berghei that expresses green fluorescent protein (GFP). Two host mice were infected with parasites and left untreated to allow the parasites to multiply. Parasitemia was monitored until it was sufficiently high; at that time, parasites were harvested from the host mice via cardiac puncture. The two parasite stocks were pooled and average parasitemia of the pooled stock was determined with the FACSCalibur™ using the software CellQuestPro. Additionally, the total number of erythrocytes per milliliter of the pooled stock was determined to ensure test animals obtained both uniform and correct amounts of parasite to establish the infection. Each mouse was infected with 1.5×10⁷ parasitized red blood cells intraperitoneally. Once the malaria infection (parasitemia >5%) had been established in the mice, MTQ and RTQ were administered at four different concentrations (20 mg/kg, 10 mg/kg, 5 mg/kg, and 1 mg/kg).
G6PD toxicity evaluation in SCID mouse model
Experimentation was carried out at SUNY Upstate Medical University, Syracuse, NY, USA, where researchers have developed and validated a method to predict the hemolytic potential of drugs by using NOD SCID mice engrafted with African variant (A-) G6PD-deficient HuRBCs.Citation18 Healthy NOD SCID mice (females 8–10 weeks) weighing approximately 20 g were used. All studies and procedures were conducted with prior approval of the Institutional Animal Care and Use Committee (IACUC) of SUNY Upstate Medical University (approval number 292) in accordance with the “Guide for care and use of laboratory animals”.Citation30 Mice were housed in 27×21×18 cm cages, under controlled environmental conditions (26°C±1°C, 60%±5% relative humidity, and a 12-hour light/dark cycle). Their diet consisted of standard laboratory food. Water was available ad libitum throughout the experiment. This evaluation was carried out to assess and compare the hemolytic effects of 3-day treatment regimens with TQ microemulsion at effective doses of 10 mg/kg, 5 mg/kg, and 1 mg/kg () on NOD SCID mice engrafted with A-G6PD-deficient HuRBCs. The NOD SCID mice received daily transfusions of HuRBCs from G6PD-deficient donors. To ascertain the hemolytic effect of MTQ and RTQ, comparable to reference control using PQ, two primary parameters, loss percent of HuRBC and percent murine reticulocyte (muRetic) levels, were evaluated. PQ, RTQ, and MTQ were evaluated in NOD SCID mice (female), 9–11 weeks old, engrafted with A-G6PD-deficient HuRBCs.
Table 3 Drug administration details per group
Drug preparation
For PQ, 10 mg (0.010 g) stock was weighed and reconstituted fresh daily in 1,000 μL phosphate-buffered saline. For TQ control, 5 mg TQ was weighed and reconstituted fresh daily in 500 μL hydroxyethyl cellulose–Tween. MTQ was prepared as stated in the Formulation of MTQ section.
Engraftment and hemolysis assessment
All 29 mice were engrafted with 5×10⁹ red blood cells intraperitoneally for 14 days. Twenty-eight mice met inclusion criteria (HuRBC >60%; mean: 72.2%). The first drug administration and assessment was carried out on day 15. Hemolysis was monitored on days 0, 4, and 7. The following were performed on day 7 after the treatment regimen was complete: retro-orbital sinus bleeds for percent HuRBC, percent muRetic level assessment, euthanasia, body weight measurements, and liver and spleen weight measurements.
Results and discussion
MTQ
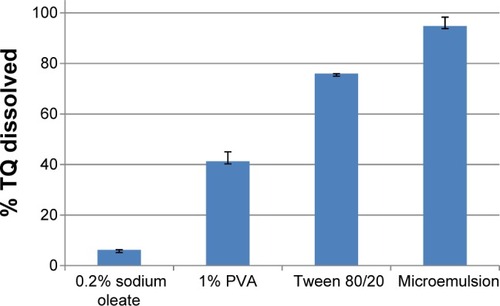
The ratio of excipients in experiments 2 and 6 () favored the formation of clear and stable microemulsions with sizes below 20 nm as depicted in . The average size of microemulsion formulations where the oil was used without forming a clear and transparent emulsion was above 100 nm with a broad size distribution which was attributed to low interaction of oil with the mixture of surfactants. The use of Tween 80 or Tween 20 did not result in a difference in TQ. Maximum solubility, as shown in , which may have played a role in the sizes (below 20 nm) observed in experiments 2 and 6, were achieved when all the excipients were used as indicated in .
Table 4 Characteristics of microemulsion formulations
Figure 1 Percentage of TQ (of 5 mg/mL) dissolved in different components of microemulsion and the optimized microemulsion (n=3; mean ± standard deviation).
Abbreviations: PVA, polyvinyl alcohol; TQ, tafenoquine.
Although the zeta potential values for experiments 2 and 6 were not considered high enough (ie, −30 mV) (), the stability of the two microemulsions was quite acceptable. For most of the microemulsions, the pH values obtained were almost neutral (approximately pH 7). The conductivity values of all formulations were above 100 μS/cm, suggesting that all the microemulsions formed were of the o/w type, which is in agreement with the literature.Citation31 The conductance of microemulsions is significantly increased with the percolation effect as droplets tend to fuse, thereby allowing enhanced transport of ions.Citation32 Formulation 2 showed the lowest conductivity and formulation 7 the highest. For the latter, this could be attributed to a percolation effect relating to the size of droplets (>150 nm) and the high concentration of sodium oleate salt which may dissociate, resulting in an enhanced mobility of ions. Formulation 6 was chosen as the optimal formulation for pharmacokinetic studies because of its small droplet size and high conductivity value.
In vitro antiplasmodial assay
There was no significant difference between the IC50 of RTQ and MTQ using the NF54 and Dd2 strains of P. falciparum. The mean IC50s (ng/mL) of RTQ and MTQ using NF54 were 917.2 ng/mL and 671.7±452.83 ng/mL, respectively. Similarly, the IC50 (ng/mL) using the resistant Dd2 strain was 495.9±192.76 for RTQ and 352.6±29.56 for MTQ.
The in vitro antiplasmodial activity of MTQ when compared to that of RTQ in the Dd2 strain compares well with a previous report on the marked schizontocidal activity of TQ relative to CQ, mefloquine, cycloguanil, and pyrimethamine in regions with high percentages of multidrug-resistant parasites.Citation33 This indicated that the microemulsion did not affect the inherent activity of TQ.
In vivo pharmacokinetic study
Oral absorption study
Comparative results of the pharmacokinetic parameters are presented in . The whole blood profile obtained for the oral group is graphically presented in . It is clear from that the incorporation of TQ in the microemulsion (15–20 nm) produced promising results.
Figure 2 Mean whole blood concentration versus time graphs following oral administration of 20 mg/kg each of tafenoquine reference formulation and microformulation.
Note: Data shown represent mean ± standard error of the mean of n=4 mice.
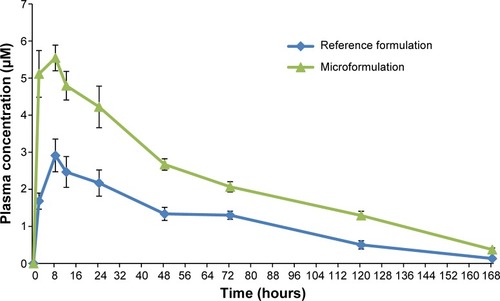
The observed maximum peak whole blood concentration was reached at approximately 9.0±1.0 hours in the RTQ formulation and at 6.5±1.5 hours for the MTQ formulation. This reduction in time to peak concentration (Cmax) in the MTQ formulation could be as a result of a possible enhancement in absorption which translated to the significant increase in bioavailability of TQ (99%) when compared to the free drug (55%). This enhancement in bioavailability can be ascribed to enhanced solubility through formulation as a microemulsion. Furthermore, the apparent elimination half-life was 38.3±4.1 hours for the RTQ formulation and 44.7±1.3 hours for the MTQ formulation, representing an approximate 6-hour increase in half-life between the RTQ and MTQ formulation. The Cmax of TQ was greatly increased when incorporated into the microemulsion. RTQ had a Cmax of 3.06±0.37 μM, while a Cmax of 5.28±0.26 μM was observed for the MTQ formulation. The area under the curve (AUC) 0 to infinity of RTQ was 11,368±1,232 min·μmol/L, and the AUC 0 to infinity of MTQ was 23,842±872 min·μmol/L. As shown in , the microemulsion increased the solubility of TQ by a factor of 16.2, 2.2, and 1.3 compared to 0.2% sodium oleate, 1% PVA, and the Tween mixture, respectively. This suggests that more drug would be soluble in the MTQ microemulsion compared to the RTQ, and therefore be available for absorption or permeation. This solubility enhancement would likely play a critical role in enhancing the oral bioavailability of TQ.
Efficacy evaluation
In the present study, a significant enhancement in efficacy was observed at the concentrations (5 mg/kg and 1 mg/kg) of TQ in microemulsion used in the single-dose treatment of mice infected with P. berghei. The enhanced solubility and bioavailability observed contributed to the recorded antimalarial activities of MTQ. A number of studies have demonstrated the advantages of drugs in nanoformulations over drugs that are not nanoformulated.Citation34–Citation38 Oral administration of curcumin-loaded nanoparticles resulted in a cure in Plasmodium yoelii-infected mice.Citation39 Similarly, a recent study reported an enhanced in vivo efficacy of decoquinate nanoparticle formulations in mice.Citation40 Futhermore, researchers have reported that nanostruc-turesd lipid carriers and self-emulsifying systems increased the oral bioavailability of fenofibrate.Citation41
Mice infected with P. berghei were treated with RTQ or MTQ at TQ doses of 1, 5, and 10 mg/kg. Although single-dose treatment for this blood stage infection did not result in a cure, it was observed that, at the 10 mg/kg dose, the average parasitemia was 1% in both groups, indicating effective killing at this level of TQ from both formulations. At the lower doses of 1 and 5 mg/kg TQ, there was a significant increase in the efficacy in the MTQ group, with average parasitemia levels approximately four- to tenfold lower than in the group treated with RTQ (average parasitemia of 31.3% and 43.3% versus 7.4% and 3.1% for 1 and 5 mg/kg, respectively).
The decrease in parasitemia at the 1 mg/kg dose can be explained by an elevated AUC of 1,288 from MTQ compared to 527 from RTQ. In contrast, however, the AUC at the 5 mg/kg dose was comparable, at 2,344 from RTQ and 2,331 from MTQ. The AUC appears to be linear with increases in dose for RTQ but not for MTQ. This suggests that the improved efficacy of TQ when given as an MTQ formulation against blood stage parasites may be due to other mechanisms in addition to the enhanced absorption. However, the current study did not evaluate the anti-hypnozoite activity of the MTQ.
G6PD toxicity evaluation
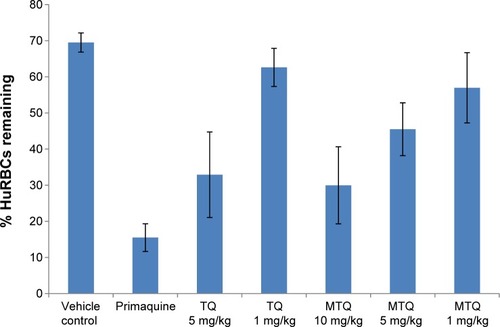
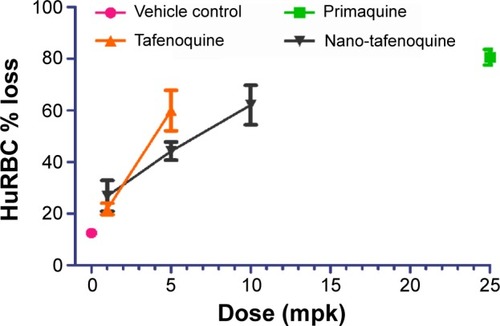
TQ is a promising drug for malaria prophylaxis;Citation42 however, TQ has poor solubility and bioavailability and induces hemolysis in individuals with G6PD deficiency. In this study, the levels of hemolysis observed as indicated by the percent of HuRBC remaining at 7 days post-initiation of treatment are shown in . The average percent loss of HuRBC recorded for PQ at 25 mg/kg dose (as a control) was 80.6%. RTQ was evaluated at 5 mg/kg and 1 mg/kg. Similarly, MTQ was evaluated at effective TQ doses of 5 mg/kg, 1 mg/kg, and 10 mg/kg. At 1 mg/kg and 5 mg/kg, the average percent losses in HuRBC for RTQ and MTQ were comparable. However, it was interesting to observe that our 10 mg/kg of MTQ resulted in an average percent loss of HuRBC (62%) comparable to that of the 5 mg/kg dose of RTQ (59.9%). This suggests that the dose and efficacy of TQ could be increased in the MTQ from 5 mg/kg to 10 mg/kg without a corresponding increase in percentage loss of HuRBC in SCID mice with G6PD deficiency. RTQ showed clear dose dependence in hemolysis, with higher doses of drug resulting in a corresponding increase in RBC loss.
Figure 3 Percentage loss of HuRBCs in SCID mice following oral administration of unformulated TQ and MTQ (n=4).
Abbreviations: HuRBC, human red blood cell; MTQ, microemulsion formulation of TQ; SCID, severe combined immunodeficiency; TQ, tafenoquine.
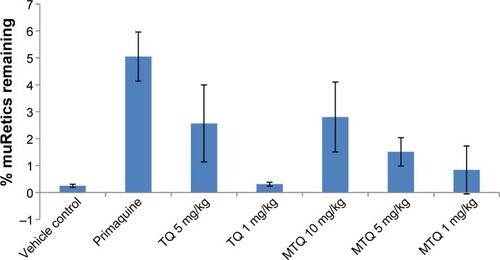
Researchers have reported increased peripheral blood levels in the bid to compensate acute blood loss, hence the reticulocytes could be an indicator for hemolytic toxicity.Citation18 The muRetic level of the MTQ group was, therefore, evaluated and was observed to be 1.5% and 0.8% for 5 mg/kg and 1 mg/kg doses, respectively (). The muRetic value was relatively high for 5 mg/kg TQ when compared to 5 mg/kg of nano-TQ, indicating increased blood levels suggesting an increase in hemolysis in SCID mice when dosed with 5 mg/kg RTQ. It was also observed that the reticulocyte level in the group which received 10 mg/kg MTQ was 2.8%, and this compares well to the level of reticulocytes (2.5%) in the 5 mg/kg RTQ group.
Figure 4 Peripheral blood levels of muRetics on day 7 (n=4).
Abbreviations: MTQ, microemulsion formulation of TQ; muRetics, mouse reticulocytes; TQ, tafenoquine.
Similarly, the spleen weight, which inevitably increases due to its role in destroying damaged red blood cells, was increased in the RTQ when compared to the nano-TQ (5 mg/kg and 1 mg/kg); however, the increase was not significant. The increase in the MTQ dose from 5 mg/kg to 10 mg/kg did not result in a corresponding increase in spleen weight. There were no significant changes in pre- versus posttreatment body weights. The calculation of percent HuRBC loss recorded a trend indicating less hemolysis in the MTQ-treated mice compared to RTQ-treated mice ().
Figure 5 Percentage HuRBC loss (n=4).
Notes: HuRBC % loss was calculated as ((day 0–day 7)/day 0) *100. Nano-tafenoquine = microemulsion formulation of tafenoquine; tafenoquine = unformulated tafenoquine.
Abbreviation: HuRBC, human red blood cell.
RTQ and MTQ were comparatively evaluated post-oral administration, to assess mitigation of MTQ against dose-dependent hemolysis on NOD SCID mice engrafted with A-G6PD-deficient HuRBCs. The hemolytic effect of test compounds and control were assessed by evaluating the percent loss of HuRBCs before (day 0) and after (day 7) drug administration. The treatment at doses of 10 mg/kg, 5 mg/kg, and 1 mg/kg was administered daily for 3 days. The control drug PQ has been reported to cause a decline in HuRBCs after 3 days of treatment with PQ,Citation18 and this was compared to a standard formulation of TQ (RTQ) and MTQ. The 3-day dosage of MTQ at 5 mg/kg and 1 mg/kg showed relatively less hemolysis when compared to RTQ in the NOD SCID mouse model engrafted with G6PD-deficient HuRBCs. The 10 mg/kg dose of MTQ resulted in HuRBC loss comparable to 5 mg/kg of RTQ. Similarly, 10 mg/kg MTQ upon evaluation of percentage muRetics, spleen enlargement, and liver weight recorded values comparable to 5 mg/kg RTQ. This showed that increasing the concentration of MTQ from 5 mg/kg to 10 mg/kg did not result in a corresponding increase in hemolysis or associated toxicity effects in SCID mice engrafted with A-G6PD-deficient HuRBCs. The differences in toxicity are attributed to the different kinetics of drug release occurring between RTQ and MTQ. Such differences in drug toxicity due to release kinetics have been observed previously.Citation43 The results suggest that microemulsions could be useful in reducing the hemolytic effect of RTQ, especially in G6PD-deficient individuals. In addition, comparing data from the efficacy and G6PD evaluation studies suggests that the dose can be further reduced to 1 mg/kg without loss of efficacy but with corresponding reduction in potential to cause hemolyis. This advancement could revitalize other 8-aminoquinolines as well as drugs for other diseases which induce oxidative stress in G6PD-deficient individuals.
The solubility and bioavailability enhancement recorded via the application of the microemulsion delivery system could have contributed to the reduction in hemolysis observed in the NOD SCID mouse model engrafted with G6PD-deficient HuRBCs. Entrapping drug compounds in microemulsion could lead to a reduction in the toxicity effect of the therapeutic doses administered to patients.
Conclusion
The results of this study provide evidence that the TQ microemulsion had the ability to enhance the solubility and therapeutic properties of TQ when administered orally. Furthermore, a significant enhancement in the oral bioavailability from 55% for RTQ to 99% using MTQ in healthy mice was observed. TQ doses administed as MTQ could be increased, without a corresponding increase in toxicity in SCID mice with G6PD deficiency. Future studies will evaluate MTQ for malaria prophylaxis in mice infected with P. berghei. The study could be designed to accommodate a 3-day treatment regimen used for the G6PD evaluation. The limitations of this study include the investigation of efficacy in C57/B76 mice, and toxicity in NOD SCID mice. Since mice differ from humans, we may not directly extrapolate the findings to depict the situation in humans.
Acknowledgments
The authors would like to thank the CSIR for funding this work through the High Impact Project. We appreciate GSK for their kind supply of tafenoquine drug compound (via Dr Benhards Ogutu). We thank Professor Rosemary Rochford at SUNY Upstate Medical University, Syracuse, NY, USA, for the evaluation of the G6PD-deficient mouse model. Admire Dube’s present affiliation is School of Pharmacy, University of the Western Cape, Bellville, South Africa.
Disclosure
The authors report no conflicts of interest in this work.
References
- World Malaria Report 2013GenevaWorld Health Organization2013
- IdroRMarshKJohnCCNewtonCRCerebral malaria: mechanisms of brain injury and strategies for improved neurocognitive outcomePediatr Res201068426727420606600
- SchlitzerMAntimalarial drugs – what is in use and what is in the pipelineArch Pharm (Weinheim)200834114916318297679
- AlonsoPLBrownGArevalo-HerreraMA research agenda to underpin malaria eradicationPLoS Med201181e100040621311579
- LawrenceMJReesGDMicroemulsion-based media as novel drug delivery systemsAdv Drug Deliv Rev2000458912111104900
- PetersWRobinsonBLMilhousWKThe chemotherapy of rodent malaria. LI. Studies on a new 8-aminoquinoline, WR 238,605Ann Trop Med Parasitol1993875475528122915
- BruecknerRPLasseterKCLinETSchusterBGFirst-time-in-humans safety and pharmacokinetics of WR 238605, a new antimalarialAm J Trop Med Hyg1998586456499598455
- WhiteNJPrimaquine to prevent transmission of falciparum malariaLancet infect Dis201313217518123182932
- CrockettMKainKCTafenoquine: a promising new antimalarial agentExpert Opin Investig Drugs2007165705715
- WhiteNJThe role of anti-malarial drugs in eliminating malariaMalar J20087Suppl 1S819091042
- ColemanREClavinAMMilhousWKGametocytocidal and sporontocidal activity of antimalarials against Plasmodium berghei ANKA in ICR Mice and Anopheles stephensi mosquitoesAm J Trop Med Hyg1992461691821539752
- VennerstromJLNuzumEOMillerRE8-Aminoquinolines active against blood stage Plasmodium falciparum in vitro inhibit hematin polymerizationAntimicrob Agents Chemother19994359860210049273
- ShanksGDOlooAJAlemanGMA new primaquine analogue, tafenoquine (WR 238605), for prophylaxis against Plasmodium falciparum malariaClin Infect Dis2001331968197411700577
- WalshDSEamsilaCSasipraphaTEfficacy of monthly tafenoquine for prophylaxis of Plasmodium vivax and multidrug-resistant P. falciparum malariaJ Infect Dis20041901456146315378438
- CappelliniMDFiorelliGGlucose-6-phosphate dehydrogenase deficiencyLancet2008371647418177777
- NkhomaETPooleCVannappagariVHallSABeutlerEThe global prevalence of glucose-6-phosphate dehydrogenase deficiency: a systematic review and meta-analysisBlood Cells Mol Dis200942326727819233695
- TishkoffSAVarkonyiRCahinhinanNHaplotype diversity and linkage disequilibrium at human G6PD: recent origin of alleles that confer malarial resistanceScience200129345546211423617
- RochfordROhrtCBareselPCHumanized mouse model of glucose 6-phosphate dehydrogenase deficiency for in vivo assessment of hemolytic toxicityPNAS201311043174861749124101478
- NobleSMarkhamACyclosporin. A review of the pharmacokinetic properties, clinical efficacy and tolerability of a microemulsion-based formulation (Neoral)Drugs1995509249418586033
- KovarikJMMuellerEAvan BreeJBTetzloffWKutzKReduced inter- and intraindividual variability in cyclosporine pharmacokinetics from a microemulsion formulationJ Pharm Sci1994834444468207699
- ErkkoPGranlundHNuutinenMReitamoSComparison of cyclosporin A pharmacokinetics of a new microemulsion formulation and standard oral preparation in patients with psoriasisBr J Dermatol199713682889039300
- TragerWJensenJBHuman malaria parasites in continuous cultureScience1976193673675781840
- MaklerMTRiesJMWilliamsJAParasite lactate dehydrogenase as an assay for Plasmodium falciparum drug sensitivityAm J Trop Med Hyg1993487397418333566
- BealSLSheinerLBBoeckmannAJNONMEM Users Guides. 1989–2006Ellicott City, MA, USAIcon Development Solutions
- LindbomLRibbingJJonssonENPerl-speaks-NONMEM (PsN) – a Perl module for NONMEM related programmingComput Methods Programs Biomed2004752859415212851
- JonssonENKarlssonMOXpose – an S-PLUS based population pharmacokinetic/pharmacodynamic model building aid for NONMEMComput Methods Programs Biomed1999581516410195646
- KeizerRJvan BentenMBeijnenJHSchellensJHHuitemaADPiraña and PCluster: a modeling environment and cluster infrastructure for NONMEMComput Methods Programs Biomed20111011727920627442
- HolfordNThe visual predictive check – superiority to standard diagnostic (Rorschach) plotsPAGE 14 Abstr738. Abstracts of the Annual Meeting of the Population Approach Group in EuropeJune 16–17, 2005Pamplona Available from: http://www.page-meeting.org/?abstract=738Accessed January 22, 2013
- AndersonBJHolfordNHMechanism-based concepts of size and maturity in pharmacokineticsAnnu Rev Pharmacol Toxicol20084830333217914927
- Guide for the Care and Use of Laboratory AnimalsWashington, DCNational Academies Press2010 Available from: http://grants.nih.gov/grants/olaw/Guide-for-the-care-and-use-of-laboratory-animals.pdfAccessed February 13, 2015
- BaroliBLópez-QuintelaMADelgado-CharroMBFaddaAMBlanco-MéndezJMicroemulsions for topical delivery of 8-methox-salenJ Control Release200069120921811018558
- BugALRSafranSAGrestGSWebmanIDo interactions raise or lower a percolation threshold?Phys Rev Lett1985551896189910031955
- PradinesBMamfoumbiMMTallAIn vitro activity of tafenoquine against the asexual blood stages of Plasmodium falciparum isolates from Gabon, Senegal, and DjiboutiAntimicrob Agents Chemother20065093225322616940138
- LaiJLuYYinZHuFWuWPharmacokinetics and enhanced oral bioavailability in beagle dogs of cyclosporine A encapsulated in glyceryl monooleate/poloxamer 407 cubic nanoparticlesInt J Nanomedicine20105132320161984
- ShaikhJAnkolaDDBeniwalVSinghDKumarMNNanoparticle encapsulation improves oral bioavailability of curcumin by at least 9-fold when compared to curcumin administered with piperine as absorption enhancerEur J Pharm Sci2009373–422323019491009
- SinghKKNanomedicine in malariaSoutoEBPatenting Nanomedicines: Legal Aspects, Intellectual Property and Grant OpportunitiesBerlinSpringer2012401434
- LuYWuKLiLCharacterization and evaluation of an oral microemulsion containing the antitumor diterpenoid compound ent-11alpha-hydroxy-15-oxo-kaur-16-en-19-oic-acidInt J Nanomedicine201381879188623690685
- BorhadeVPathakSSharmaSPatravaleVFormulation and characterization of atovaquone nanosuspension for improved oral delivery in the treatment of malariaNanomedicine (Lond)20149564966623927590
- AkhtarFRizviMMKarSKOral delivery of curcumin bound to chitosan nanoparticles cured Plasmodium yoelii infected miceBiotechnol Adv201230131032021619927
- WangHLiQReyesSNanoparticle formulations of decoquinate increase antimalarial efficacy against liver stage Plasmodium infections in miceNanomedicine201410576523891618
- WengTJianpingQYiLuThe role of lipid-based nano delivery systems on oral bioavailability enhancement of fenofibrate, a BCS II drug: comparison with fast-release formulationsJ Nanobiotechnology2014123925248304
- ElmesNJNasveldPEKitchenerSJKociskoDAEdsteinMDThe efficacy and tolerability of three different regimes of tafenoquine versus primaquine for post-exposure prophylaxis of Plasmodium vivax malaria in the Southwest PacificTrans R Soc Trop Med Hyg2008102111095110118541280
- SethiMSukumarRKarveSEffect of drug release kinetics on nanoparticle therapeutic efficacy and toxicityNanoscale2014642321232724418914