
Abstract
Due to their high X-ray attenuation, gold nanoparticles (GNPs) emerged as preclinical contrast agents by giving high vasculature contrast. For this reason, GNPs are regularly applied for computed tomography (CT) imaging of tumors but not for the visualization of inflammation. The aim of this study was to evaluate the biocompatibility and applicability of preclinical GNPs (AuroVist™) of two different sizes (1.9 nm and 15 nm) for the detection of inflammation-associated phagocytes in early-stage edema. Both GNP variants were stable under in vitro conditions and achieved high micro-CT (mCT) contrast after embedment into agarose. Fifteen-nanometer GNPs were detected after uptake into macrophages via mCT imaging exhibiting higher X-ray contrast than cells treated with 1.9 nm GNPs and untreated ones. Both 1.9 nm and 15 nm GNPs exhibited good biocompatibility on murine macrophages according to ATP and cellular dehydrogenase levels. Reactive oxygen species levels produced by phagocytic cells decreased significantly (P≤0.05) after co-incubation with GNPs regardless of the size of the nanoparticle (NP) in comparison to untreated control cells. In vivo mCT studies of inflammation imaging revealed that GNPs with a diameter of 15 nm accumulated within subcutaneous edema 2 hours after injection with a maximum signaling 8 hours postinjection and could be detected up to 48 hours within the edema region. In contrast, 1.9 nm GNPs were not shown to accumulate at the site of the inflammation region and were mostly excreted via the renal system 2–4 hours after injection. In conclusion, our study demonstrated that both GNP variants (1.9 nm and 15 nm) were stable and biocompatible under in vitro conditions. However, only 15 nm NPs have the potential as contrast agent for phagocyte labeling and applications in CT imaging of inflammation on a cellular level.
Introduction
Gold nanoparticles (GNPs) have been investigated in multiple preclinical approaches. In this context, they have been particularly considered for photothermal therapy of tumors, by which heat is generated due to intense surface-plasmon resonance absorption of gold nano-spheres, -stars, and -rods.Citation1–Citation3 In addition, GNPs are promising as contrast media in several computed tomography (CT) imaging approaches due to the high attenuation coefficient of gold providing a greater contrast than commonly used iodine contrast agents.Citation4–Citation6
Gold has mainly been considered for tumor imagingCitation7,Citation8 frequently by taking advantage of the progressive permeation through transendothelial pores on tumor blood vessels (the enhanced permeability and retention effect) after intravenous (iv) application.Citation9 Some studies also achieved good CT imaging contrast after intratumoral injection of GNPs in xenograft tumor mouse models.Citation10–Citation12
GNPs have never been considered for the detection of inflammation, although the incidence of severe chronic inflammable diseases, such as ulcerative colitis and Crohn’s disease, has increased during the 20th century in North America and Western Europe.Citation13 Additionally, low chronic inflammations are also regarded to be one of the main reasons for the development of most age-related diseases like atherosclerosis, cardiovascular diseases, type 2 diabetes, Alzheimer’s disease, and cancer.Citation14–Citation19 Since nearly 20% of cancers are preceded by chronic inflammation,Citation20 the detection of early stages of inflammation is of particular importance.
Today, the central approaches for CT imaging in the detection of inflammation are based on the visualization of hard tissue components, such as the evaluation of bone erosion occurring during rheumatoid arthritis.Citation21–Citation23 Soft tissue contrast can be achieved by the use of iodine-based contrast agents. Unfortunately, these contrast agents exhibit highly nonspecific vascular permeation. However, they are quickly cleared by the renal system and can display renal toxicity in some patients.Citation4,Citation5,Citation24 Moreover, intravenously applied iodinated contrast agents do not display inflammation on a cellular level, since they accumulate in the joints merely by perfusion. Thus, to enhance joint soft tissue, invasive techniques like CT-based arthrography are performed where an iodinated contrast agent has to be injected intra-articularly. This procedure is associated with the risk of allergy, infection, or chemical synovitis.Citation25,Citation26 Therefore, the detection of phagocytes, a key cellular marker of inflammation, can be challenging.
In contrast to the commonly used contrast agents, GNPs are favorable for CT imaging on a cellular level, since they have been shown to detect tumor cells in vitro and in vivo.Citation6,Citation27–Citation31 Nevertheless, uptake and biocompatibility of several GNPs are controversially discussed. Some studies declare them as nontoxic,Citation32 but some see their toxic potentialCitation33 to depend on size, surface chemistry, and shape of the GNPs.Citation34–Citation37 As a result, it was suggested that negatively charged serum protein-coated GNPs can induce cell damage through extrinsic and intrinsic apoptotic pathways.Citation38 In contrast to that, citrate-coated GNPs were found to have less cytotoxic and oxidative stress potential and inhibit the nitric oxide production in macrophages when coated with thiolated polyethylene glycol.Citation39 Consequently, the attendance of manifold variants of GNPs inevitably exhibits various nanoparticle (NP) characteristics which might lead to diverse impacts when applied to cells. Thus, GNPs which are intended to be applied as contrast agent have to be examined very carefully before in vivo application.
Preclinical GNPs as contrast agents are available for tumor or kidney imagingCitation40–Citation43 but have never been considered to image early-stage inflammation via the detection of inflammation-associated cells like macrophages. Furthermore, until now, their impact on metabolic activities of these cells has not been evaluated.
Therefore, we sought to analyze the utility of the preclinical contrast agent AuroVist™ for the detection of early-stage edema and asked the following questions: 1) Does the NP size of these preclinical GNPs has an impact on the CT contrast after internalization in phagocytes? 2) From the knowledge of controversial impacts of GNPs on cells, we included two different GNP diameters into our studies and asked how size impacts uptake and biocompatibility on inflammation-associated cells as well as the detectability of inflammation in vivo.
Materials and methods
Physicochemical characterization of AuroVist™ NPs
AuroVist™ GNPs 1.9 nm and 15 nm were purchased from BIOTREND Chemikalien GmbH (Köln, Germany). The hydrodynamic diameter and zeta potential of GNPs Auro-Vist™ 1.9 nm and 15 nm were assessed using a photon correlation spectrometer (Zetasizer Nano-ZS, Malvern Instruments, Herrenberg, Germany). Prior to use, AuroVist™ 1.9 nm was dissolved in phosphate-buffered saline in a concentration of 200 mg/mL and filtered through a 0.2 μm filter as mentioned by the manufacturer. AuroVist™ 15 nm was used as a 200 mg/mL solution as provided. For physicochemical characterization, both NP samples were diluted in deionized water to a final particle concentration of 0.05 mg/mL. For assessment of the mean NP diameters, dynamic light scattering was performed, and an average of five measurements was taken. To assess an average value for zeta potential, three measurements were performed each with ten runs at 25°C.
Cell culture of murine macrophage cell line J774A.1
To reveal the uptake and effect of AuroVist™ NPs on blood cells, the murine macrophage cell line J774A.1 (CLS Cell Lines Service GmbH, Eppelheim, Germany) was cultured in Dulbecco’s Modified Eagle’s Medium (DMEM)/F-12 (1:1) with L-glutamine (Gibco, Darmstadt, Germany) and 10% fetal calf serum (Gibco) at 37°C in a 5% CO2 atmosphere. Cells were harvested by scraping when confluency nearly reached a value of 80%. Murine macrophages were used for the following experiments as mentioned below.
Elucidation of the metabolic impact of AuroVist™ NPs on murine macrophages via ATP and MTS assay
The biocompatibility of AuroVist™ NPs after co-incubation with murine macrophages was determined via the ATP and MTS assay. For this purpose, 1.7×10⁴ J774A.1 cells/cm2 were seeded into 96-well plates and cultivated for 24 hours. NP suspensions diluted in medium in a concentration range between 0.1 μg Au/mL and 100 μg Au/mL were added to the wells according to the gold content. As a control for normal metabolic activity, untreated cells receiving fresh medium were used. As a positive control for cell damage, 1% or 5% dimethyl sulfoxide (DMSO) in DMEM was added to cells. After 24 hours or 48 hours, cells were washed with fresh cell culture medium. Subsequently, the ATP assay (CellTiter-Glo® Luminescent Cell Viability Assay, Promega, Mannheim, Germany) was performed as stated by the manufacturer. Measurement of luminescence intensity was performed using LUMIstar Galaxy (BMG LABTECH GmbH, Ortenberg, Germany).
The relative dehydrogenase activity of macrophages after co-incubation with AuroVist™ NP was determined by reduction of MTS tetrazolium salt [3-(4,5-dimethylthiazol-2-yl)-5-(3-carboxymethoxyphenyl)-2-(4-sulfophenyl)-2H-tetrazolium, inner salt] to water-soluble formazan product. Twenty-four-hour or 48-hour NP treatment was performed as mentioned above. Performance of the MTS assay (Cell-Titer 96® AQueous One Solution Cell Proliferation Assay, Promega) followed the manufacturing instructions. Due to increased absorption of NP deposits on the bottom of the plates, 100 μL of supernatant was transferred into a new 96-well plate, and formazan product was measured via absorption at 490 nm. ATP and MTS data were given as relative values to untreated control cells which were set to be 100% viable. All experiments were performed in triplicates with six replicate samples each.
Identification of the production of reactive oxygen species in murine macrophages after co-incubation with AuroVist™ NPs
To determine the potential effect of AuroVist™ NPs on cellular reactive oxygen species (ROS) production, an ROS-Assay-Kit (OxiSelect™ Intracellular ROS-Assay Kit, CELL BIOLABS, Inc., BIOCAT GmbH, Heidelberg, Germany) was used. For this purpose, 1.4×10⁴ J774A.1 cells/cm2 were seeded into 96-well plates and grown for 24 hours. Supernatant of the cells was discarded and replaced by different NP concentrations in culture medium (0.5–100 μg Au/mL). Untreated cells served as a control for ROS production under normal cell culture conditions. One percent and 5% DMSO solution in medium served as a positive control for ROS production. Twenty-four hours or 48 hours after co-incubation, murine macrophages were washed with Hank’s Balanced Salt Solution (HBSS) and subsequently treated with 100 μM nonfluorescent dichlorodihydrofluorescin diacetate medium solution and incubated for 45 minutes under dark conditions. Subsequently, cell lysis was performed with 1% triton X-100 in HBSS (100 μL per well) to gain the fluorescence signal of ROS-oxidized 2′,7′-dichlorodihydrofluorescein (DCF). The samples were measured via evaluation of the fluorescence intensity at 530 nm after excitation at 480 nm using a microplate fluorescence reader (TECAN infinite M200, TECAN, Crailsheim, Germany). The percentage of fluorescent DCF was calculated in relation to untreated control cells. The experiment was performed three times with six replicate samples each.
In vitro determination of AuroVist™ mCT imaging properties – phantom studies
To investigate the imaging properties of immobilized AuroVist™ NPs for CT, sole GNPs or GNP-labeled murine macrophages were embedded in 1% agarose. For this purpose, AuroVist™ 1.9 nm and 15 nm NPs were diluted in 60°C warm 1% agarose in ascending concentrations (0 mM, 1 mM, 5 mM, 10 mM, 50 mM, and 100 mM Au), stirred, and transferred to a reaction tube on ice. Measurement of phantoms was performed at 65 kV using an in vivo mCT scanner TomoScope® Synergy Twin imaging system (CT Imaging GmbH, Erlangen, Germany).
To assess the macrophage cell-labeling efficiency with GNPs, 3×10⁶ J774A.1 cells were grown for 48 hours under humidified conditions and were incubated for 24 hours with AuroVist™ 1.9 nm and 15 nm (100 μg Au/mL culture medium). Control cells received fresh medium instead of NPs. After co-incubation, cells were washed and harvested by scraping. Cells were fixed with 4% formaldehyde in HBSS, and pellets were measured using a standard protocol at 65 kV in an in vivo mCT scanner TomoScope® Synergy Twin imaging system. The calculation of agarose phantom and pellet contrast values was performed by using the software Imalytics (Philips GmbH, Hamburg, Germany) generating Hounsfield Unit (HU) values as mean. Error bars confer to the minimum and maximum of the mean values.
mCT imaging of AuroVist™ after application in edema-bearing mice
To investigate the ability of AuroVist™ NPs to detect inflammation, 10-week-old male Naval Medical Research Institute (NMRI) mice were subcutaneously injected at the right hind leg with 40 μL of 1% zymosan A solution to induce edema. As a control for specific edema development, isotonic NaCl solution (0.9%) was injected subcutaneously at the left hind leg instead of zymosan A solution. Subsequently, mice were injected intravenously with either 40 mg AuroVist™ 1.9 nm (n=4) or 15 nm (n=3) in a 200 μL solution (according to 200 g Au/L). Edema-bearing mice without iv injection of NPs served as a control for NP distribution and edema development (n=3). In order to follow the NP distribution, the abdomen of the mice was scanned with an in vivo mCT scanner TomoScope® Synergy Twin imaging system using a standard protocol with 65 kV. Three-dimensional anatomical pictures were gained using Imalytics software. ImpactView software (CT Imaging GmbH) was used to generate image slices and for region of interest measurement. Forty-eight hours after GNP application, edema (right hind leg) and control region (left hind leg) of mice were prepared for macroscopical evaluation. The mice studies were approved by the regional animal committee and were in accordance with international guidelines on the ethical use of animals. During the imaging experiments animals were anesthetized using oxygen with 2% isoflurane (Actavis, Germany).
Statistical analysis
Data are represented as mean ± standard deviation. Excel was applied for statistical analysis by using the two-tailed Student’s t-test. Calculated P-values of 0.05 or less were considered statistically significant.
Results
Physicochemical characterization of AuroVist™ NPs
Our data show that the zeta potential was negative for both GNPs (1.9 nm: −43.0 mV and 15 nm: −32.1 mV). The hydrodynamic diameter of the GNPs was slightly increased in comparison to data for the NP size provided by the manufacturer (5.8 nm and 36.4 nm for 1.9 nm and 15 nm NPs, respectively) with low polydispersity indices indicating a low agglomeration state and stable particle suspension ().
Table 1 Physicochemical characterization of AuroVist™ nanoparticles representing hydrodynamic diameter (size) and zeta potential of AuroVist™ 1.9 nm and 15 nm in deionized water
AuroVist™ phantom studies
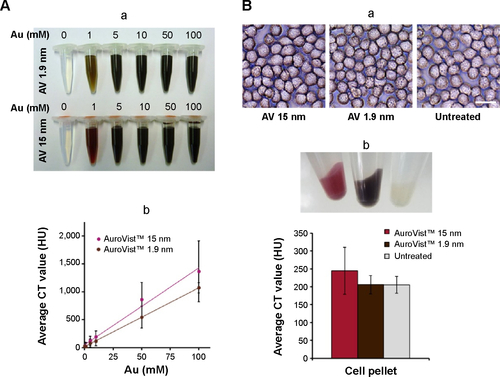
Our mCT studies on the comparison of the imaging qualities of two different diameters of AuroVist™ revealed that 15 nm GNPs embedded in 1% agarose () tended to exhibit a higher contrast compared to 1.9 nm GNPs (). At a concentration of 100 mM Au for AuroVist™ 1.9 nm and 15 nm, CT values of approximately 1,071 HU and 1,366 HU, respectively, were achieved. The co-incubation of the GNPs with murine macrophages revealed that they are not visible after uptake into these cells via light microscopy (). On the other hand, no agglomerations of the GNPs were detected, which indicated that they were stable under in vitro conditions. After centrifugation of the cells, internalized GNPs were visible as pink- (15 nm GNPs) or brown-colored (1.9 nm GNPs) cell pellets (). mCT measurement of the cell pellets revealed that AuroVist™ 15 nm-treated cells provide higher contrast than cells which were co-incubated with 1.9 nm GNPs (). Furthermore, 1.9 nm GNP- labeled macrophages revealed similar mCT contrast like untreated cells.
Biocompatibility of AuroVist™ NPs
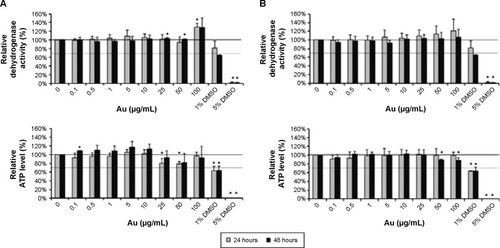
The in vitro biocompatibility assays on murine macrophages indicated that the dehydrogenase level of these cells was not altered by NP addition regardless of the size of the NP (). In comparison to untreated control cells, the ATP level was only slightly decreased by addition of AuroVist™ 1.9 nm in a concentration of 25 μg/mL and 50 μg/mL (). On the other hand, ATP level of murine macrophages did not decrease after exposure to 15 nm GNPs. Overall, both GNP formulations are highly biocompatible (50 μg Au/mL, cell viability >70% according to DIN EN ISO 109935) also in high concentrations.
Figure 1 Biocompatibility of AuroVist™ 1.9 nm and 15 nm on murine macrophages.
Notes: J774A.1 cells were incubated for either 24 hours or 48 hours with increasing concentrations of AuroVist™ (A) 1.9 nm or (B) 15 nm nanoparticles. Relative cellular dehydrogenase activity and ATP level after NP co-incubation were assessed and were referred to the data of untreated control cells. Cell medium containing 1% and 5% DMSO was used for cell-death positive control. Three independent experiments with six repetitions each were performed. Results are represented as mean value ± standard deviation, and significant values (*P≤0.05) are compared to untreated control cells.
Abbreviations: NP, nanoparticle; DMSO, dimethyl sulfoxide; APT, adenosine triphosphate.
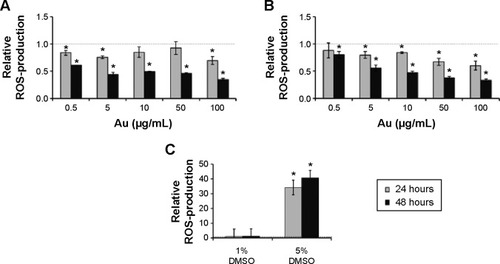
Compared to untreated cells, the ROS level decreased significantly (P≤0.05) with higher concentrations of GNPs and over time (stronger effect was seen after 48 hours) after incubation with AuroVist™ NP, regardless of the GNP size ().
Figure 2 ROS production of murine macrophages after co-incubation with AuroVist™ 1.9 nm and 15 nm.
Notes: J774A.1 cells were incubated for either 24 hours or 48 hours with increasing concentrations of AuroVist™ (A) 1.9 nm or (B) 15 nm nanoparticles. (C) Cells were treated with 1% or 5% DMSO solution for positive control of ROS production. The generation of ROS was referred to the ROS production of untreated control cells (dotted line). Three independent experiments with six repetitions each were performed. Results are represented as mean value ± standard deviation, and significant values (*P≤0.05) are compared to untreated control cells.
Abbreviations: ROS, reactive oxygen species; DMSO, dimethyl sulfoxide.
CT imaging of hind leg edema with AuroVist™
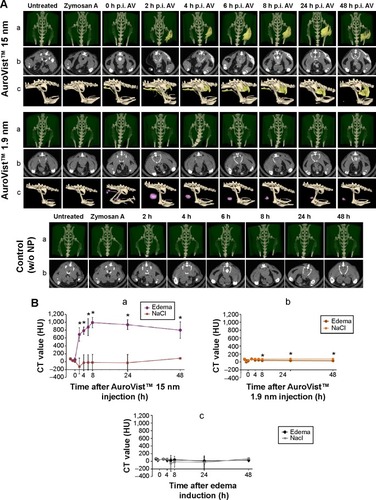
In vivo mCT imaging revealed that accumulation of Auro-Vist™ 15 nm in the edema region (right hind leg) was visible 2 hours postinjection of the GNPs and edema induction (). Steady accumulation of AuroVist™ 15 nm took place until 8 hours postinjection with a maximum mCT value of approximately 1,000 HU; it decreased 24 hours after injection (). From 2 hours after GNP injection, mCT signaling within the edema region was significantly higher (P≤0.05) compared to the signal of the control region exhibiting no edema (left hind leg) (). Directly (1 minute) after injection of AuroVist™ 15 nm, mice exhibited bluish skin color which was consistent over the 48-hour period of observation. Directly after administration of AuroVist™ 15 nm and up to 8 hours after application, in the abdominal region of the mice, greater blood vessels were enhanced via mCT signals (). However, for AuroVist™ 15 nm, there were no enhanced mCT signals in the animals’ kidneys and bladder detected whereas mCT signaling within these regions was increased after application of AuroVist™ 1.9 nm. Instead, AuroVist™ NPs 1.9 nm GNPs were not observed to accumulate within the edema region. They were secreted via the kidneys and bladder predominantly 2–4 hours after iv injection (). Thus, mCT signals from the edema region did not differ from the control region for these animals and were similar to animals which did not receive NP injection ( and B). Preparation of animals 48 hours after edema induction and NP administration revealed that after removing skin from the edema, both edema and the surrounding muscle tissue were colored strongly in blue. The same observation was made for the muscle tissue of the control region (left hind leg) after subcutaneous injection of NaCl solution instead of zymosan A (data not shown).
Figure 3 In vivo mCT imaging of AuroVist™ 1.9 nm and 15 nm after iv application in a hind leg edema model.
Notes: NMRI mice were subcutaneously injected with zymosan A solution to induce edema at the right hind leg. Subcutaneous injection of NaCl solution at the left hind leg served as a control for edema development. After subsequent iv injection of either AuroVist™ 1.9 nm or 15 nm (40 mg gold per animal), mice were scanned every 2 hours up to 48 hours after NP application. Mice without NP application served as a control for physiological edema contrast. (A) mCT images of mice abdomen in three-dimensional dorsal view (a), axial view (b), or three-dimensional lateral view (c) after edema induction and iv application of NPs or without NPs (control). AuroVist™ 15 nm could be detected within edema region from 2 hours post-application (colored in yellow), whereas AuroVist™ 1.9 nm NPs did not accumulate there and were excreted via the bladder (colored in pink). Control mice did not show enhanced edema mCT signaling. (B) mCT signaling of the hind leg edema and control regions (NaCl) from animals after treatment with AuroVist™ 15 nm (a) and 1.9 nm (b) and from animals without GNP treatment (c). Mean contrast values were obtained from ROI measurement within edema and control region of at least three animals for each group. Significant changes (*P≤0.05) in the signal intensity of the edema region compared to the control region were detected for animals with AuroVist™ 15 nm treatment.
Abbreviations: mCT, micro-computed tomography; iv, intravenous; NP, nanoparticle; GNP, gold nanoparticle; h, hours; w/o, without; CT, computed tomography; p.i., postinjection; AV, AuroVist™; NMRI, swiss-type mouse strain originally from Naval Medical Research Institute; HU, Hounsfield Unit.
Discussion
Our study on AuroVist™ GNPs (1.9 nm and 15 nm) revealed that both tested variants are biocompatible on murine macrophages in vitro, whereas only 15 nm NPs were able to enhance mCT signaling of phagocytes in vitro and to detect soft tissue inflammation in vivo.
The negative zeta potential of AuroVist™ NPs 1.9 nm and 15 nm is an indication that these NPs are biocompatible. Consequently, they will not primarily act as membranotropic reagent like polycations which influence the negative zeta potential of human cells like mononucleocytes.Citation44 Additionally, the narrow size distribution and low agglomeration state of both NPs reflected that they were in a stable condition for their application as contrast agent in preclinical settings.
Interestingly, AuroVist™ NPs with a diameter of 15 nm led to a higher mCT contrast in comparison to 1.9 nm after embedment into agarose and after cellular uptake into murine macrophages. On the one hand, this was due to the higher diameter of the 15 nm NPs which might reveal stronger absorption and scattering effects of the X-rays than smaller NPs with a diameter of 1.9 nm. On the other hand, active phagocytosis of larger GNPs in contrast to smaller ones leads to a higher contrast after cellular uptake. For colloid GNPs of a hydrodynamic diameter of 30 nm, it was previously reported that they were taken up by macrophages via scavenger receptor, clathrin- and caveolin-mediated pathways.Citation45 Thus, we conclude that AuroVist™ 15 nm was taken up stronger by the phagocytes than 1.9 nm NPs and thus is suitable for imaging of macrophages in vitro.
Our observations on the impact of AuroVist™ NPs on cellular dehydrogenase and ATP level of murine macrophages lead to the conclusion that both NP sizes had no negative impact on cellular metabolism. Thus, neither negatively charged 1.9 nm nor 15 nm NPs had negative effects on J774A.1 phagocyte dehydrogenase level. This result is different from previous data where negatively charged AuNP-MUA NP decreased cellular dehydrogenase levels on RAW 264.7 phagocytes and relatively small NPs (16 nm) revealed higher toxicity than large particles.Citation35 Thus, we conclude that the biocompatibility of GNPs depends not only on surface functionalization but also on the tested cell line and cell types. In agreement with data from Taylor et al who found that multiple NP properties such as size, zeta potential, and surface functionalization can determine their toxic effects on cells,Citation46 we conclude that AuroVist™ GNPs are nontoxic to murine macrophages, but these data may not be transferred to other GNPs exhibiting similar size or zeta potential. Moreover, the adsorption of a protein corona to the NP, which might differ due to size or surface of the NP,Citation35 can affect NP uptake or interaction with the phagocytes. Consequently, each NP type exhibits different properties which can directly or indirectly impact NP biocompatibility which has to be considered when measuring cell viability. Accordingly, results indicating the mediation of intracellular ROS generation after co-incubation with GNPsCitation33 cannot be translated universally to every variant of GNP. Therefore, the production of ROS after co-incubation of AuroVist™ NPs with murine macrophages was investigated, and we found that there was no negative effect at all on J774A.1 phagocytes. Furthermore, significantly lower (P≤0.05) ROS levels after NP co-incubation compared to cells without NP treatment showed that AuroVist™ NPs are highly biocompatible, most likely due to providing an antioxidative effect. Our findings coincide with previous observations revealing that GNPs can act as an antioxidative agent, by inhibiting the formation of ROS, scavenging free radicals,Citation47 reasoning that AuroVist™ NPs could exhibit similar effects on cells. Earlier studies revealed that transition metal NPs can be used as antioxidants because of their high reduction potentialCitation48 and thus can also act on an enzymatic level leading to increases in endogenous antioxidant enzymes in streptozotocin-induced diabetic mice.Citation47 Moreover, gold compounds can act on a transcriptional level as observed for gold(I) drugs by the induction of cellular antioxidative stress genes.Citation49
Our in vivo imaging experiments demonstrated that accumulation of AuroVist™ NPs in the edema region is specific for 15 nm NPs. According to the mCT contrast value of approximately 1,000 HU obtained from 50 mM AuroVist™ embedded in agarose, a maximum CT contrast value up to 1,000 HU, which was detected within the edema region 8 hours after injection of AuroVist™ 15 nm, will be reached when an Au concentration of approximately 50 mM accumulated within the site of inflammation. By injection of a total NP dose per animal of 40 mg Au, according to 200 μL AuroVist™ with 200 g Au/L (equivalent to 1,015 mM Au), we conclude that approximately 5% of the applied Au dose has reached the edema region. After iv injection, AuroVist™ 15 nm might be taken up by blood-circulating phagocytes subsequently migrating to the site of edema and leading to an increase in signaling from 2 hours up to 8 hours after application and a decrease 24 hours after NP application. This accumulation kinetics has also been shown by utilization of liposomes to target edema regions.Citation50 Furthermore, the course of GNP accumulation within the edema region resulting in a maximum at 24 hours after iv injection follows closely the accumulation pattern described for macrophages migrating to the inflammation site after zymosan A induction.Citation51 These data exhibited that there occurs an attraction of monocytes and macrophages to the site of the zymosan A injection in a peritonitis model with a steady increase in recruited cells between 6 hours and 24 hours. Consequently, it is most likely that phagocytes from blood take up these NPs, since it has been shown that GNPs (eg, 5–30 nm in diameter) preferentially accumulate in the spleen and liver, which contain phagocytic cells.Citation4 Several other studies support our observations on phagocyte labeling using AuroVist™ 15 nm by proving that GNPs with similar size accumulate within cells of the mononuclear phagocytic system (MPS) after organ examination. In this context, NPs with a diameter of 20 nm accumulated in organs of the phagocyte-rich MPS including the liver and spleen.Citation52 The authors concluded that these GNPs efficiently accumulate within these cells due to opsonization. In addition, it was shown before that NPs with a higher diameter (~40 nm) and negatively charged GNPs were taken up by phagocytes in advance to positively charged or smaller NPs,Citation35 demonstrating that AuroVist™ 15 nm with a hydrodynamic diameter of 36 nm and a negative zeta potential might behave similarly. Consequently, it is most likely that the mCT signals of edema occur to an extent due to the uptake of negatively charged 15 nm AuroVist™ NPs into phagocytic cells from the blood stream subsequently migrating to the edema region.
However, blue skin color of the mice which was macroscopically visible directly after iv injection (15 nm GNPs) and constantly up to 48 hours thereafter as well as the mCT signal enhancement of greater blood vessels in the abdominal region of mice up to 8 hours revealed that AuroVist™ 15 nm NPs seem to persist after injection throughout the vascular system of the animal and are not excreted via the kidneys which is also mentioned for these GNPs by the manufacturer. This behavior is beneficial for the anatomical depiction of blood vessels via CT imaging which is still possible at 2 days and 3 days after injection.Citation40 Coinciding with our results in edema persistence of the GNPs up to 48 hours, previous data show that polyethylene glycol-coated GNPs, approximately 30 nm in diameter, show blood circulation times longer than 4 hours resulting in a clear delineation of cardiac ventricles and great vessels.Citation4 From the reason that edema and surrounding muscle tissues were colored completely blue 48 hours after GNP application, we conclude that even small blood vessels were still filled with AuroVist™. Due to the fact that infiltration of macrophages and monocytes takes place in the initial phases (6–24 hours) of edema development,Citation51 after 48 hours of initiation, the edema was already subsiding, and histology of phagocytes would not be beneficial. Additionally, like previously observed for edema development, the recruitment of phagocytes to the inflammable region drastically reduces 24 hours after edema initiation which was shown by monocyte tracking with fluorescently labeled liposomes.Citation50 Thus, we propose that the labeling of these cells within the edema region would not be possible 48 hours after edema initiation and remaining phagocytes including NPs would not be distinguishable from surrounding tissues via histology. Furthermore, due to the fact that the edema consists mainly of exudate (pus), cutting and subsequent histology of cells located within the fluids were not practicable. Thus, we cannot exclude that accumulation of 15 nm GNPs within the edema region could also be contributed due to perfusion effects to a certain extent.
In contrast, there was no detectable accumulation of low-diameter GNPs (AuroVist™ 1.9 nm) within the edema region. Moreover, edema signaling of AuroVist™ 1.9 nm-treated mice resembled animals which did not receive NPs. Consequently, 1.9 nm NPs were too small to be taken up by the macrophages from the blood system, and migration of NP-labeled phagocytes to the site of inflammation did not occur. Regarding mCT application, AuroVist™ 1.9 nm is preliminarily used for the achievement of vascular contrast even of small vessels for tumor and kidney imaging.Citation43 Thus, we conclude from the mCT signal obtained for AuroVist™ 1.9 nm which was evident preliminarily within the bladder that the smaller NPs do not achieve contrast for early stages of inflammation also by means of the fast renal clearance of these NPs. Even if NP perfusion throughout the vessels of edema occurred by using 1.9 nm GNPs, in contrast to AuroVist™ 15 nm, they could not provide sufficient mCT contrast for inflammation imaging. Consequently, AuroVist™ 1.9 nm and 15 nm differ for the mode of application concerning edema imaging depending on the size of the NP. In terms of inflammation, 15 nm NPs have the potential to be an appropriate tool for the visualization of inflammable processes. With regard to that, we suggest an application for the 15 nm NPs for preclinical use in small animals for studying inflammation processes and therapeutic effects of anti-inflammatory drugs.
In conclusion, our studies on the size dependence of preclinical AuroVist™ 1.9 nm and 15 nm on stability, mCT imaging properties in vitro, biocompatibility on phagocytes, and edema studies revealed an evident trend. Besides the fact that both NP variants were stable and exhibited good biocompatibility, only AuroVist™ 15 nm is beneficial for the detection of murine macrophages in vitro and for the preclinical application in small animals for the detection of early stages of edema. NP accumulation within edema was most likely to be obtained due to NP uptake into edema-migrating phagocytes. Overall, we demonstrated the suitability of preclinical AuroVist™ 15 nm GNPs as a promising contrast medium for studying the progression of inflammation via mCT imaging.
Acknowledgments
The authors would like to kindly acknowledge the support of the Bundesministerium für Bildung und Forschung (BMBF) (project NanoMed). They would also like to thank Yvonne Ozegowski and Heidi Dähring for technical assistance and valuable directions during the mCT-imaging studies. Furthermore, they thank Ian Wright for proofreading the manuscript.
Supplementary material
Figure S1 In vitro mCT imaging of AuroVist™ 1.9 nm and 15 nm after embedding in 1% agarose and after uptake into murine macrophages.
Notes: (A) Ascending concentrations of AuroVist™ 1.9 nm and 15 nm NPs were embedded in 1% agarose (a), and contrast properties investigated via mCT (b). (B) Murine macrophages (J774A.1 cells) were co-incubated for 24 hours with 100 μg/mL AuroVist™ 1.9 nm and 15 nm. Untreated cells were used as a control for natural cell contrast. After 24 hours of co-incubation, cells were investigated under the microscope (a) (scale bar: 25 μm), subsequently harvested, and CT values of cell pellets were investigated via mCT measurement (b).
Abbreviations: mCT, micro-computed tomography; CT, computed tomography; AV, AuroVist™.
Disclosure
The authors report no conflicts of interest in this work.
References
- ElbialyNAbdelhamidMYoussefTLow power argon laser-induced thermal therapy for subcutaneous Ehrlich carcinoma in mice using spherical gold nanoparticlesJ Biomed Nanotechnol20106668769321361134
- HuangXJainPKEl-SayedIHEl-SayedMAGold nanoparticles: interesting optical properties and recent applications in cancer diagnostics and therapyNanomedicine20072568169317976030
- Rodriguez-OliverosRSanchez-GilJAGold nanostars as thermoplasmonic nanoparticles for optical heatingOpt Express201220162162622274385
- KimDParkSLeeJHJeongYYJonSAntibiofouling polymer-coated gold nanoparticles as a contrast agent for in vivo X-ray computed tomography imagingJ Am Chem Soc2007129247661766517530850
- LeungKGold nanoparticlesMolecular Imaging and Contrast Agent Database (MICAD)Bethesda, MDNational Center for Biotechnology Information Created: October 26, 2006; Last Update: March 8, 2011
- LiuHXuYWenSTargeted tumor computed tomography imaging using low-generation dendrimer-stabilized gold nanoparticlesChemistry201319206409641623505030
- SunICNaJHJeongSYBiocompatible glycol chitosan-coated gold nanoparticles for tumor-targeting CT imagingPharm Res20143161418142523934255
- PengCZhengLChenQPEGylated dendrimer-entrapped gold nanoparticles for in vivo blood pool and tumor imaging by computed tomographyBiomaterials20123341107111922061490
- ShiloMReuveniTMotieiMPopovtzerRNanoparticles as computed tomography contrast agents: current status and future perspectivesNanomedicine20127225726922339135
- ChandaNUpendranABooteEJGold nanoparticle based X-ray contrast agent for tumor imaging in mice and dog: a potential nano-platform for computer tomography theranosticsJ Biomed Nanotechnol201410338339224730234
- WangHZhengLPengCComputed tomography imaging of cancer cells using acetylated dendrimer-entrapped gold nanoparticlesBiomaterials201132112979298821277019
- WangHZhengLPengCShenMShiXZhangGFolic acid-modified dendrimer-entrapped gold nanoparticles as nanoprobes for targeted CT imaging of human lung adencarcinomaBiomaterials201334247048023088841
- NorgardBMNielsenJFonagerKKjeldsenJJacobsenBAQvistNThe incidence of ulcerative colitis (1995–2011) and Crohn’s disease (1995–2012) – Based on nationwide Danish registry dataJ Crohns Colitis20148101274128024675473
- FranceschiCCampisiJChronic inflammation (inflammaging) and its potential contribution to age-associated diseasesJ Gerontol A Biol Sci Med Sci201469suppl 1S4S924833586
- GurelBLuciaMSThompsonIMJrChronic inflammation in benign prostate tissue is associated with high-grade prostate cancer in the placebo arm of the prostate cancer prevention trialCancer Epidemiol Biomarkers Prev201423584785624748218
- HardbowerDMde SabletTChaturvediRWilsonKTChronic inflammation and oxidative stress: the smoking gun for Helicobacter pylori-induced gastric cancer?Gut Microbes20134647548123811829
- HunterPThe inflammation theory of disease. The growing realization that chronic inflammation is crucial in many diseases opens new avenues for treatmentEMBO Rep2012131196897023044824
- InvittiCObesità ed infiammazione sistemica cronica [Obesity and low-grade systemic inflammation]Minerva Endocrinol2002273209214 German12091795
- ManabeIChronic inflammation links cardiovascular, metabolic and renal diseasesCirc J201175122739274822067929
- FillonMDetails linking chronic inflammation and cancer continue to emergeJ Natl Cancer Inst2013105850951023524284
- DøhnUMEjbjergBJHasselquistMRheumatoid arthritis bone erosion volumes on CT and MRI: reliability and correlations with erosion scores on CT, MRI and radiographyAnn Rheum Dis200766101388139217606464
- YangSHollisterAMOrchardEAQuantification of bone changes in a collagen-induced arthritis mouse model by reconstructed three dimensional micro-CTBiol Proced Online201315823855709
- TopferDFinzelSMuseykoOSchettGEngelkeKSegmentation and quantification of bone erosions in high-resolution peripheral quantitative computed tomography datasets of the metacarpophalangeal joints of patients with rheumatoid arthritisRheumatology2014531657123893663
- KimDJeongYYJonSA drug-loaded aptamer-gold nanoparticle bioconjugate for combined CT imaging and therapy of prostate cancerACS Nano2010473689369620550178
- BerquistTHImaging of articular pathology: MRI, CT, arthrographyClin Anat19971011138986381
- NewbergAHMunnCSRobbinsAHComplications of arthrographyRadiology198515536056064001360
- LiJChaudharyAChmuraSJA novel functional CT contrast agent for molecular imaging of cancerPhys Med Biol201055154389439720647599
- HainfeldJFO’ConnorMJDilmanianFASlatkinDNAdamsDJSmilowitzHMMicro-CT enables microlocalisation and quantification of Her2-targeted gold nanoparticles within tumour regionsBr J Radiol201184100252653321081567
- JakobsohnKMotieiMSinvaniMPopovtzerRTowards real-time detection of tumor margins using photothermal imaging of immune-targeted gold nanoparticlesInt J Nanomedicine201274707471322956871
- AstolfoASchültkeEMenkRHIn vivo visualization of gold-loaded cells in mice using x-ray computed tomographyNanomedicine20139228429222841913
- LiKWenSLarsonACMultifunctional dendrimer-based nanoparticles for in vivo MR/CT dual-modal molecular imaging of breast cancerInt J Nanomedicine201382589260023888113
- ZhangQHitchinsVMSchrandAMHussainSMGoeringPLUptake of gold nanoparticles in murine macrophage cells without cytotoxicity or production of pro-inflammatory mediatorsNanotoxicology20115328429520849214
- ChuangSMLeeYHLiangRYExtensive evaluations of the cytotoxic effects of gold nanoparticlesBiochim Biophys Acta20131830104960497323811345
- KochFMollerAMFrenzMPielesUKuehni-BoghenborKMevissenMAn in vitro toxicity evaluation of gold-, PLLA- and PCL-coated silica nanoparticles in neuronal cells for nanoparticle-assisted laser-tissue solderingToxicol In Vitro201428599099824768613
- LiuXHuangNLiHJinQJiJSurface and size effects on cell interaction of gold nanoparticles with both phagocytic and nonphagocytic cellsLangmuir201329299138914823815604
- PanYNeussSLeifertASize-dependent cytotoxicity of gold nanoparticlesSmall20073111941194917963284
- TarantolaMPietuchASchneiderDToxicity of gold-nanoparticles: synergistic effects of shape and surface functionalization on micromotility of epithelial cellsNanotoxicology20115225426821050076
- ChoiSYJeongSJangSHIn vitro toxicity of serum protein-adsorbed citrate-reduced gold nanoparticles in human lung adenocarcinoma cellsToxicol In Vitro201226222923722178767
- DuLMiaoXJiaHDetection of nitric oxide in macrophage cells for the assessment of the cytotoxicity of gold nanoparticlesTalanta2012101111623158284
- NebuloniLKuhnGAMullerRA comparative analysis of water-soluble and blood-pool contrast agents for in vivo vascular imaging with micro-CTAcad Radiol201320101247125524029056
- ClarkDPGhaghadaKModingEJKirschDGBadeaCTIn vivo characterization of tumor vasculature using iodine and gold nanoparticles and dual energy micro-CTPhys Med Biol20135861683170423422321
- LusicHGrinstaffMWX-ray-computed tomography contrast agentsChem Rev201311331641166623210836
- HainfeldJFSlatkinDNSmilowitzHMThe use of gold nanoparticles to enhance radiotherapy in micePhys Med Biol20044918N309N31515509078
- BondarOVSaifullinaDVShakhmaevaIIMavlyutovaIIAbdullinTIMonitoring of the zeta potential of human cells upon reduction in their viability and interaction with polymersActa Naturae201241788122708066
- FrancaAAggarwalPBarsovEVKozlovSVDobrovolskaiaMAGonzalez-FernandezAMacrophage scavenger receptor A mediates the uptake of gold colloids by macrophages in vitroNanomedicine2011671175118821675859
- TaylorUBarchanskiAGarrelsWToxicity of gold nanoparticles on somatic and reproductive cellsAdv Exp Med Biol201273312513322101718
- BarathmanikanthSKalishwaralalKSriramMAnti-oxidant effect of gold nanoparticles restrains hyperglycemic conditions in diabetic miceJ Nanobiotechnology201081620630072
- NarayananKBParkHHPleiotropic functions of antioxidant nanoparticles for longevity and medicineAdv Colloid Interface Sci2013201304224206941
- KataokaKHandaHNishizawaMInduction of cellular antioxidative stress genes through heterodimeric transcription factor Nrf2/small Maf by antirheumatic gold(I) compoundsJ Biol Chem200127636340743408111429414
- TansiFLRügerRRabenholdMLiposomal encapsulation of a near-infrared fluorophore enhances fluorescence quenching and reliable whole body optical imaging upon activation in vivoSmall20139213659366923650267
- AjueborMNFlowerRJHannonREndogenous monocyte chemoattractant protein-1 recruits monocytes in the zymosan peritonitis modelJ Leukoc Biol19986311081169469480
- BalasubramanianSKJittiwatJManikandanJOngCNYuLEOngWYBiodistribution of gold nanoparticles and gene expression changes in the liver and spleen after intravenous administration in ratsBiomaterials20103182034204220044133