

Abstract
The current enhanced permeability and retention (EPR)-based approved nanomedicines have had little impact in terms of prolongation of overall survival in patients with cancer. For example, the two Phase III trials comparing Doxil®, the first nanomedicine approved by the US Food and Drug Administration, with free doxorubicin did not find an actual translation of the EPR effect into a statistically significant increase in overall survival but did show less cardiotoxicity. In the current work, we used a two-factor factorial experimental design with intraperitoneal versus intravenous delivery and nanomedicine versus free drug as factors to test our hypothesis that regional (intraperitoneal) delivery of nanomedicine may better increase survival when compared with systemic delivery. In this study, we demonstrate that bypassing, rather than exploiting, the EPR effect via intraperitoneal delivery of nanomedicine harboring a sustained-release function demonstrates dual pharmacokinetic advantages, producing more efficient tumor control and suppressing the expression of stemness markers, epithelial-mesenchymal transition, angiogenesis signals, and multidrug resistance in the tumor microenvironment. Metastases to vital organs (eg, lung, liver, and lymphatic system) are also better controlled by intraperitoneal delivery of nanomedicine than by standard systemic delivery of the corresponding free drug. Moreover, the intraperitoneal delivery of nanomedicine has the potential to replace hyperthermic intraperitoneal chemotherapy because it shows equal efficacy and lower toxicity. In terms of efficacy, exploiting the EPR effect may not be the best approach for developing a nanomedicine. Because intraperitoneal chemotherapy is a type of regional chemotherapy, the pharmaceutical industry might consider the regional delivery of nanomedicine as a valid alternative pathway to develop their nanomedicine(s) with the goal of better tumor control in the future.
Supplementary materials
Side population assay
The cell density was adjusted to 106 cells/mL with Dulbecco’s Modified Eagle’s Medium containing 2% fetal bovine serum and 5 μM Hoechst 33342 (Sigma-Aldrich, St Louis, MO, USA) and incubated for 90 minutes at 37°C. The negative control groups were treated with fumitremorgin C (10 μM, Sigma-Aldrich) for 30 minutes at 37°C prior to and during Hoechst 33342 staining. After two washes with phosphate-buffered saline, propidium iodide (2 μg/mL, Sigma-Aldrich) staining was used to exclude dead cells. The cells were kept at 4°C in the dark and then isolated using a BD FACSAria™ flow cytometer (BD Biosciences, San Jose, CA, USA).
Microsphere formation activity
The treated tumors were washed and subjected to enzymatic dissociation. The tumor cells were then resuspended in tumor sphere medium consisting of human recombinant epidermal growth factor (20 ng/mL; Sigma-Aldrich), β-fibroblast growth factor (20 ng/mL; Upstate Biotechnology Inc, Lake Placid, NY, USA), leukemia inhibitory factor (10 ng/mL; Chemicon International Inc, Temecula, CA, USA), neuronal survival factor (1×; Clonetics, Lonza, Walkersville, MD, USA), and N-acetylcysteine (60 μg/mL; Sigma-Aldrich) and plated at a density of 3×10⁶ live cells/60 mm plate. Red blood cells were removed using Lympholyte-M® (Cedarlane Laboratories, Burlington, ON, Canada). The cells were grown under these conditions for 10 days, and the nonadherent spheres that formed were counted.
RT-PCR for stemness marker
The total RNA from the cells was isolated using TRIzol reagent (Invitrogen, Carlsbad, CA, USA) according to the manufacturer’s instructions. The RNA samples were treated with deoxyribonuclease I (Invitrogen). Reverse transcription-polymerase chain reaction (RT-PCR) was performed using the Super-Script First-Strand Synthesis System (Invitrogen), and real-time PCR was performed using the Step One-Plus and SYBR-green system (Applied Biosystems, Warrington, UK). The internal control was 18s RNA. The primer sequences are listed in .
Annexin V/propidium iodide apoptosis assays
An in vivo xenograft model was used to detect apoptotic cells. The mice were intraperitoneally injected with ES-2 cells on day 0 (2×10⁵/each mouse, n=3). At days 9 and 11, the mice were treated by either intraperitoneal delivery of Nano-taxol or systemic delivery of Taxol®. Six hours after the last treatment, the mice were sacrificed, and the tumors were harvested and made into single-cell suspensions. A total of 106 harvested tumor cells were then stained with 5 μL of Annexin V-fluorescein isothiocyanate and 5 μL of propidium iodide (PI) (5 μg/mL, BD Bioscience) in 1× binding buffer (10 mM HEPES, pH 7.4, 140 mM NaOH, 2.5 mM CaCl2) for 15 minutes at room temperature, and apoptosis was determined using a FACSCalibur flow cytometer. Both early apoptotic (Annexin V+/PI−) and late apoptotic (Annexin V+/PI+) cells were regarded as cell death.
Cytometric detection and quantification of cells undergoing apoptosis, cells dying by necrosis, and cells remaining viable were performed as determined through preliminary studies. The definition of necrotic cells was predetermined using a protocol proposed by Reed and Mixter.Citation1 In brief, Jurkat cells treated with ethanol to induce necrosis provide these control populations.
Hyperthermic intraperitoneal chemotherapy
The open hyperthermic intraperitoneal chemotherapy (HIPEC) method was used because this technique is believed to provide optimal thermal homogeneity and spatial diffusion, and 250 mL of heated saline containing 10 mg/kg Taxol was administered to each animal in the HIPEC group. An inflow catheter was inserted into the upper abdomen between the hepatic and diaphragmatic surface, and an outflow catheter was placed at the pelvic floor. The perfusion solution was heated to 42.0°C±0.5°C and infused into the peritoneal cavity at a rate of 3 mL per minute through the inflow tube introduced from the automatic perfusion pump. The perfusion in the peritoneal cavity was stirred manually to obtain an equal spatial distribution. The temperature of the perfusion solution in the peritoneal space was maintained at 42.0°C±0.5°C and monitored using a thermometer. The total HIPEC time was 60 minutes, and the perfusion solution in the abdominal cavity was then removed.
Bioluminescence imaging
The animals were injected intraperitoneally with D-luciferin (300 mg/kg [0.05 mL/10 g of body weight]) and anesthetized 5 minutes before the peak luciferin uptake time (determined by a preliminary in vitro bioluminescence imaging experiment) with 2%–3% isoflurane. Isoflurane was reduced to 2% after transferring the animals to the imaging chamber. Dorsal and ventral bioluminescence imaging (maximum of five animals) was performed (IVIS®, PerkinElmer Inc, Waltham, MA, USA) at the optimal imaging time.
Figure S1 Therapeutic effects of intraperitoneal delivery of Nano-topotecan.
Notes: (A) Treatment schema. Both topotecan and Nano-topotecan were administered at an essential drug dose of 10 mg/kg/mouse per treatment. (B) Evaluation of therapeutic efficacy. The mice were implanted with ES-2 cells (2×10⁵ per mouse) on day 1 and were treated on days 5 and 10 at the indicated dose. Bioluminescence images were captured on day 4 (baseline) and day 14. Intraperitoneal delivery of topotecan shows some therapeutic effect. However, regional delivery of Nano-doxorubicin demonstrated the best therapeutic effect. EP denotes empty particles (albumin). (C) Factorial two-way ANOVA table showing effect of delivery method, drug formulation, and their interactions on therapeutic efficacy. (D) Hazard ratio of overall survival in each group (*P<0.05). (E) White cell count in each group. The experiments were performed in triplicate.
Abbreviations: ANOVA, analysis of variance; i.p., intraperitoneal; i.v., intravenous; EP, empty particles.
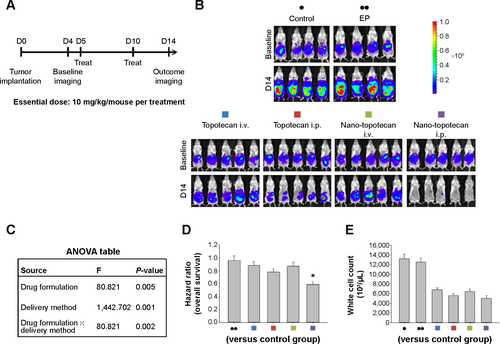
Figure S2 Therapeutic effects of intraperitoneal delivery of Nano-platin.
Notes: (A) Treatment schema. Both cisplatin and Nano-platin were administered at an essential drug dose of 5 mg/kg/mouse per treatment. (B) Evaluation of therapeutic efficacy. The mice were implanted with ES-2 cells (2×10⁵/mouse) on day 1 and were treated on days 5 and 10 at the indicated dosage. Bioluminescence images were captured on day 4 (baseline) and on day 14. Intraperitoneal delivery of cisplatin shows some therapeutic effect. In contrast, intraperitoneal delivery of Nano-platin demonstrates almost no therapeutic effect. EP denotes empty particles (albumin). (C) Factorial two-way ANOVA table showing effect of delivery method, drug formulation, and their interactions on therapeutic efficacy. (D) Hazard ratio of overall survival in each group. (E) White cell count in each group. The experiments were performed in triplicate.
Abbreviations: ANOVA, analysis of variance; i.p., intraperitoneal; i.v., intravenous; EP, empty particles.
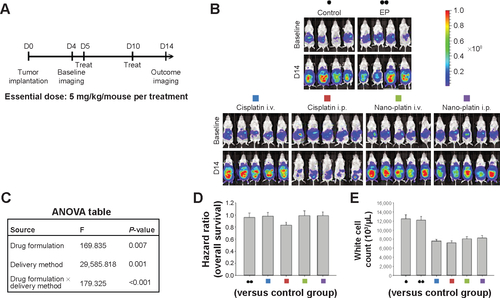
Figure S3 Therapeutic effects of intraperitoneal delivery of Nano-doxorubicin.
Notes: (A) Treatment schema. Both doxorubicin and Nano-doxorubicin were administered at an essential drug concentration of 5 mg/kg/mouse per treatment. (B) Evaluation of therapeutic efficacy. The mice were implanted with ES-2 cells (2×10⁵/mouse) on day 1 and were treated on days 5 and 10 at the indicated dosage. Bioluminescence images were captured on day 4 (baseline) and on day 14. Intraperitoneal delivery of doxorubicin shows some therapeutic effect. However, intraperitoneal delivery of Nano-doxorubicin demonstrates the best therapeutic effect. EP denotes empty particles (albumin). (C) Factorial two-way ANOVA table showing effect of delivery method, drug formulation, and their interactions on therapeutic efficacy. (D) Hazard ratio of overall survival in each group. (E) White cell count in each group. The experiments were performed in triplicate.
Abbreviations: ANOVA, analysis of variance; i.p., intraperitoneal; i.v., intravenous; EP, empty particles.
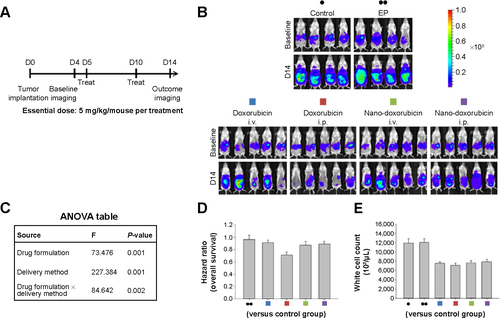
Figure S4 Therapeutic effects of intraperitoneal delivery of Abraxane®.
Notes: (A) Treatment schema. Both Taxol® and Abraxane were administered at an essential drug dose of 10 mg/kg/mouse per treatment. (B) Evaluation of therapeutic efficacy. The mice were implanted with ES-2 cells (2×10⁵/mouse) on day 1 and were treated on days 5, 8, and 11 at the indicated dose. Bioluminescence images were captured on day 4 (baseline) and on day 14. Intraperitoneal delivery of Taxol shows some efficacy. In contrast, intraperitoneal delivery of Abraxane shows almost no tumor killing efficacy. EP denotes empty particles (albumin). (C) Factorial two-way ANOVA table showing effect of delivery method, drug formulation, and their interactions on therapeutic efficacy. (D) Hazard ratio of overall survival in each group. (E) White cell count in each group. The experiments were performed in triplicate.
Abbreviations: ANOVA, analysis of variance; i.p., intraperitoneal; i.v., intravenous; EP, empty particles.
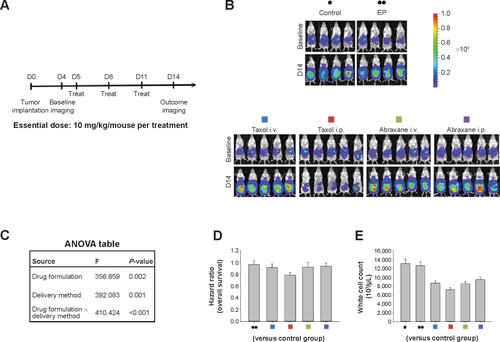
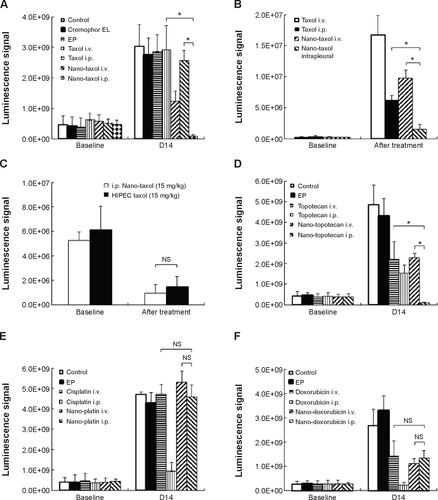
Figure S5 Quantification of bioluminescence signals (mean ± standard deviation) in each figure using the Xenogen IVIS-100 and Living Image software (Caliper Life Sciences, Hopkinton, MA, USA).
Notes: (A) Intraperitoneal delivery of Nano-taxol shows the best tumor control compared with conventional systemic delivery of Taxol® or systemic delivery of Nano-taxol. (B) The intrapleural delivery of Nano-taxol shows the best control of lung metastases compared with conventional systemic delivery of Taxol or systemic delivery of Nano-taxol. (C) Intraperitoneal delivery of Nano-taxol shows efficacy comparable with that of HIPEC. (D) Intraperitoneal delivery of Nano-topotecan shows the best tumor control compared with conventional systemic delivery of topotecan or systemic delivery of Nano-topotecan. (E) Intraperitoneal delivery of Nano-platin shows no better tumor control than conventional systemic delivery of cisplatin or systemic delivery of Nano-platin. (F) Intraperitoneal delivery of Nano-doxorubicin shows no better tumor control than conventional systemic delivery of doxorubicin or systemic delivery of Nano-doxorubicin. (G) Intraperitoneal delivery of Abraxane® shows no better tumor control than conventional systemic delivery of Taxol® or systemic delivery of Abraxane. *P<0.05.
Abbreviations: EP, empty particles; HIPEC, hyperthermic intraperitoneal chemotherapy; i.p., intraperitoneal; i.v., intravenous; NS, not statistically significant.

Reference
- ReedCLMixterPFControl samples for Annexin V-FITC vs propidium iodide quantitation of apoptosis and necrosis. Purdue Cytometry CDROM volume 4 Available from http://www.cyto.purdue.edu/cdroms/cyto4/15_apop/data/reed.htm
Acknowledgments
This work was supported in part by a grant from the National Science Council of Taiwan (NSC 101-2623-E-010-001-NU). The authors thank the Genomics Research Center, National Yang Ming University, for providing facilities and support for tumor imaging and flow cytometric analysis.
Disclosure
The authors report no conflicts of interest in this work.