

Abstract
Active molecular targeting has become an important aspect of nanoparticle development for oncology indications. Here, we describe molecular targeting of iron oxide nanoparticles (IONPs) to the folate receptor alpha (FOLRα) using an engineered antibody fragment (Ffab). Compared to control nanoparticles targeting the non-relevant botulinum toxin, the Ffab-IONP constructs selectively accumulated on FOLRα-overexpressing cancer cells in vitro, where they exhibited the capacity to internalize into intracellular vesicles. Similarly, Ffab-IONPs homed to FOLRα-positive tumors upon intraperitoneal administration in an orthotopic murine xenograft model of ovarian cancer, whereas negative control particles showed no detectable tumor accumulation. Interestingly, Ffab-IONPs built with custom 120 nm nanoparticles exhibited lower in vitro targeting efficiency when compared to those built with commercially sourced 180 nm nanoparticles. In vivo, however, the two Ffab-IONP platforms achieved equivalent tumor homing, although the smaller 120 nm IONPs were more prone to liver sequestration. Overall, the results show that Ffab-mediated targeting of IONPs yields specific, high-level accumulation within cancer cells, and this fact suggests that Ffab-IONPs could have future utility in ovarian cancer diagnostics and therapy.
Supplementary materials
Figure S1 Purity and identity analysis of recombinant fab fragments.
Notes: Size exclusion purification chromatograms of (A) Ffab and (B) Bfab. The blue curves represent UV absorbance at 280 nm, and dashed lines represent the collected monomeric Ffab and Bfab fractions. LC-MS of monomeric SEC fractions from (C) Ffab and (D) Bfab. LC-MS of monomeric (E) Ffab and (F) Bfab following cysteine activation. LC-MS of (G) activated monomeric Ffab and (H) activated monomeric Bfab following conjugation to maleimide-PEG2-biotin. The masses of 24,276 and 23,931 Da correspond to the addition of one maleimide-PEG2-biotin molecule (+526 Da) to the light chains of Ffab and Bfab, respectively. The masses of 25,291 and 26,158 Da correspond to the addition of two maleimide-PEG2-biotin molecules (+1,052 Da) to the heavy chains of Ffab and Bfab, respectively. The masses of 48,515 and 49,037 Da correspond to the addition of one maleimide-PEG2-biotin molecule (+526 Da) to intact Ffab and Bfab, respectively.
Abbreviations: fab, an engineered monoclonal antibody fragment; Ffab, Farletuzufab, engineered from monoclonal antibody Farletuzumab; Bfab, Botulifab anti-botulinum toxin fab fragment; UV, ultraviolet; PEG2, polyethylene glycol 2; SEC, size-exclusion chromatography; LC-MS, liquid chromatography-mass spectrometry.
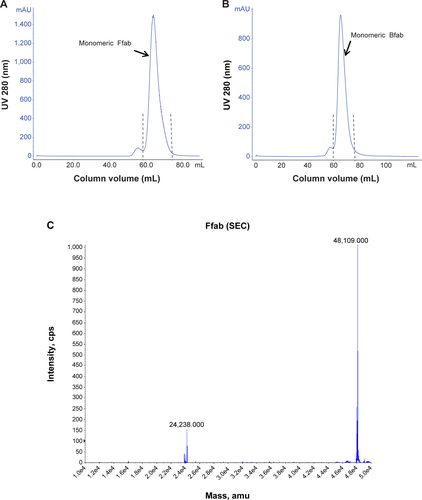
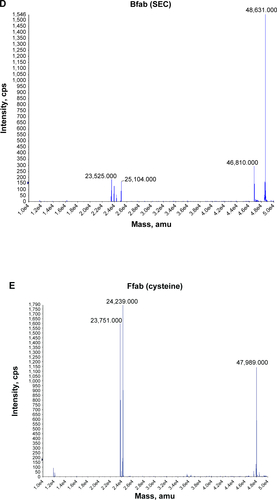
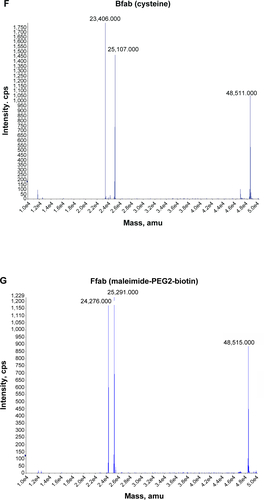
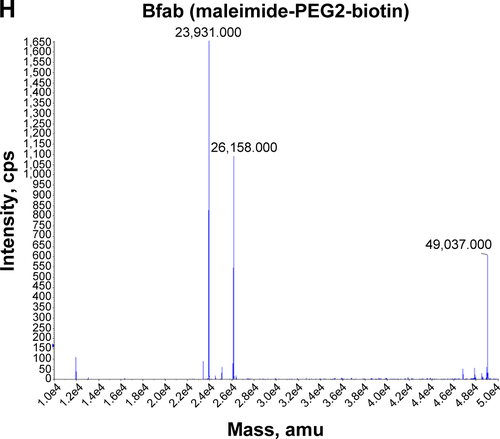
Figure S2 Bio-layer interferometry binding analysis of Ffab antibody fragment.
Notes: Sensorgrams of soluble rFOLRα binding to Ffab immobilized on ForteBio streptavidin biosensor tips. Blue curve indicates measured binding kinetics and red line indicates best-fit curve from kinetic modeling. The best-fit on rate, off rate, and equilibrium dissociation constants are provided below the sensorgrams.
Abbreviations: fab, an engineered monoclonal antibody fragment; Ffab, Farletuzufab, engineered from monoclonal antibody Farletuzumab; Bfab, Botulifab anti-botulinum toxin fab fragment; rFOLRα, recombinant folate receptor alpha; sec, seconds.
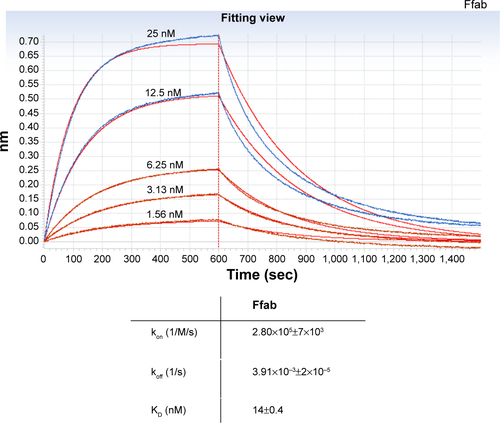
Figure S3 TEM pictures of bulk IONPs.
Notes: (A) 15,000× magnification of commercial bionized nanoferrite (BNF) particles and 71,000× magnification (inset). (B) 19,500× magnification of the Dartmouth CMD particles and 71,000× magnification (inset).
Abbreviations: TEM, transmission electron microscopy; IONPs, iron oxide nanoparticles; CMD, carboxymethyl-dextran.
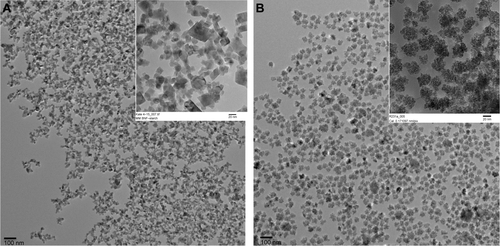
Figure S4 IONP size distribution profile.
Notes: As measured by dynamic light scattering, the intensity size distributions of (A) CMD and (B) BNF IONPs are characterize by mean peaks of 118 nm and 172 nm, respectively. The red lines are maleimide-conjugated IONPs, the light blue lines are negative control Botulifab-conjugated IONPs, and the dark blue lines are the Farletuzufab-conjugated IONPs.
Abbreviations: IONPs, iron oxide nanoparticles; fab, an engineered monoclonal antibody fragment; Ffab, Farletuzufab, engineered from monoclonal antibody Farletuzumab; Bfab, Botulifab anti-botulinum toxin fab fragment; BNF, bionized nanoferrite; CMD, carboxymethyl-dextran; Mal, maleimide.
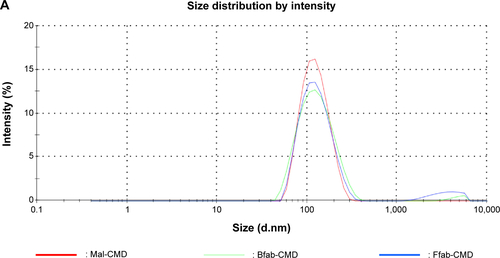
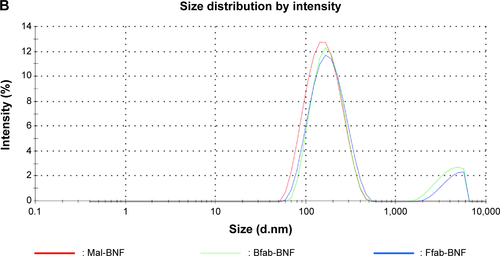
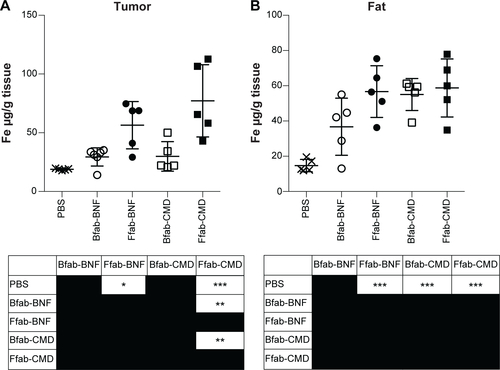
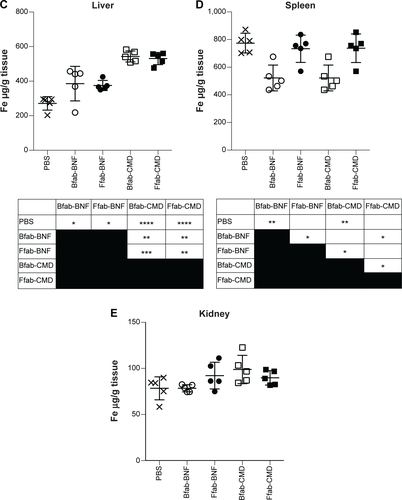
Figure S5 In vivo biodistribution of IONPs.
Notes: Tissue iron concentration (ie, per gram of tissue) is shown for various compartments: (A) tumor; (B) fat; (C) liver; (D) spleen; and (E) kidney. Data obtained by ICP-MS from five mice per group approximately 18 hours post-injection. Statistical significance was analyzed by one-way ANOVA with a Tukey’s multiple comparison post-test, and the results of individual comparisons are provided in the tables below each graph. ****P<0.0001; ***P<0.001; **P<0.01; *P<0.05.
Abbreviations: IONPs, iron oxide nanoparticles; ICP-MS, inductively coupled plasma mass spectrometry; ANOVA, analysis of variance; PBS, phosphate-buffered saline; BNF, bionized nanoferrite; CMD, carboxymethyl-dextran; fab, an engineered monoclonal antibody fragment; Ffab, Farletuzufab, engineered from monoclonal antibody Farletuzumab; Bfab, Botulifab anti-botulinum toxin fab fragment.
Acknowledgments
The authors would like to thank Louisa Howard and Charles P Daghlian of the Dartmouth Electron Microscope Facility for their assistance with TEM data, and the Dartmouth Center for Cancer Nanotechnology Excellence Toxicology, Biodistribution and Pathology Core, and the Dartmouth Trace Element Core for ICP-MS data. We would also like to thank the Dartmouth Transgenic and Genetic Construct Shared Resources, and Jennifer Fields for maintaining the NSG mice. We also thank the Dartmouth CCOP Pathology Translational Research (especially Rebecca O’Meara and Eric York), for the assistance with tissue histology. Finally, we would like to thank Adimab LLC, in particular Yingda Xu and Felicia Reid, for their assistance with LC-MS data. This work was supported by NCI grant number 1 U54 CA151662-01.
Disclosure
The authors report no conflicts of interest in this work.