

Abstract
Purpose
This study is to demonstrate the nanoscale size effect of ferrimagnetic H-ferritin (M-HFn) nanoparticles on magnetic properties, relaxivity, enzyme mimetic activities, and application in magnetic resonance imaging (MRI) and immunohistochemical staining of cancer cells.
Materials and methods
M-HFn nanoparticles with different sizes of magnetite cores in the range of 2.7–5.3 nm were synthesized through loading different amounts of iron into recombinant human H chain ferritin (HFn) shells. Core size, crystallinity, and magnetic properties of those M-HFn nanoparticles were analyzed by transmission electron microscope and low-temperature magnetic measurements. The MDA-MB-231 cancer cells were incubated with synthesized M-HFn nanoparticles for 24 hours in Dulbecco’s Modified Eagle’s Medium. In vitro MRI of cell pellets after M-HFn labeling was performed at 7 T. Iron uptake of cells was analyzed by Prussian blue staining and inductively coupled plasma mass spectrometry. Immunohistochemical staining by using the peroxidase-like activity of M-HFn nanoparticles was carried out on MDA-MB-231 tumor tissue paraffin sections.
Results
The saturation magnetization (Ms), relaxivity, and peroxidase-like activity of synthesized M-HFn nanoparticles were monotonously increased with the size of ferrimagnetic cores. The M-HFn nanoparticles with the largest core size of 5.3 nm exhibit the strongest saturation magnetization, the highest peroxidase activity in immunohistochemical staining, and the highest r2 of 321 mM−1 s−1, allowing to detect MDA-MB-231 breast cancer cells as low as 104 cells mL−1.
Conclusion
The magnetic properties, relaxivity, and peroxidase-like activity of M-HFn nanoparticles are size dependent, which indicates that M-HFn nanoparticles with larger magnetite core can significantly enhance performance in MRI and staining of cancer cells.
Supplementary materials
Figure S1 Magnetostatic interaction analysis of M-HFn nanoparticles.
Notes: The Wohlfarth–Cisowski test curves of (A) M-HFn1000, (B) M-HFn3000, (C) M-HFn5000, and (D) M-HFn7000 at 5 K. R values are 0.5, 0.48, 0.44, and 0.40 for M-HFn1000, M-HFn3000, M-HFn5000, and M-HFn7000, respectively.
Abbreviations: M-HFn, ferrimagnetic H-ferritin; IRM, isothermal remanent magnetization; H, applied magnetic field; DCD, direct current field demagnetization; R, magnetostatic interaction parameter.
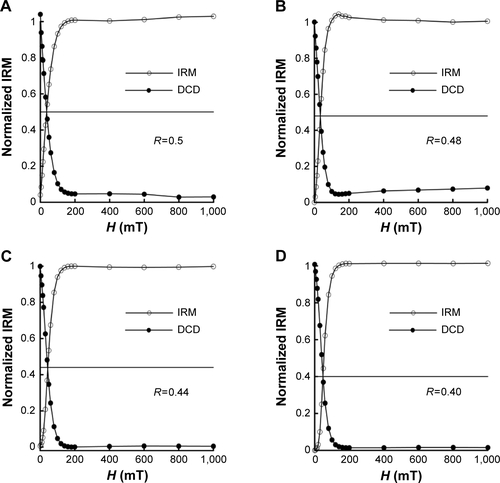
Figure S2 Low- and room-temperature magnetic analysis of M-HFn nanoparticles.
Notes: Hysteresis loops of M-HFn nanoparticles measured at (A) 300 K and (B) 5 K. (C) Low-field (1.5 mT) magnetization curves as a function of temperature measured after ZFC and FC treatments of the M-HFn nanoparticles.
Abbreviations: M-HFn, ferrimagnetic H-ferritin; ZFC, zero-field cooling; FC, field cooling; M, magnetization; H, magnetic field; Tb, blocking temperature.
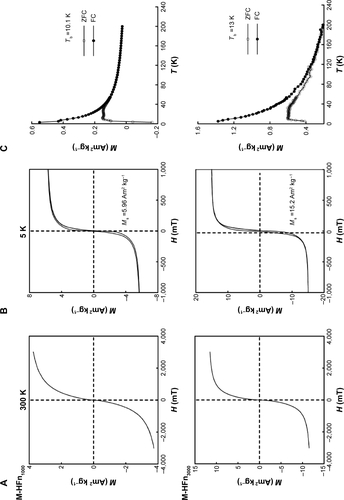
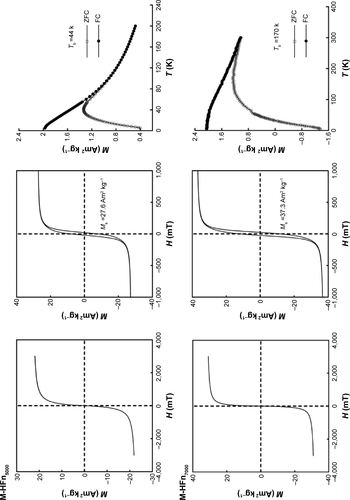
Figure S3 Analysis of transverse relaxivity of M-HFn nanoparticles by linear mapping iron concentration and 1/T2.
Notes: Transverse relaxivity (r2) analysis of (A) M-HFn1000, (B) M-HFn3000, (C) M-HFn5000, and (D) M-HFn7000. Slope of line represents r2.
Abbreviations: M-HFn, ferrimagnetic H-ferritin; T2, transverse relaxation times.
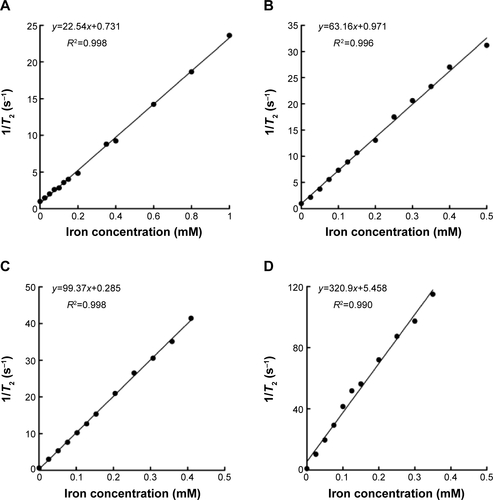
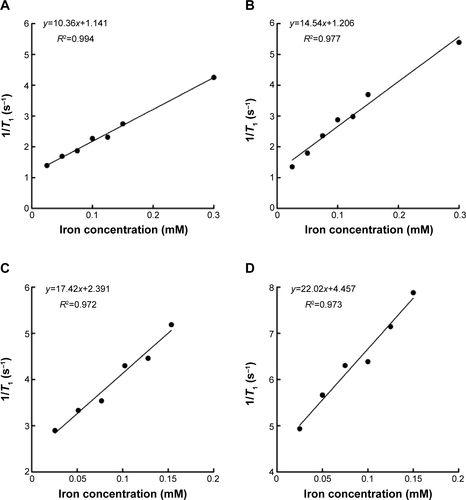
Figure S4 Analysis of longitudinal relaxivity of M-HFn nanoparticles by linear mapping iron concentration and 1/T1.
Notes: Longitudinal relaxivity (r1) analysis of (A) M-HFn1000, (B) M-HFn3000, (C) M-HFn5000, and (D) M-HFn7000. Slope of line represents r1.
Abbreviations: M-HFn, ferrimagnetic H-ferritin; T1, longitudinal relaxation times.
Acknowledgments
This work was supported by the CAS/SAFEA International Partnership Program for Creative Research Teams (KZCX2-YW-T10), the National Natural Science Foundation of China (numbers 41330104 and 41204053), and the R&D of Key Instruments and Technologies for Deep Resources Prospecting (the National R&D Projects for Key Scientific Instruments, number ZDYZ2012-1-01-02). We thank Drs F Fang and H Lei of Wuhan Institute of Physics and Mathematics, CAS, for selfless help in the MRI experiment. We are grateful to three anonymous reviewers for their constructive comments that significantly improved the manuscript.
Disclosure
The authors declare that they have no competing interests.