Abstract
TiO2 nanotubes are fabricated on TiO2 grit-blasted, screw-shaped rough titanium (ASTM grade 4) implants (3.75 × 7 mm) using potentiostatic anodization at 20 V in 1 M H3PO4 + 0.4 wt.% HF. The growth behavior and surface properties of the nanotubes are investigated as a function of the reaction time. The results show that vertically aligned nanotubes of ≈700 nm in length, with highly ordered structures of ≈40 nm spacing and ≈15 nm wall thickness may be grown independent of reaction time. The geometrical properties of nanotubes increase with reaction time (mean pore size, pore size distribution [PSD], and porosity ≈90 nm, ≈40–127 nm and 45%, respectively for 30 minutes; ≈107 nm, ≈63–140 nm and 56% for one hour; ≈108 nm, ≈58–150 nm and 60% for three hours). It is found that the fluorinated chemistry of the nanotubes of F-TiO2, TiOF2, and F-Ti-O with F ion incorporation of ≈5 at.%, and their amorphous structure is the same regardless of the reaction time, while the average roughness (Sa) gradually decreases and the developed surface area (Sdr) slightly increases with reaction time. The results of studies on animals show that, despite their low roughness values, after six weeks the fluorinated TiO2 nanotube implants in rabbit femurs demonstrate significantly increased osseointegration strengths (41 vs 29 Ncm; P = 0.008) and new bone formation (57.5% vs 65.5%; P = 0.008) (n = 8), and reveal more frequently direct bone/cell contact at the bone–implant interface by high-resolution scanning electron microscope observations as compared with the blasted, moderately rough implants that have hitherto been widely used for clinically favorable performance. The results of the animal studies constitute significant evidence that the presence of the nanotubes and the resulting fluorinated surface chemistry determine the nature of the bone responses to the implants. The present in vivo results point to potential applications of the TiO2 nanotubes in the field of bone implants and bone tissue engineering.
Introduction
Titanium oxide (TiO2) nanotubes were first described by Zwilling and colleagues in 1991, as ‘columnar porous’ titania layers formed electrochemically in fluorinated electrolyte,Citation1 and are of great interest due to their highly ordered nanostructure. Recent advances in the fabrication, properties, and applications of TiO2 nanotubesCitation2–Citation8 have provided new opportunities for research in relation to their use in clinical practice. A significant challenge in the electrochemical engineering of metallic bone implant surfaces is to optimize the surface oxide properties to facilitate favorable interaction with the host tissueCitation9 by tailoring the process parameters to best suit the given conditions. The electrochemical growth behavior and surface oxide properties are determined by several process parameters, including the forming voltage, current density, electrolyte properties (concentration, ion content, and pH), temperature, circulation speed of the electrolyte, surface area ratio, and distance between the anode and cathode.Citation10,Citation11
A series of in vivo investigations were carried out in our laboratory using so-called oxidized microporous titanium implants and novel electrochemical oxidation methods.Citation12,Citation13 The results of these studies demonstrated that optimization of the surface oxide properties, such as ions-incorporated titanate chemistry, pore geometry (size, shape, porosity, pore size distribution [PSD]), and nanocrystalline structure, significantly improve the response of the bone to the implants.Citation14–Citation17 In particular, it has become evident that the presence of divalent cations together with thin, ≤4 μm titanium oxide chemistries, eg, CaTiO3 or MgTiO3, causes rapid and strong integration of the implants with boneCitation18–Citation22 via biochemical bonding at the bone-implant interface.Citation23,Citation24
Despite these advances, little is known about the osseointegration effects of TiO2 nanotubes in vivo.Citation25 A number of in vitro studies have reported promising cell responses to TiO2 nanotubes.Citation26–Citation30 Some very recent in vitro studies have yielded contrasting findings in relation to the behaviour of mesenchymal stem cells (MSCs) on TiO2 nanotube-structured surfaces.Citation27–Citation29 Whether the best nanotube size for the adhesion, proliferation, migration, and osteogenic differentiation of MSCs is 15 or 100 nm is currently a matter of some debate.Citation31,Citation32
The study described herein focused on the bone responses in animals and related surface properties of the TiO2 nanotubes that are electrochemically fabricated on blasted, screw-shaped titanium implants. The study had two aims: (1) to understand how the reaction time affects the growth behavior and surface properties of TiO2 nanotubes on grit-blasted, screw-shaped titanium implants (ASTM, grade 4), and (2) to identify the surface properties that determine the osseointegration strength and osseoconductivity of TiO2 nanotube screw implants in a rabbit femur model. TiO2 grit-blasted, moderately rough titanium implants were selected for the control group, because these yield beneficial clinical outcomes in modern implant dentistry.
Materials and methods
Electrochemical fabrication of self-organized nanotubes on the screw-shaped, blasted titanium implants
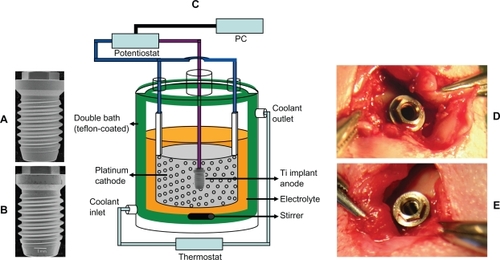
The screw-shaped titanium implants (ASTM grade 4, 3.75 × 7 mm) were manufactured using a CNC (computer numerical control) machine and then blasted with TiO2 particles in the range 100–150 μm. The implants were degreased by sonication in an aqueous solution of phosphate-free Extran® MA 03 (Merck, Darmstadt, Germany)/deionized water (1:100) and absolute ethanol for 2 × 15 min. Afterwards, they were first rinsed with deionized water, then dried in an oven at 60°C for one day. The implants were divided into two groups, one containing the TiO2 nanotube TEST implants and the other the blasted CONTROL implants (). In order to fabricate the TiO2 nanotubes on the blasted, screw-shaped titanium implants, the electrochemical setup shown in was used, which consisted of a high-voltage potentiostat (DCS600-1.7E; Sorensen, Foster City, CA, USA) with a multichannel slave interface, a thermostat (Lauda RE 206, Lauda-Königshofen, Germany), and an electrochemical cell. The electrochemical cell was made of a double-glass bath. The inner glass bath was coated with Teflon and contained a platinum ring cathode (50 × 50 mm) perforated with 2 mm holes and an anode for the samples. Titanium oxide nanotubes were fabricated by potentiostatic anodization in 1 M H3PO4 (ACS reagent; Sigma-Aldrich, St. Louis, MO, USA) + 0.4 wt.% HF (48% aqueous solution; Sigma-Aldrich). The potential was first increased from the open-circuit potential to 20 V at a sweep rate of 500 mV/s. Potentiostatic anodization was carried out for 30 minutes, one hour, and three hours, respectively, at 20°C. The electrolyte was stirred with a magnetic stirring bar at 300 rpm. Currents and voltages were recorded at one second intervals using a computer that was interfaced with the power supply. The samples were rinsed with deionized water, then dried in an oven at 60°C. The titanium nanotube implants formed after three hours were used in the animal study.
Figure 1 Macroscopic images of A) the TiO2 nanotube-fabricated TEST implant B) the blasted CONTROL implant. The thread pitch is 600 μm. C) Schematic of the experimental setup used for the electrochemical nanofabrication. D and E) One nanotube implant and one blasted implant were inserted in the femur condyle close to the knee joint of each rabbit.
Surface analysis techniques
In order to identify the dependence of bone response on the surface properties of the TiO2 nanotubes, detailed surface characterization was performed using several analytical instruments.
The morphologies of the top view, cross-section, and bottom view were observed using a field emission scanning electron microscopy (FE-SEM) (Hitachi FE-SEM S4800 Hitachi Ltd., Hitachinaka, Japan) and the nanotube geometries were measured using an Easy Image 2000 system (Teknoptik AB, Huddinge, Sweden) attached to a Nikon Eclipse 80i microscope (Teknoptik AB). The cross-sectional and bottom-view images were taken from mechanically bent samples in which some pieces of the titanium oxide layer had been cracked and lifted off upside down.
The chemical composition of the samples was measured by X-ray photoelectron spectroscopy (XPS; ESCALAB 250, Thermo-VG, East Grinstead England) using a monochromatic Al Kα X-ray source (1486.7eV, 300W; the beam size, 400 μm diameter). The electron take-off angle was fixed at 45° and the vacuum pressure was maintained below 10−9 torr during spectral data acquisition. XPS data were acquired before and after sputtering. In order to remove the superficial contaminant (two monolayers), Ar sputter cleaning was carried out for three seconds (beam energy, 2 KeV; primary current, 2 μA; raster area, 3.14 mm2). The binding energy of the target elements was determined with a resolution of 0.1 eV, using the binding energy of carbon (C 1s: 284.8 eV) as a reference.
The crystal structure was determined by low-angle X-ray diffraction (XRD) with a thin film collimator (X`Pert PRO-MRD, Philips Ltd, Eindthoven Netherlands) on a plate-type sample prepared with the same electrochemical parameters as the test screw-shaped implants. The step size used in the scan was 0.02° over the range 15°–70°. The spectra were recorded using Cu Kα radiation (0.154056 Å) generated at an acceleration voltage of 35 kV and a current of 25 mA.
Surface roughness was measured using an optical profilometer (MicroXamTM, Phase-Shift, Tucson Arizona). Three implants each from the test and control groups were measured on three thread-tops, three thread-valleys, and three thread-flanks each, making a total of 27 measurements for each group. The measuring area was 230 μm × 230 μm for each group. A Gaussian filter, 50 μm × 50 μm, was used to separate the roughness from errors of form and waviness. The roughness parameters measured were Sa and Sdr.
Animals and surgery
Nine New Zealand white male rabbits were used in the study, which was approved by the Animal Ethics Committee at the Karolinska Institute, Sweden. The mean weight was 3.8 kg (±0.36) before surgery and 3.7 kg (±0.37) when they were killed. Each of the rabbits received one blasted implant and one nanotube implant in the femur condyle close to the knee joint (). For surgery, the animals were anesthetized with intramuscular injections of fentanyl and fluanisone (Hypnorm Vet, Janssen, Saunderton, England) at 0.5 ml per kg body weight and intraperitoneal injections of diazepam (Valium, Roche, France) at 2.5 mg per animal. The skin was shaved and washed with a mixture of 70% ethanol and 2% iodine solution prior to surgery. A local anesthetic consisting of 1.0 mL 5% xylocaine (AstraZeneca, Södertälje, Sweden) was injected into the surgical area. The skin and fascial layers were opened and closed separately. The periosteal layer was gently pulled away from the surgical area and was not sutured. Round burs of 1.5 mm diameter were used first to make the holes for the implants in bone, followed by twist drills of 2.0 mm diameter, 2.0/2.75 mm diameter, and finally of 3.45 mm diameter. During all surgical drilling sequences, low rotary drill speeds of less than 2000 rpm were used minimally, with saline cooling were minimally used. After surgery, analgesia was injected subcutaneously at a dose of 0.5 mL Temgesic (0.3 mg/mL, Reckitt and Colemann, Hull, England). The animals were kept in separate cages, and immediately after surgery, they were allowed full weight-bearing. After a follow-up period of six weeks, the animals were killed using intravenous injections of Pentobarbital® (Apoteksbolaget, Uppsala, Sweden). Eight rabbits were used to test removal torque (RTQ) and to measure the formation of new bone. The remaining rabbit was killed to allow high-resolution observation of LM and SEM at the intact interface between the implant and tissues.
Removal torque measurements
The osseointegration strength of the implant was measured by RTQ tests in Ncm. The removal torque instrument (Detektor AB, Gothenburg, Sweden) is an electronic device used to represent the interfacial shear strength between the bone tissue and the implant summed over the full bone–implant interface. The static torque was applied to the implant at a linearly increasing rate of 9.5 Ncm/s. More details of RTQ measurements have been published elsewhere.Citation20,Citation21
Qualitative and quantitative light microscopy (LM) measurements on nondecalcified cut and ground sections
Each implant and the surrounding tissue was retrieved en bloc and immediately immersed in 4% neutral buffered formaldehyde (pH 7.1) fixative. Nondecalcified cut and ground sections with implants in situ were prepared using the so-called Exakt technique (Exakt Apparatebau, Norderstedt, Germany), which was first described by Donath and Breuner in 1982.Citation33 The resin block samples were sectioned in two halves along the central long axes of the implants in an anteroposterior direction. The initial cut sections of 200 μm were ground down by about 25 μm. One half of the sections of each group was stained with basic fuchsin and the other half was stained with toluidine blue and 1% pyronin G. The formation of new bone was quantified in all inner threads on both basic fuchsin and toluidine blue-stained sections using a Nikon Eclipse 80i microscope (Teknoptik AB) coupled to an Easy Image 2000 system (Teknoptik AB) with ×10 (NA 0.30), ×20 (NA 0.45), and ×40 (NA 0.70) objective lenses and a ×10 eyepiece. Previous studies have shown that quantification of new bone formation surrounding the implants on which RTQ tests were performed is a valuable method for evaluating the osseoconductivity of the same implants surfaces.Citation21
Backscattered-electron-mode-SEM observation at the bone-implant interface
The samples were polished using 800 to 4000 grit silicon carbide abrasive papers (SiC-Paper, Struers A/S, Copenhagen, Denmark) followed by 10 nm thin carbon coating (JEC520 Carbon Coater, JEOL, Scandinavia). High-resolution observation of the bone-implant interface was performed using the backscattered electron mode (BSE) of SEM (SEM-BSE: LV-SEM, JSM-6380LV; JEOL, Sollentuna, Sweden).
Statistical analysis
The osseointegration strengths and new bone formation were compared using the Wilcoxon signed rank test. The statistics program used was SPSS (version 16; SPSS Inc., Chicago, IL, USA). Data are presented throughout as the mean ± standard deviation. From the two-tailed significance level (asymptotic two-tailed test), differences were considered to be statistically highly significant at P values ≤ 0.01, statistically significant at P values ≤ 0.05 and not significant at P ≥ 0.05.
Results and discussion
Electrochemical growth behavior of titanium oxide nanotubes
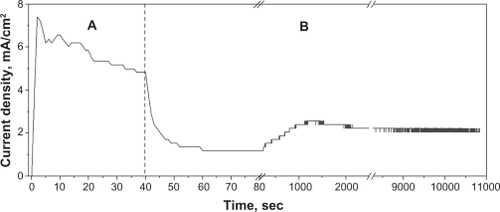
shows the typical current vs. time relationship obtained using the blasted, screw-shaped titanium implants in the potential sweep mode, increasing from 0 to 20 V at 500 mV/s followed by the subsequent potentiostatic oxidation mode at 20 V for three hours. During the 40 seconds of the potential sweep mode, the current density increased rapidly to 7.5 mA/cm2 after three seconds and then gradually decreased to about 4.8 mA/cm2 after 40 seconds (). The transition in the growth mode from the potential sweep to the potentiostatic state was accompanied by a sharp drop in current density to 1.2 mA/cm2. This value remained steady until 60 seconds and then gradually increased to 2.6 ± 0.2 mA/cm2 between 1120 and 2200 seconds. After that, the current density reached a state of dynamic equilibrium and remained approximately constant at about 2.2 ± 0.2 mA/cm2.
Figure 2 Characteristic current vs time curve showing the effects of A) the potential sweep mode and B) the potentiostatic mode performed on the blasted, screw-shaped implants using 100–150 μm particles of TiO2.
Properties of titanium oxide nanotubes
Nanotube geometry vs reaction time
The FE-SEM images shown in reveal the formation of highly ordered nanopore structures formed on the blasted, screw-shaped titanium implants after 30 minutes, one hour, and three hours, together with the surface structure of the blasted implants. An image analysis of the pore geometry () shows that the mean pore size was ≈90 nm (PSD ≈ 40–127 nm) for the 30-minute sample, ≈107 nm (PSD ≈ 63–140 nm) for the one-hour sample, and ≈108 nm (PSD ≈ 58–150 nm) for the three-hour sample. The porosities (open pores) of the 30-minute, one-hour, and three-hour samples were 45%, 56%, and 60%, respectively. The nanopores were characterized by highly ordered structures with a spacing of ≈40 nm spacing and a wall thickness of ≈15 nm in all samples. The cross-section view shows vertically aligned nanotubes with similar nanotube lengths of ≈700-nm in all samples.
Figure 3 FE-SEM images of top view (first column), cross-section (second column), and bottom view (inset) of the nanotube implants formed in 1M H3PO4 + 0.4 wt.% HF at 20 V for A) 30 minutes, B) one hour, C) three hours (scale bar = 500 nm) and D) the blasted implants formed using 100–150 μm particles of TiO2 (scale bar = 5 μm).
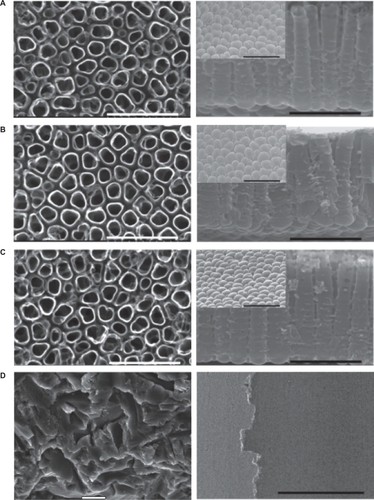
Figure 4 Variation of pore size, pore size distribution (PSD), and porosity with the reaction time used in nanotube formation of 30 minutes, one hour, and three hours.
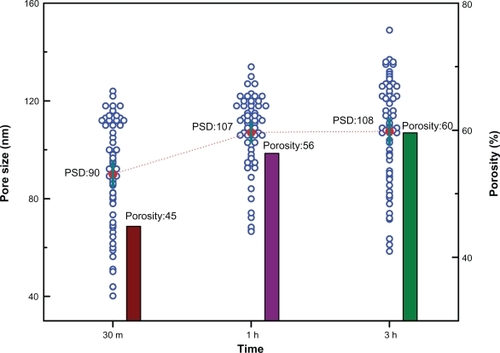
The results indicate that pore size, PSD, and porosity increase with increasing reaction time up to one hour whereafter their growth rate levels off. The length, spacing, and wall thickness of the nanotubes were all independent of reaction time. Previous studies have reported that pore diameters increase linearly with anodization potential, eg, from 15 nm at 1 V to 120 nm at 25 V for a reaction time of one hour in H3PO4/HFCitation34 and from 22 nm at 5 V to 466 nm at 100 V for two hours in (NH4)2SO4/NH4F.Citation35 In general, the formation of nanotubes in fluoride-based electrolytes is explained by the dynamic equilibrium between the growth and dissolution processes of the titanium oxide, the so-called field-assisted oxidation of Ti metal to form titanium oxide, the field-assisted dissolution of Ti metal ions in the electrolyte, and the chemical dissolution of Ti and TiO2 due to etching by fluoride ions.Citation2,Citation3,Citation10,Citation36 The similar shapes and sizes of the bottoms of the nanotubes may be induced by the chemical etching of the solution. The control implant revealed a structure characterized by blasted pits.
Surface chemistry vs reaction time
X-ray photoelectron spectroscopy (XPS) survey spectra were obtained before and after sputtering with Ar+ ions (data not shown). The compositions of the Ti, O, F, C, P, N, and Ca atoms were obtained from the Ti 2p3/2 peak (458.8 eV), O 1s peak (530.1eV), F 1s peak (684.8 eV), C 1s peak (284.8 eV), P 2p3 peak (133.5 eV), N 1s peak (400.2 eV), and Ca 2p3 peak (347.4 eV) core-level energy regions of the electron orbitals, respectively ().
Table 1 Relative atom concentrations (at.%) of the implants identified by XPS measurements at the core-level energy regions of the target elements. () indicates atom concentration after the superficial contaminants (two monolayers) were removed using sputtering with Ar+ ions
shows the high-resolution XPS spectra at the Ti 2p, O 1s, and F 1s core-level energy regions. In general, the peak intensities of the Ti 2p () and O 1s spectra () appeared at similar binding energies of 458.8 eV and 530.1eV, respectively, for all the implants. The most difference between the surface chemistry of the titanium nanotube and the blasted implants was detected at the F 1s region. In the study, the author paid special attention to the analysis of the fluorine chemistry, because the incorporation of F ions into the anodic oxide layer of the titanium implants are thought to be of great significance in terms of bone response, as shown in a previous in vivo study.Citation37 The relative F atom concentrations were estimated to be ≈4% before and ≈6% after sputtering with Ar+ ions, and were found to be independent of the duration of the potentiostatic process.
Figure 5 High-resolution XPS spectra at A) the Ti 2p, B) O1s, and C) F 1s core-level energy region of the nanotube implants formed after A) 30 minutes, B) one hour, C) three hours, and d) the blasted implant. In order to extract the peak contributions at the F 1s energy region, spectral deconvolutions were performed using a numerical fitting procedure. Individual line shapes were simulated using a combination of the Lorentzian and Gaussian functions.
Abbreviation: XPS, X-ray photoelectron spectroscopy.
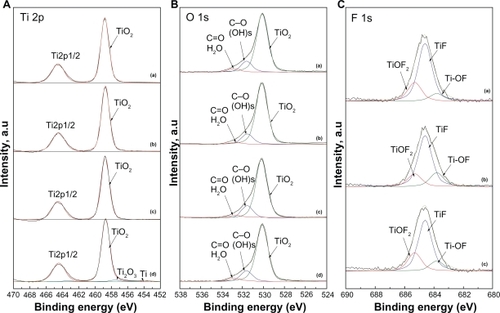
The high-resolution XPS analysis at the F 1s level shows similar spectra for all the nanotube samples (). Deconvolution data of the F 1s spectra into the different binding states that have Gaussian distributions show the major doublet peaks at 684.8 eV and 684.5 eV. The most likely explanation for this phenomenon is that the F-ions are physically adsorbed onto the surface of TiO2Citation38 and the metal fluoride (F-Ti).Citation39 The contribution near 685.3 eV is attributed to the F-atoms in TiOF2 because its location is in good agreement with that of pure TiOF2.Citation38, Citation40 The contribution at 683.8 eV may be attributed to the oxyfluoride (F-Ti-O) functional groups.Citation39 Differences in Ti, O, and P concentrations for all the nanotube samples were less than 1.0%. The blasted implants consisted mainly of TiO2.
Crystal structure vs reaction time
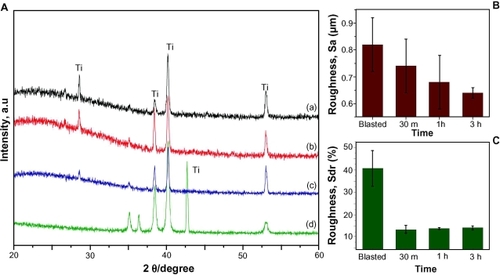
The XRD patterns shown in reveal the amorphous structure of the oxide films in both the nanotubes and blasted implants at reaction times of 30 minutes, one hour, and three hours. Nanocrystallization of anodic titania generally depends on electrochemical parameters, such as the electrolyte (type, concentration, and pH), the voltage, and current density.Citation10,Citation11,Citation41,Citation42 For example, the titanium oxides prepared in 1 M H2SO4 and 0.05–0.4 wt.% HF electrolytes were transformed from anatase into rutile structures when the anodizing voltage was increased from 15 to 40 V.Citation42 The crystallized structures of titanium oxide are reported to contribute to the improvement of bone responses, compared to the amorphous structure.Citation9,Citation15
Figure 6 A) XRD spectra of the nanotube implants formed after A) 30 minutes, B) one hour, C) three hours, and D) the blasted implants. (B and C) The bar charts show how average roughness (Sa) decreases gradually and developed surface area (Sdr) increases slightly with reaction time.
Abbreviation: XRD, X-ray diffraction.
Surface roughness vs reaction time
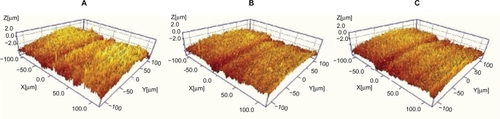
show how the three-dimensional roughness parameters Sa (arithmetic average height deviation, μm) and Sdr (the ratio of the increment of the interfacial area of a surface over the sampling area, %) vary with reaction time. The Sa values corresponding to the blasted implants and the nanotube implants prepared with reaction times of 30 minutes, one hour, and three hours were 0.81 (±0.09), 0.74 (±0.09), 0.69 (±0.09), and 0.65 μm (±0.02), respectively. The equivalent values for Sdr were 40.5 (±7.8), 13.5 (±1.9), 14.0 (±0.5), and 14.3% (±0.9). The gradual decrease in Sa is due to the ‘smoothening’ effect brought about by chemical/electrochemical dissolution,Citation9,Citation11 whereas the slight increase in Sdr values reflects the increase in pore size and PSD with reaction time. Three-dimensional images obtained using Interferometry reveal that the nanotube implants nevertheless show a baseline wave pattern (frequency) that is similar to that of the machine-turned implants ().
Figure 7 Three-dimensional images of TiO2 nanotubes electrochemically fabricated on blasted, screw-shaped titanium implants for A) 30 minutes, B) one hour, and C) three hours obtained using interferometry with a measuring volume of 230 × 230 × 5 μm3.
Bone response
LM and SEM observations
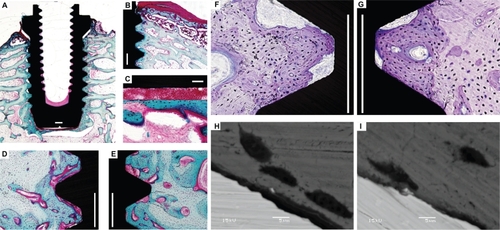
shows light microscopy (LM) and SEM observations of the histologically-stained undecalcified cut and ground sections with the implant in situ. Survey pictures reveal well-developed trabecular architecture surrounding the implant, with some variations in the newly formed bone structures in the periosteal and endosteal regions. In the periosteal region, active formations of woven bone were observed, where alkaline phosphatase activity is known to be more pronounced than in the endosteal region.Citation16 In the endosteal regions, newly formed bone was clearly identified by the demarcation lines between dark and pale stained bone tissue on both basic fuchsin and toluidine blue-stained sections. Close bone/cells contact was observed on both implant surfaces. Direct bone/cells contact was more commonly observed in a very thin rim of bone tissue in the marrow cavity region of the TiO2 nanotube surfaces. In the direct bone/cells contact area defined by the LM observations, further high-resolution SEM observations often revealed close interfacial contact distance or truly direct contact with the fluorinated TiO2 nanotube surfaces, but showed no direct bone/cells contact with the blasted implant surfaces. These findings represent common histological characteristics of chemistry-modified implant surfaces in comparison with nonbioactive surfaces.Citation23,Citation24
Figure 8 LM and BSE-SEM qualitative and quantitative observations of osseoconductivity on undecalcified cut and ground sections with the implants in bone. Basic fuchsin stained sections (A–E) show the following: well-developed trabecular architecture surrounding the implant placed in a rabbit femur A), pronounced new (immature woven) bone formation under the periosteum (dark pink staining) B), blood cells filling the space between the implant bottom and the new bone detached in the removal torque test C), newly formed bone (dark blue) inside the threads of the blasted implant D), and fluorinated TiO2 implants at the endosteal reagions E), clearly distinguished from the demarcation lines between dark and pale stained bone tissue. Toluidine-blue stained sections show variations in the nature of the direct bone contact between the blasted F) and fluorinated TiO2 implants G) (Scale bar = 500 μm). High-resolution BSE-SEM observations (3000×) show that the direct bone contact defined by LM observations turns out to be “real” direct bone/cell contact with the TiO2 nanotube implant surface more frequently than in the blasted implant (Scale bar = 5 μm).
Abbreviations: LM, light microscopy; BSE-SEM, back scattered electron scanning electron microscopy.
Quantification of new bone formation
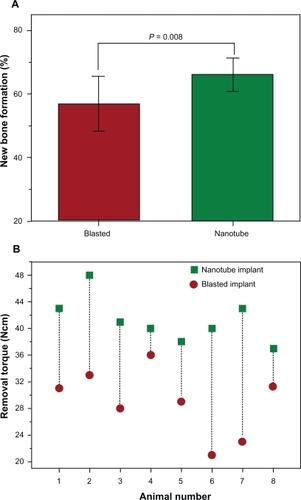
Comparisons of the newly formed bone in all threads on both sides of the implants showed a significant difference between the nanotube implants (65.6% ± 5.2%) and the blasted implants (57.5% ± 8.6%) (n = 8, P = 0.008; ).
Figure 9 The fluorinated TiO2 nanotube implants in a rabbit femur for six weeks demonstrate superior bone responses over the blasted implants: A) new bone formation (57.5% vs 65.5%; P = 0.008) and (B) osseointegration strength (41 vs 29 Ncm; P = 0.008) (n = 8). Notably, every single nanotube implant showed a stronger osseointegration than the equivalent blasted implant paired in the same animal (B).
Osseointegration strength
shows the significantly increased osseointegration strength of the nanotube implants compared with the blasted implants. The mean values of RTQ showed a statistically highly significant difference between 41.2 Ncm (±3.4) for the nanotube implants and 29 Ncm (±4.9) for the blasted implants (n = 8, P = 0.008). Notably, every single nanotube implant showed a higher Risk Tolerance Questionnaire value than the equivalent blasted implant in the same animal.
Which properties of the nanotubes determine osseointegration strength and osseoconductivity?
To date, there is no direct in vivo experimental evidence in the literature to identify the reasons for the enhanced osseointegration and osseoconductivity of the fluorinated TiO2 nanotube implants used in the study reported herein. However, some investigation of in vitro cell behavior on TiO2 nanotube surfaces with different properties has been carried out in several different laboratories.Citation26–Citation30,Citation43 Park and colleagues found that adhesion, proliferation, migration, and osteogenic differentiation of rat bone marrow MSCs were highest on 15 nm nanotubes and was considerably lower on 70 nm nanotubes, with 100 nm nanotubes inducing cell death.Citation27 They further investigated the response of osteoblasts and osteoclasts on TiO2 nanotubes with six different diameters between 15 and 100 nm, and concluded that a 15 nm fluorinated TiO2 nanotube surface was an optimal geometry for cell adhesion and differentiation.Citation29 In contrast, Oh and colleagues reported that the stretching and expression of osteogenic differentiation markers of human MSCs was highest on 100 nm nanotubes, whereas cell adhesion rates increased with decreasing tube diameter, with a maximum at 30 nm.Citation28 However, as discussed above, cell behavior on TiO2 nanotube surfaces does not depend solely on the size of the nanotubes. Differences in such surface properties as the fluorinated TiO2 surface chemistry, nanocrystalline structure, and roughness may also explain some of the differences between the results obtained.
From the results of the study reported herein, it is evident that although the presence of a highly ordered nanotube structure may play an important role in improving bone response, this may not be the only reason for it. Regarding the effect of surface roughness, it has long been appreciated in modern implant dentistry that rougher implant surfaces result in better bone responses than smoother ones. The relevant roughness values that are reported in the literature vary from about Sa 0.3 to 3.6 μm, and differ between laboratories.Citation44–Citation47 In contrast, the present study showed that a superior bone response results from fluorinated TiO2 nanotube implants, despite their low roughness values, compared with blasted implant surfaces. Along these lines, supportive experimental data on surface chemistry-dependent bone response in vivo have been obtained from a series of previous in vivo investigations on nano- and microstructured Ca or Mg incorporated implant surfaces (CaTiO3 or MgTiO3) fabricated using micro arc oxidation (MAO) and metal plasma immersion ion implantation (MePIII).Citation18–Citation24
Thus, another key reason for the enhanced osseointegration and osseoconductivity is most likely to be rooted in the surface chemistry of the fluorinated titanium oxide nanotubes, eg, F-TiO2, TiOF2, and F-Ti-O, which exhibit strong chemical reactivity. It is therefore possible that chemical bonds are mostly formed covalently between fluorinated titanium oxide chemistry and bone components, particularly the cationic compounds and polar biomolecules that are involved in bone matrix and proteins. From in vitro investigation of HF-etched titanium surfaces, Cooper and colleagues reported that the gene expression of bone sialoprotein (BSP) by human MSCs increased with increasing relative F concentration from 1 to 5 wt.%.Citation48 In vivo evaluation of fluorinated TiO2 nanotube surfaces carried out by von Wilmowsky and colleagues revealed a significantly higher collagen type-I expression at days 7, 14, and 30 (P ≤ 0.044) for the nanotube structured titanium rod implants described as being 30 nm in diameter and 100 nm in length, with 5 wt.% F, and having an amorphous structure.Citation25 Sul and colleagues reported significantly increased removal torque values of fluorinated microporous titanium implants with 2 wt.% F and pores size ≤ 1.5 μm, using the same animal model and surgical protocol in the present study.Citation37
The mechanisms through which the surface properties of the fluorinated TiO2 nanotube structured implants improve the osseointegration strength and new bone formation are not currently defined sufficiently clearly. In order to explain the experimental finding that, despite their low roughness values, the use of surface chemistry-modified titanium implants resulted in superior osseointegration, osseoconductivity and implant stability compared with clinically available, moderately rough implants in animal models (blasted implants, blasted and acid etched implants, dual acid-etched implants, or anodized implants with or without P incorporation),Citation19,Citation21,Citation23,Citation49 Sul and colleagues have proposed a biochemical bond theory of the osseointegration.Citation23,Citation24 Recently, these authors developed a novel in vivo method to identify the biochemical bond, and validated its presence at the interface between the surface chemistry-modified, bioactive titanium implant and bone, thus also measuring the relative biochemical bond strength in an animal model.Citation24 Further studies are needed for a better understanding of how the fluorinated TiO2 nanotube implant surfaces are involved in improving the osseointegration and osseoconductivity.
Conclusions
The potentiostatic anodization of blasted, screw-shaped titanium implants at 20 V in 1 M H3PO4 + 0.4 wt.% HF for 30 minutes, one hour, and three hours resulted in the formation of highly ordered nanopore structures and vertically aligned nanotubes. The geometry of the nanotubes varied with reaction time: mean pore size, PSD, and porosity increased with reaction time, whereas length, spacing, and wall thickness of the nanotubes were independent of reaction time. Investigation of the nanotubes revealed the presence of the fluorinated titanium oxides of F-TiO2, TiOF2, and F-Ti-O with ≈5 wt.% F, and an amorphous structure, irrespective of the reaction time, while their Sa values decreased gradually and Sdr values increased slightly with the reaction time. The results of the animal study provided significant evidence that the nature of the nanotubes themselves and their fluorinated surface chemistry, rather than their surface roughness, engender quantitatively and qualitatively superior bone responses compared with the blasted, moderately rough implants that have been widely used as a clinical treatment option. These findings demonstrate that the use of TiO2 nanotubes shows considerable promise in the field of bone implants and bone tissue engineering. For future studies, optimization of the TiO2 nanotubes for the desired biological properties by screening a large number of electrochemical fabrication parameters is still needed to advance their potential applications.
Acknowledgements
Support from research grants from the Biotechnology Development Project (2009-008419) of the Ministry of Education and Human Resource Development, Republic of Korea, is gratefully acknowledged. The authors report no conflicts of interest in this work.
References
- ZwillingVAucouturierMDarque-CerettiEAnodic oxidation of titanium and TA6V alloy in chromic media. An electrochemical approachElectrochimi Acta1999456921929
- GhicovASchmukiPSelf-ordering electrochemistry: a review on growth and functionality of TiO2 nanotubes and other self-aligned MO(x) structuresChem Commun20092027912808
- MacakJMTsuchiyaHGhicovATiO2 nanotubes: Self-organized electrochemical formation, properties and applicationsCurr Opin Solid State Mater Sci2007111–2318
- MorGKVargheseOKPauloseMShankarKGrimesCAA review on highly ordered, vertically oriented TiO2 nanotube arrays: Fabrication, material properties, and solar energy applicationsSol Energy Mater Sol Cells2006901420112075
- ChenXMaoSSTitanium dioxide nanomaterials: Synthesis, properties, modifications, and applicationsChem Rev200710772891295917590053
- YaoCWebsterTJAnodization: a promising nano-modification technique of titanium implants for orthopedic applicationsJ Nanosci Nanotechnol200669–102682269217048475
- ChristensonEMAnsethKSvan den BeuckenJJNanobiomaterial applications in orthopedicsJ Orthop Res2007251112217048259
- VariolaFVetroneFRichertLImproving biocompatibility of implantable metals by nanoscale modification of surfaces: an overview of strategies, fabrication methods, and challengesSmall200959996100619360718
- SulYTJohanssonCWennerbergAOptimum surface properties of oxidized implants for reinforcement of osseointegration: surface chemistry, oxide thickness, porosity, roughness, and crystal structureInt J Oral Maxillofac Implants200520334935915973946
- SulYTJohanssonCBJeongYAlbrektssonTThe electrochemical oxide growth behaviour on titanium in acid and alkaline electrolytesMed Eng Phys200123532934611435147
- SulYTJohanssonCBPetronisSCharacteristics of the surface oxides on turned and electrochemically oxidized pure titanium implants up to dielectric breakdown: the oxide thickness, micropore configurations, surface roughness, crystal structure and chemical compositionBiomaterials200223249150111761170
- SulYTModified oxideUS Patent7291,178. 2007
- SulYTOsseoinductive magnesium-titanate implant and method of manufacturing the sameUS Patent7,452,566. 2008
- SulYTJohanssonCBJeongYOxidized implants and their influence on the bone responseJ Mater Sci Mater Med20011210–121025103115348359
- SulYTJohanssonCBJeongYWennerbergAAlbrektssonTResonance frequency and removal torque analysis of implants with turned and anodized surface oxidesClin Oral Implants Res200213325225912010155
- SulYTJohanssonCBRoserKAlbrektssonTQualitative and quantitative observations of bone tissue reactions to anodised implantsBiomaterials20022381809181711950051
- SulYTJohanssonCBKangYJeonDGAlbrektssonTBone reactions to oxidized titanium implants with electrochemical anion sulphuric acid and phosphoric acid incorporationClin Implant Dent Relat Res200242788712121607
- SulYTJohanssonCBAlbrektssonTOxidized titanium screws coated with calcium ions and their performance in rabbit boneInt J Oral Maxillofac Implants200217562563412381062
- SulYTThe significance of the surface properties of oxidized titanium to the bone response: special emphasis on potential biochemical bonding of oxidized titanium implantBiomaterials200324223893390712834584
- SulYTJeongYJohanssonCAlbrektssonTOxidized, bioactive implants are rapidly and strongly integrated in bone. Part 1 – experimental implantsClin Oral Implants Res200617552152616958691
- SulYTJohanssonCAlbrektssonTWhich surface properties enhance bone response to implants? Comparison of oxidized magnesium, TiUnite, and Osseotite implant surfacesInt J Prosthodont200619431932816900812
- SulYTKangBSJohanssonCThe roles of surface chemistry and topography in the strength and rate of osseointegration of titanium implants in boneJ Biomed Mater Res Part A2009894942950
- SulYTJohanssonCByonEAlbrektssonTThe bone response of oxidized bioactive and non-bioactive titanium implantsBiomaterials200526336720673015975649
- SulYTJohanssonCAlbrektssonTA novel in vivo method for quantifying the interfacial biochemical bond strength of bone implantsJ R Soc Interface2009424 [Epub ahead of print].
- von WilmowskyCBauerSLutzRIn vivo evaluation of anodic TiO2 nanotubes: an experimental study in the pigJ Biomed Mater Res Part B2009891165171
- PopatKCLeary SwanEEMukhatyarVInfluence of nanoporous alumina membranes on long-term osteoblast responseBiomaterials200526224516452215722120
- ParkJBauerSvon der MarkKSchmukiPNanosize and vitality: TiO2 nanotube diameter directs cell fateNano Lett2007761686169117503870
- OhSBrammerKSLiYSStem cell fate dictated solely by altered nanotube dimensionProc Natl Acad Sci U S A200910672130213519179282
- ParkJBauerSSchlegelKATiO2 nanotube surfaces: 15 nm – an optimal length scale of surface topography for cell adhesion and differentiationSmall20095666667119235196
- BurnsKYaoCWebsterTJIncreased chondrocyte adhesion on nanotubular anodized titaniumJ Biomed Mater Res Part A2009883561568
- von der MarkKBauerSParkJSchmukiPAnother look at “Stem cell fate dictated solely by altered nanotube dimension”Proc Natl Acad Sci U S A200910624E60; author reply E6119506261
- OhSBrammerKSLiYSReply to von der Mark et al: Looking further into the effects of nanotube dimension on stem cell fateProc Natl Acad Sci U S A20091067E61
- DonathKBreunerGA method for the study of undecalcified bones and teeth with attached soft tissues. The Sage-Schliff (sawing and grinding) techniqueJ Oral Pathol19821143183266809919
- BauerSKleberSSchmukiPTiO2 nanotubes: Tailoring the geometry in H3PO4/HF electrolytesElectrochem Commun20068813211325
- YasudaKSchmukiPControl of morphology and composition of self-organized zirconium titanate nanotubes formed in (NH4)2SO4/NH4F electrolytesElectrochim Acta2007521240534061
- PrakasamHEShankarKPauloseMVargheseOKGrimesCAA new benchmark for TiO2 nanotube array growth by anodizationJ Phys Chem C20071112072357241
- SulYTByonESJeongYBiomechanical measurements of calcium-incorporated oxidized implants in rabbit bone: effect of calcium surface chemistry of a novel implantClin Implant Dent Relat Res20046210111015669710
- YuJCYuJHoWJiangZZhangLEffects of F-doping on the photocatalytic activity and microstructures of nanocrystalline TiO2 powdersChem Mater200214938083816
- YamakiTSumitaTYamamotoSFormation of TiO2–xFx compounds in fluorine-implanted TiO2J Mater Sci Lett20022113335
- LiDHanedaHLabhsetwarNKHishitaSOhashiNVisible-light-driven photocatalysis on fluorine-doped TiO2 powders by the creation of surface oxygen vacanciesChem Phys Lett200540146579584
- DelplanckeJLWinandRGalvanostatic anodization of titanium – I. Structures and compositions of the anodic filmsElectrochim Acta1988331115391549
- BestettiMFranzSCuzzolinMArosioPCavallottiPLStructure of nanotubular titanium oxide templates prepared by electrochemical anodization in H2SO4/HF solutionsThin Solid Films20075151352535258
- KubotaSJohkuraKAsanumaKTitanium oxide nanotubes for bone regenerationJ Mater Sci Mater Med20041591031103515448411
- WennerbergAAlbrektssonTJohanssonCAnderssonBExperimental study of turned and grit-blasted screw-shaped implants with special emphasis on effects of blasting material and surface topographyBiomaterials199617115228962942
- BuserDNydeggerTOxlandTInterface shear strength of titanium implants with a sandblasted and acid-etched surface: a biomechanical study in the maxilla of miniature pigsJ Biomed Mater Res Part A19994527583
- RonoldHJEllingsenJEEffect of micro-roughness produced by TiO2 blasting – tensile testing of bone attachment by using coin-shaped implantsBiomaterials200223214211421912194524
- ShalabiMMGortemakerAVan’t HofMAJansenJACreugersNHImplant surface roughness and bone healing: a systematic reviewJ Dent Res200685649650016723643
- CooperLFZhouYTakebeJFluoride modification effects on osteoblast behavior and bone formation at TiO2 grit-blasted c.p. titanium endosseous implantsBiomaterials200627692693616112191
- SulYTJorgenJYoonGSJohanssonCBResonance frequency measurements in vivo and related surface characteristics of microstructured titanium implants: Magnesium-incorporated, micro-patterned and magnesium-incorporated, TiUnite®, Osseotite®, SLA® and TiOblast® implantsClin Oral Implants Res2009201146115519719742