

Abstract
Due to their special physicochemical properties, iron nanoparticles offer new promising possibilities for biomedical applications. For bench to bedside translation of super-paramagnetic iron oxide nanoparticles (SPIONs), safety issues have to be comprehensively clarified. To understand concentration-dependent nanoparticle-mediated toxicity, the exact quantification of intracellular SPIONs by reliable methods is of great importance. In the present study, we compared three different SPION quantification methods (ultraviolet spectrophotometry, magnetic particle spectroscopy, atomic adsorption spectroscopy) and discussed the shortcomings and advantages of each method. Moreover, we used those results to evaluate the possibility to use flow cytometric technique to determine the cellular SPION content. For this purpose, we correlated the side scatter data received from flow cytometry with the actual cellular SPION amount. We showed that flow cytometry provides a rapid and reliable method to assess the cellular SPION content. Our data also demonstrate that internalization of iron oxide nanoparticles in human umbilical vein endothelial cells is strongly dependent to the SPION type and results in a dose-dependent increase of toxicity. Thus, treatment with lauric acid-coated SPIONs (SEONLA) resulted in a significant increase in the intensity of side scatter and toxicity, whereas SEONLA with an additional protein corona formed by bovine serum albumin (SEONLA-BSA) and commercially available Rienso® particles showed only a minimal increase in both side scatter intensity and cellular toxicity. The increase in side scatter was in accordance with the measurements for SPION content by the atomic adsorption spectroscopy reference method. In summary, our data show that flow cytometry analysis can be used for estimation of uptake of SPIONs by mammalian cells and provides a fast tool for scientists to evaluate the safety of nanoparticle products.
Supplementary materials
Figure S1 Biophysical properties of SPIONs.
Notes: (A) Representative transmission electron micrographs of SEONLA-BSA, SEONLA and Rienso®. (B) Fourier transform infrared spectra of the nanoparticles. (C) Dynamic light scattering data of nanoparticles in water. (D) Zeta potential of investigated particles. (E–G) Biostability of nanoparticles. Nanoparticle stability was investigated in cell culture medium (E), and in ethylenediaminetetraacetic acid-stabilized sheep blood (F, G). Representative images were recorded using a digital camera (F) and optical bright-field microscopy (E, G). Data are expressed as the mean ± standard deviation (n=3).
Abbreviations: au, absorbance units; SEONLA, lauric acid-coated nanoparticles; SEONLA-BSA, lauric acid/albumin bovine serum hybrid-coated nanoparticles; SPIONs, superparamagnetic iron oxide nanoparticles.
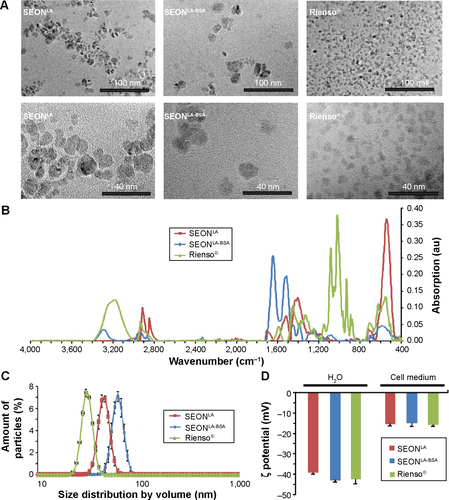
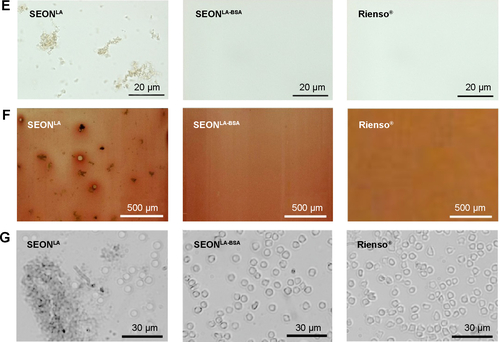
Figure S2 Suitability of UVS, MPS, and AAS techniques for the measurement of SPION concentration in lysis buffer.
Notes: (A) Absorption spectra of SPIONs (30 µgFe/mL). Arrow indicates the absorption peak at 370 nm. Correlation of UVS measurements at 370 nm (B), MPS measurements (C) and AAS measurements (D) with increasing SPION concentration in lysis buffer. Data are presented as mean ± standard deviation (n=3 with triplicates). R2 represents the coefficient of determination.
Abbreviations: SPION, superparamagnetic iron oxide nanoparticle; UVS, ultraviolet spectrophotometry; MPS, magnetic particle spectroscopy; AAS, atomic adsorption spectroscopy; SEONLA, lauric acid-coated nanoparticles; SEONLA-BSA, lauric acid/albumin bovine serum hybrid-coated nanoparticles; OD370, optical density at 370 nm; au, absorbance units.
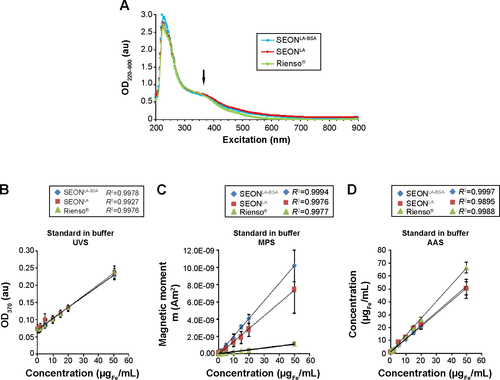
Figure S3 Representative flow cytometry graphs of SSc and FSc. HUVECs were cultured for 48 hours in medium containing 0–100 µgFe/mL SPIONs. SSc and FSc were measured by flow cytometry. Graphs show SSc plotted against FSc, and SSc against the number of counted cells (events).
Notes: (A) Graphs of untreated cells and cells treated with 100 µgFe/mL SEONLA, SEONLA-BSA, and Rienso®. (B) Graphs of cells treated with 10, 20, 30, and 40 µgFe/mL SEONLA. The underlying raw data and the data from the AAS measurements were used to determine the correlation between SSc and SPION content.
Abbreviations: au, absorbance units; SSc, side scatter; FSc, forward scatter; SPION, superparamagnetic iron oxide nanoparticle; HUVECs, human umbilical vein endothelial cells; SEONLA, lauric acid-coated nanoparticles; SEONLA-BSA, lauric acid/albumin bovine serum hybrid-coated nanoparticles; AAS, atomic adsorption spectroscopy.
Figure S4 Correlation between side scatter measurements and SPION-loads. HUVECs were cultured for 48 hours in medium containing 0–100 µgFe/mL SPIONs.
Notes: Relationship between the cellular SPION-load as measured by UVS (A) and MPS (B) and the normalized side scatter data delivered by flow cytometry. Results were acquired with SEONLA (left panel), SEONLA-BSA (middle panel), and Rienso® (right panel). Data are expressed as the mean ± standard deviation (n=3 with technical triplicates). R2 represents the coefficient of determination. y describes the mathematical relationship between side scatter and cellular SPION content.
Abbreviations: SPION, superparamagnetic iron oxide nanoparticle; HUVECs, human umbilical vein endothelial cells; UVS, ultraviolet spectrophotometry; MPS, magnetic particle spectroscopy; SEONLA, lauric acid-coated nanoparticles; SEONLA-BSA, lauric acid/albumin bovine serum hybrid-coated nanoparticles.
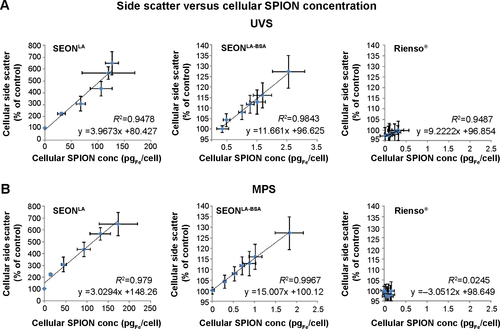
Table S1 Detection thresholds for UVS, MPS, AAS, and SSc
Acknowledgments
We thank Sibylle Bremer-Streck at the Institut für Klinische Chemie und Laboratoriumsdiagnostik in Jena for technical assistance with the AAS measurements. This study was supported by the Deutsche Forschungsgemeinschaft (SPP1681 [AL 552/5-1, TR 408/8-1], OD 18/23-1, HI 698/7-4, TR 408/4-3, CI162/2-1), by the Bavarian State Ministry for Environment and Consumer Protection, and the Deutsche Forschungsgemeinschaft Cluster of Excellence-Engineering of Advanced Materials (EAM).
Disclosure
The authors report no conflicts of interest in this work.