

Abstract
New methods of analysis involving semiconductor nanocrystals (quantum dots [QDs]) as fluorescent probes have been highlighted in life science. QDs present some advantages when compared to organic dyes, such as size-tunable emission spectra, broad absorption bands, and principally exceptional resistance to photobleaching. Methods applying QDs can be simple, not laborious, and can present high sensibility, allowing biomolecule identification and quantification with high specificity. In this context, the aim of this work was to apply dual-color CdTe QDs to quantify red blood cell (RBC) antigen expression on cell surface by flow cytometric analysis. QDs were conjugated to anti-A or anti-B monoclonal antibodies, as well as to the anti-H (Ulex europaeus I) lectin, to investigate RBCs of A1, B, A1B, O, A2, and Aweak donors. Bioconjugates were capable of distinguishing the different expressions of RBC antigens, both by labeling efficiency and by flow cytometry histogram profile. Furthermore, results showed that RBCs from Aweak donors present fewer amounts of A antigens and higher amounts of H, when compared to A1 RBCs. In the A group, the amount of A antigens decreased as A1 > A3 > AX = Ael, while H antigens were AX = Ael > A1. Bioconjugates presented stability and remained active for at least 6 months. In conclusion, this methodology with high sensibility and specificity can be applied to study a variety of RBC antigens, and, as a quantitative tool, can help in achieving a better comprehension of the antigen expression patterns on RBC membranes.
Supplementary material
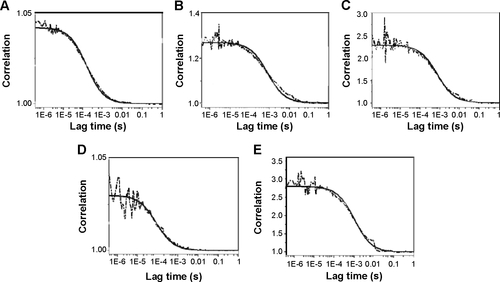
Figure S1 Typical fluorescence correlation spectroscopy curves of QDs and their bioconjugates.
Notes: Correlation curve (dashed line) and a fitting of the correlation curve (solid line) of the systems are represented for (A) orange QDs, (B) QDs-anti-A, (C) QDs-anti-B, (D) green QDs, and (E) QDs-anti-H.
Abbreviation: QDs, quantum dots.
Acknowledgments
The authors are grateful to Coordenação de Aperfeiçoamento de Pessoal de Nível Superior (CAPES), Conselho Nacional de Desenvolvimento Científico e Tecnológico (CNPq), and Fundação de Amparo à Ciência e Tecnologia do Estado de Pernambuco (FACEPE) for financial support and student fellowships. We are grateful for the access to equipment and assistance provided by the National Institute of Science and Technology on Photonics Applied to Cell Biology (INFABIC) at the State University of Campinas. INFABIC is co-funded by Fundação de Amparo a Pesquisa do Estado de São Paulo (FAPESP) (08/57906-3) and CNPq (573913/2008-0). We are also grateful to the National Institute of Science in Photonics (INFo) for financial resources. Additionally, we would like to thank Aggeu Magalhães of FIOCRUZ and Dr Irene Santos of Centro de Hemoterapia e Transfusão da Universidade de Campinas for the flow cytometry measurements and Fundação de Hematologia e Hemoterapia de Pernambuco (HEMOPE).
Disclosure
The authors report no conflicts of interest in this work.