
 ?Mathematical formulae have been encoded as MathML and are displayed in this HTML version using MathJax in order to improve their display. Uncheck the box to turn MathJax off. This feature requires Javascript. Click on a formula to zoom.
Abstract
Low selectivity of chemotherapy correlates with poor outcomes of cancer patients. To improve this issue, a novel agent, N-(1-[3-methoxycarbonyl-4-hydroxyphenyl]-β-carboline-3-carbonyl)-Trp-Lys-OBzl (PZL318), was reported here. The transmission electron microscopy, scanning electron microscopy, and atomic force microscopy images demonstrated that PZL318 can form nanoparticles. Fluorescent and confocal images visualized that PZL318 formed fluorescent nanoparticles capable of targeting cancer cells and tracing their interactions with cancer cells. In vitro, 40 μM of PZL318 inhibited the proliferation of tumorigenic cells, but not nontumorigenic cells. In vivo, 10 nmol/kg of PZL318 slowed the tumor growth of S180 mice and alleviated the thrombosis of ferric chloride-treated ICR mice, while 100 μmol/kg of PZL318 did not injure healthy mice and they exhibited no liver toxicity. By analyzing Fourier transform–mass spectrometry and rotating-frame Overhauser spectroscopy (ROESY) two-dimensional nuclear magnetic resonance spectra, the chemical mechanism of PZL318-forming trimers and nanoparticles was explored. By using mesoscale simulation, a nanoparticle of 3.01 nm in diameter was predicted containing 13 trimers. Scavenging free radicals, downregulating sP-selectin expression and intercalating toward DNA were correlated with the antitumor mechanism of PZL318.
Introduction
The lack of tumor selectivity of the anticancer drugs for clinical chemotherapy generally correlates with serious side reaction, low tolerance, and poor outcomes.Citation1–Citation3 Up to the present, this clinical issue still remains to be overcome; special efforts have even been made to develop anticancer drug delivery systems.Citation4–Citation7 The discovery of a novel strategy capable of targeting tumor tissues has been an urgent need.
β-carbolines are indole alkaloids that interact with DNA,Citation8–Citation12 and induce crossing-over and conversion of mitotic genes.Citation13 Other effects on cells and organs include modulating the extrinsic or death receptor pathway and the intrinsic or mitochondrial pathway,Citation14 interfering with Ras-related signaling pathways,Citation15 inhibiting tumor-related enzymes,Citation16–Citation19 and limiting thrombosis and inflammation.Citation20–Citation22 Inflammation is a well-recognized and critical component of the tumor progression,Citation23,Citation24 and thromboembolism is a leading cause of cancer patient death.Citation25,Citation26 In contrast to other indole alkaloids targeting DNA, β-carboline-3-carboxilic acid exhibits lower toxicity.Citation27
Nanospecies in biological systems have been deeply discussed in perspective.Citation28–Citation30 Various technologies and different models have been developed for preparing nanomaterials, determining their properties, and promoting the development of nanomedicine.Citation31–Citation34 Although nanodrugs have mainly focused on drug delivery systems, including liposomes, in the past decades,Citation35,Citation36 recently, the self-assembly of single small molecules at nanoscale,Citation37,Citation38 and their effects on biological activity, have been under intense investigation.Citation39,Citation40 Besides, a series of self-assembled single small molecules, including β-carboline-3-carboxylic acid derivatives, are able to enhance the biological efficiency via their nanospecies.Citation41–Citation47 However, the nanoscale interactions remain to be elucidated.
In this context, by analyzing the structural features of a series of derivatives of β-carboline-3-carboxylic acid, this paper designed N-(1-[3-methoxycarbonyl-4-hydroxyphenyl]-β-carboline-3-carbonyl)-Trp-Lys-OBzl (PZL318), a small molecule with fluorescence, to predict the docking score for the active pocket of calf thymus CT DNA; to explain the formation of the nanoparticles; to trace the interaction course of the nanoparticles with the tumorigenic cells, nontumorigenic cells, and the activation of platelets; to estimate the antitumor and antithrombotic activities of the nanoparticles; and to explore the action mechanisms thereof.
Materials and methods
General
Sprague Dawley rats and ICR mice were purchased from the Animal Center of Peking University. Work performed was based on a protocol reviewed and approved by the ethics committee of Capital Medical University. The committee assures that the welfare of the animals was maintained in accordance with the requirements of the Animal Welfare Act. Statistical analyses of all the biological data were carried out by use of analysis of variance. P-values <0.05 were considered statistically significant.
The protective amino acids (L-configuration), and sodium citrate (analytically pure) were available commercially (Sigma-Aldrich Corp, St Louis MO, USA), methanol spectroscopically pure was available commercially (Thermo Fisher Scientific, Waltham, MA, USA).
Synthesis of PZL318
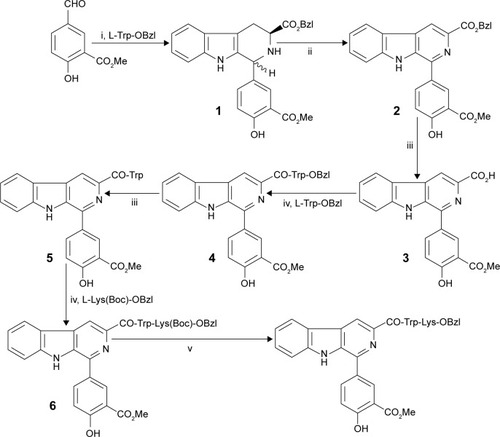
The preparation of PZL318 was carried out according to . The route consists of seven step reactions, and the total yield was 12%. The details of the synthetic procedure and the physicochemical data of the intermediates (1–6) and PZL318 are given as follows.
Figure 1 Synthetic route of PZL318.
Notes: i) CH2Cl2 and trifluoroacetic acid; ii) tetrahydrofuran and 2,3-dichloro-5,6-dicyano-1,4-benzoquinone; iii) MeOH, Pd/C, and H2; iv) Lys(Boc)-OBzl and DCC, HOBt, NMM, and THF; and v) hydrogen chloride in ethyl acetate (4 M).
Abbreviations: DCC, dicyclohexylcarbodiimide; HOBt, N-hydroxybenzotrizole; NMM, N-methyl-morpholine; THF, tetrahydrofuran.
Benzyl (3S)1-[4-hydroxy-3-(methoxycarbonyl) phenyl]-2,3,4,9-tetrahydro-1H-pyri-do(3,4-b)indole-3-carboxylate (1)
To a mixture of 11.76 g (40 mmol) of L-tryptophane benzyl ester and 7.92 g (44.0 mmol) of methyl 5-formyl-2- hydroxybenzoate in 100 mL of CH2Cl2, 10 mL of trifluoroacetic acid was added. The reaction mixture was stirred at room temperature for 48 hours and adjusted to pH 8 with concentrated ammonia liquor. This solution was washed successively with 5% aqueous sodium bicarbonate and saturated aqueous sodium chloride. The organic phase was separated and dried over anhydrous sodium sulfate. After filtration and evaporation under vacuum, 14.59 g (80%) of the title compound was obtained as yellow powders. Electrospray ionization (ESI)–mass spectrometry (MS) (m/e): 457 [M + H]+.
Benzyl (3S)1-[4-hydroxy-3-(methoxycarbonyl) phenyl]-9H-pyrido(3,4-b)indole-3-carboxylate (2)
With stirring to the solution of 4.56 g (10.0 mmol) of benzyl (3S)1-[4-hydroxy-3-(methoxycarbonyl)phenyl]-2, 3,4,9-tetrahydro-1H-pyrido(3,4-b)indole-3-carboxylate (1) in 100 mL of tetrahydrofuran, 4.54 g (20.0 mmol) of 2,3-dichloro-5,6-dicyano-1,4-benzoquinone was added. The reaction mixture was stirred at room temperature for 4 hours. The formed precipitates were collected by filtration and washed successively with 5% aqueous sodium bicarbonate, saturated aqueous sodium chloride, methanol, and ethyl ether to give 3.75 g (83%) of the title compound as colorless powders. ESI-MS (m/e): 453 [M + H]+. Melting point (Mp): 190°C–191°C. Proton nuclear magnetic resonance (1H NMR, 300 MHz; dimethyl sulfoxide [DMSO]-d6): δ/ppm =8.87 (s, 1H); 8.42 (m, 2H); 8.10 (dd, J=2.1 Hz; J=2.1 Hz, 1H); 7.69 (d, J=8.1 Hz, 1H); 7.57 (m, 3H); 7.37 (m, 3H); 7.04 (d, J=6.3 Hz); 5.46 (s, 1H); and 3.88 (s, 3H). 13C NMR (75 MHz; DMSO-d6): δ/ppm =169.28; 165.93; 142.35; 137.07; 135.13; 131.75; 129.30; 128.98; 128.47; 128.41; 122.40; 121.73; 120.62; 116.54; 114.71; 66.39; and 52.47.
1-[4-Hydroxy-3-(methoxycarbonyl)-phenyl]-9H-pyrido(3,4-b)indole-3-carboxylic acid (3)
To the solution of 2.26 g (5.0 mmol) of benzyl-1-[4-hydroxy-3-(methoxycarbonyl)phenyl]-9H-pyrido(3,4-b) indole-3-carboxylate (2) in 100 mL of methanol, 400 mg of Pd/C was added, replacing the air of the reaction with blowing H2 and stirring at room temperature for 48 hours. The Pd/C was removed by filtration. After evaporation under vacuum, 1.08 g (60%) of the title compound was obtained as yellow powders. ESI-MS (m/e): 361 [M–H]−. Mp: 227°C–228°C.
N-[1-(3-Methoxycarbonyl-4-hydroxyphenyl)-β-carboline-3-carbonyl]-Trp-OBzl (4)
At 0°C, to a solution of 1.47 g (5.0 mmol) of L-Trp-OBzl, 1 mL (9.0 mmol) of N-methylmorpholine, 1.133 g (5.5 mmol) of dicyclohexylcarbodiimide (DCC), 0.675 g (5.0 mmol) of N-hydroxybenzotriazol (HOBt), and 20 mL of anhydrous tetrahydrofuran, 1.81 g (5.0 mmol) of 1-[4-hydroxy-3-(methoxycarbonyl)phenyl]-9H-pyrido(3,4-b)indole-3-carboxylic acid (3) was added. After stirring at 0°C for 1 hour, the reaction mixture was stirred at room temperature for 5 hours, and thin-layer chromatography (chloroform/methanol, 150/1) indicated the complete disappearance of (3). The reaction mixture was filtered and the filtrate was evaporated under vacuum. The residue was dissolved in 150 mL of ethyl acetate and washed successively with 5% aqueous sodium bicarbonate, 5% aqueous citric acid, and saturated aqueous sodium chloride. The ethyl acetate phase was dried over anhydrous sodium sulfate. After filtration and evaporation under vacuum, the residue was purified on a silica gel column to provide 2.23 g (70%) of the title compound as colorless powders. ESI-MS (m/e): 639 [M + H]+. Mp: 157°C–158°C. (α)
(c=0.43, CH3OH). Infrared (IR) (KBr): 3,413.41; 1,731.68; 1,673.74; 1,660.21; 1,651.91; 1,633.40; 1,622.27; 1,615.71; 1,537.95; 1,520.14; 1,504.14; 1,494.43; 1,462.99; 1,455.25; 1,446.15; 1,355.63 cm−1. 1H NMR (300 MHz, CDCl3) δ/ppm =10.89 (s, 1H); 9.05 (s, 1H); 8.69 (d, J=8.1 Hz, 1H); 8.65 (s, 1H); 8.33 (d, J=2.1 Hz, 1H); 8.11 (d, J=7.2 Hz, 2H); 7.72 (dd, J=2.4 Hz, J=2.1 Hz, 1H); 7.57 (m, 3H); 7.38 (m, 3H); 7.32 (m, 1H); 7.14 (m, 1H); 6.99 (m, 3H); 5.25 (m, 1H); 5.16 (s, 2H); 3.88 (s, 3H); 3.48 (m, 2H); and 1.66 (s, 1H). 13C NMR (75 MHz, CDCl3) δ/ppm =172.09; 170.12; 165.13; 161.96; 140.80; 139.68; 139.64; 136.17; 135.74; 135.47; 134.48; 130.58; 129.19; 129.06; 128.87; 128.50; 128.22; 127.62; 122.91; 122.21; 122.16; 122.03; 121.00; 119.66; 118.79; 118.62; 113.28; 112.45; 111.99; 111.06; 110.31; 67.05; 53.15; 52.53; and 28.06.
N-[1-(3-Methoxycarbonyl-4-hydroxyphenyl)-β-carboline-3-carbonyl]-Trp (5)
To a solution of 3.19 g (5.0 mmol) of N-[1-(3-methoxycarbonyl-4-hydroxyphenyl)-β-carboline-3-carbonyl]-Trp-OBzl (4) in 50 mL of methanol, 500 mg of Pd/C was added, replacing the air of the reaction with blowing H2 and stirring at room temperature for 8 hours. The Pd/C was removed by filtration. After evaporation under vacuum, 1.97 g (72%) of the title compound was obtained as yellow powders. ESI-MS (m/e): 547 [M–H]−. Mp: 190°C–191°C. [α]
(c=0.83; CH3OH).
N-[1-(3-methoxycarbonyl-4-hydroxyphenyl)-β-carboline-3-carbonyl]-Trp-Lys-(Boc)-OBzl (6)
At 0°C, to a solution of 1.016 g (2.0 mmol) of L-Lys(Boc)-OBzl, 0.5 mL (4.5 mmol) of N-methylmorpholine, 0.566 g (2.3 mmol) of DCC, 0.27 g (2.0 mmol), of HOBt and 20 mL of anhydrous THF, 1.096 g (2.0 mmol) of N-[1-(3-methoxycarbonyl-4-hydro-xyphenyl)-β-carboline-3-carbonyl]-Trp (5) was added. After stirring at 0°C for 1 hour, the reaction mixture was stirred at room temperature for 5 hours, and thin-layer chromatography indicated the complete disappearance of (5). The reaction mixture was filtered and the filtrate was evaporated under vacuum. The residue was dissolved in 150 mL of ethyl acetate and washed successively with 5% aqueous sodium bicarbonate, 5% aqueous citric acid, and aqueous saturated sodium chloride. The ethyl acetate phase was dried over anhydrous sodium sulfate. After filtration and evaporation under vacuum, the residue was purified on silica gel column to provide 1.12 g (65%) of the title compound as colorless powders. ESI-MS (m/e): 867 [M + H]+.
N-[1-(3-methoxycarbonyl-4-hydroxyphenyl)-β-carboline-3-carbonyl]-Trp-Lys-OBzl (PZL318)
The solution of 0.560 g (0.65 mmol) of N-[1-(3-methoxycarbonyl-4-hydroxyphenyl)-β-carboline-3-carbonyl]-Trp(Boc)-Lys-OBzl (6) in 5.6 mL of ethyl acetate containing hydrogen chloride (4 M) was stirred at 0°C for 2 hours. The reaction mixture was evaporated under vacuum. The residue was dissolved in ethyl acetate and the solution was evaporated under vacuum. This procedure was repeated for four times to thoroughly remove hydrogen chloride. The residue was triturated with ether to provide 0.471 g (95%) of the title compound as yellow powders. Fourier transform (FT)-MS (m/e): 767 [M + H]+. Mp: 151°C–152°C. (α)
(c=0.55, CH3OH). IR (KBr): 3,391.12; 2,359.10; 1,738.49; 1,732.69; 1,716.04; 1,698.50; 1,682.78; 1,673.81; 1,661.84; 1,652.27; 1,646.27; 1,635.04; 1,622.50; 1,616.10; 1,557.87; 1,539.18; 1,532.58; 1,520.68; 1,506.21; 1,495.47; 1,471.61; 1,456.08; 1,372.95; 1,361.24; 1,338.37; 1,291.86; 1,247.99; 1,215.77; 743.05; 697.18; 667.25; 580.44; and 420.31 cm−1. 1H NMR (300 MHz, DMSO-d6) δ/ppm =11.94 (s, 1H); 10.88 (m, 2H); 8.79 (d, J=7.5 Hz, 1H); 8.75 (s, 1H); 8.58 (d, J=7.8 Hz, 1H); 8.44 (m, 2H); 8.03 (m, 4H); 7.65 (m, 3H); 7.37 (m, 9H); 7.02 (t, J=7.5 Hz, 1H); 6.88 (t, J=7.5 Hz, 1H); 5.17 (s, 2H); 4.92 (dd, J=7.8 Hz; J=9.9 Hz, 1H); 4.38 (dd, J=7.8 Hz; J=8.1 Hz, 1H); 3.96 (m, 4H); 3.23 (m, 2H); 2.74 (d, J=6.3 Hz, 2H); 1.79 (m, 2H); 1.55 (m, 2H); and 1.42 (m, 2H). 13C NMR (75 MHz, DMSO-d6) δ/ppm =172.23; 172.18; 169.34; 164.57; 160.76; 142.06; 140.08; 139.53; 136.66; 136.36; 135.82; 134.57; 130.75; 130.32; 129.12; 129.06; 128.86; 128.50; 128.35; 127.92; 124.31; 122.50; 121.70; 121.34; 120.74; 119.00; 118.62; 114.39; 113.24; 113.18; 111.78; 110.01; 66.50; 65.35; 53.58; 53.04; 52.44; 30.73; 28.80; 26.90; 22.72; and 15.61.
High-performance liquid chromatography (HPLC)–photodiode array analysis
An Agilent Technologies 1200 Series HLPC system (Agilent Technologies, Santa Clara, CA, USA) was used. The sample was separated on a Waters XTerra C18 reversed-phase column (2.1×150 mm, 5 μm; Waters Limited, Hertfordshire, UK) protected by a guard column of the same material (5×10 mm, 5 μm). The column thermostat was maintained at 40°C. To the column, 5 μL of a solution of PZL318 in methanol was injected for analysis. The mobile phase consisted of aqueous ammonia (0.2%) and methanol (35:65). The flow rate was 0.2 mL/minute. The column was washed with aqueous ammonia (0.2%) and methanol (35:65), and equilibrated to initial conditions for 15 minutes. Ultraviolet (UV) absorption spectra were recorded online. The UV detector was set to a scanning range of 200–400 nm, and a wavelength of 281 nm was used to monitor PZL318. The chromatogram was recorded and gave PZL318 a retention time of 13.931 minutes and a purity of 98.84%.
Docking of PZL318 toward DNA
PZL318 was sketched in ChemDraw 10.0, converted to 3D conformation in Chem3D 10.0, and then energy minimized in Discovery Studio 3.5 with a Merck molecular force field (Merck & Co.). The energy-minimized conformation was utilized as the starting conformation for conformation generation. The energy-minimized conformations of PZL318 were sampled in the whole conformational space via systematic search and BEST methods in Discovery Studio 3.5. Both of the systematic search and BEST methods were practiced with a SMART minimizer using CHARMM (Chemistry at HAR-vard Macromolecular Mechanics) force field. The energy threshold was set to 20 kcal/mol at 300 K. The maximum minimization steps were set to 200 and the minimization root mean squared (RMS) gradient was set to 0.1 Å. The maximum generated conformations were set to 255 with a RMS deviation (RMSD) cutoff of 0.2 Å. The 3D structures of PZL318 and doxorubicin (reference ligand) were built by following the procedure mentioned. Docking calculations were performed with the LibDock module implemented in Accelrys Discovery studio 3.5 (Accelrys, San Diego, CA, USA), which is a high-throughput docking algorithm that positions catalyst-generated ligand conformations in the protein active site based on polar and apolar interaction sites (hotspots). The results could be displayed by analyzing and scoring the docked ligand poses. To find a top ranked pose and measure the goodness of a docking study, the LibDock Score can be used as the criteria. The binding site “hotspots” were set to 100. The conformation generation of ligands was achieved using the BEST method. The energy threshold was set to 20 kcal/mol. The maximum minimization steps were set to 1,000, and the minimization RMS gradient was set to 0.001 Å. The maximum generated conformations were set to 255 with an RMSD cutoff 1.0 Å.
UV spectrum assay reflecting the interaction of PZL318 and CT DNA
UV spectrum assay can visualize the intercalation of PZL318 toward DNA, and this assay was performed. In brief, after recording the UV spectrum (Shimadzu 2550 spectrophotometer, 220–350 nm wavelength; Shimadzu Corporation, Kyoto, Japan) of 40.0 μM of PZL318 in phosphate buffered saline (PBS) (3 mL, pH 7.4), 30 μL of CT DNA in PBS (pH 7.4; 6.010−4 M; final concentration: 0 μM; 6.0 μM; 12.0 μM; 18.0 μM; 24.0 μM; and 30.0 μM) was added and the spectra of PZL318 plus CT DNA was recorded to monitor the effect of CT DNA on the UV spectrum of PZL318.
Fluorescent spectrum assay for PZL318 intercalating toward CT DNA
Fluorescent spectrum assay can visualize the intercalation of PZL318 toward DNA, and this assay was performed. In brief, after recording the fluorescent spectrum of PZL318 in PBS (2 mL, pH 7.4, 40 μM; Shimadzu RF-5310PC spectrofluorometer, 286 nm of fluorescence excitation wavelength; Shimdazu Corporation), a series of solutions of CT DNA in PBS (20 μL, pH 7.4; final concentration: 0 μM; 6.0 μM; 12.0 μM; 18.0 μM; 24.0 μM; 30.0 μM; and 36.0 μM) was added, and the spectra of PZL318 plus CT DNA were recorded to monitor the effect of CT DNA on the fluorescent spectrum of PZL318.
Circular dichroic spectrum assay for PZL318 intercalating toward CT DNA
Recording the circular dichroic spectrum assay can visualize the intercalation of PZL318 toward DNA, and this assay was performed. In brief, the solution of CT DNA in PBS (pH 7.4, 900 μL; 10−4 M) and 100 μL of solution of PZL318 in PBS (pH 7.4; 2×10⁻³ M or 1×10⁻³ M or 5×10⁻⁴ M) was mixed, incubated at 37°C for 3 hours, and then the curve was recorded according to a standard procedure (on a JASCO J-810; JASCO Applied Sciences, Halifax, NS, Canada) (scan speed: 500 nm/minute; resolution step: 0.2 nm; sensitivity: 50 mdeg; k=200–350 nm; response: 0.5 seconds; bandwidth: 15 nm; and accumulations: 5).
Relative viscosity assay for PZL318 intercalating toward CT DNA
The intercalation of PZL318 toward DNA could be mirrored with the relative viscosity of DNA; the relative viscosity assay was performed, and the data are shown in (recorded on a Ubbelohde viscometer, immersed in a thermostated water bath maintained at 28°C). In the assay, to the solution of CT DNA in PBS (13 mL, 5.0×10⁻⁴ M), the solution of PZL318 in PBS (130 μL; final concentration: 5.0 μM; 10.0 μM; 20.0 μM; 40.0 μM; and 60.0 μM) was added to keep the ratio of (PZL318):(CT DNA) in the range of 0–0.36 to form the samples, and the flow time of the samples was measured after a thermal equilibrium time of 5 minutes. The flow time of each sample was calculated. The relative viscosities of CT DNA in the presence and absence of PZL318 were calculated from the equation,
MALDI–mass test
ESI mass spectra were acquired with the use of a solariX FT–ion cyclotron resonance–MS (Bruker Corporation, Billerica, MA, USA) consisting of an ESI/matrix-assisted laser desorption/ionization (MALDI) dual ion source and a 9.4 T superconductive magnet. Measurements were carried out with the positive MALDI ion mode. A Smartbeam-II laser (wavelength: 355 nm; focus setting: “medium”; repetition rate: 1,000 Hz) was used as the ion source. The collision-induced dissociation (qCID) mass was set to 2,260.63956 m/z, and the isolation window was 5 m/z. Data were acquired using solariXcontrol software. Spectral data were processed with data analysis software (Bruker Corporation).
ROESY 2D NMR spectrum test
1H NMR spectra were recorded on a Bruker 800 MHz spectrometer with DMSO-d6 as the solvent and tetramethylsilane as the internal standard.
3D structure generation and association model
The 2D structure of PZL318 was sketched in ChemDraw Ultra 10.0. The 3D structure was created and energy minimized until the minimum RMS reached 0.001 in Chem3D Ultra 10.0. The 3D structure was then energy minimized in Discovery Studio 2.1 with the Merck molecular force field. The energy-minimized conformation was used as the starting point for the conformation generation for PZL318. Energy-minimized conformations were sampled in the whole conformational space via the systematic search method and the BEST method in Discovery Studio 2.1. The systematic search and BEST methods were both performed with the SMART minimizer using the CHARMM force field. The energy threshold was set to 20 kcal/mol at 300 K. The maximum minimization steps were set to 200, and the minimization RMS gradient was set to 0.1 Å. The maximum generated conformations were set to 255 with an RMSD cutoff of 0.2 Å. The association model shown was proposed according to the 3D structure and the intermolecular interactions identified with the rotating-frame Overhauser spectroscopy (ROESY) 2D NMR and ESI-MS spectra of PZL318.
TEM test
Shape and size examinations of the PZL318 nanospecies were performed with transmission electron microscopy (TEM) (JSM-6360 LV, JEOL, Tokyo, Japan). An aqueous solution of PZL318 (pH 7.0) was dripped onto a formvar-coated copper grid, and then a drop of anhydrous ethanol was added to promote water removal. The grid was first allowed to dry thoroughly in air and it was then heated at 35°C for 24 hours. The samples were viewed under TEM. The shape and size distributions of the nanospecies were determined by counting >100 species in randomly selected regions on the TEM copper grid. All of the determinations were carried out on triplicate grids. The TEM was operated at 80 kV (the electron beam accelerating voltage). Images was recorded on an imaging plate (Gatan Bioscan Camera Model 1792; Gatan, Inc., Pleasanton, CA, USA) with 20 eV energy windows at 6,000–400,000× and they were digitally enlarged.
SEM test
The shape and size of the nanospecies in lyophilized powders (from a solution of PZL318 in ultrapure water) were measured by scanning electron microscopy (SEM) (JEM-1230; JEOL) at 50 kV. The lyophilized powders were attached to a copper plate with double-sided tape (Euromedex, Souffelweyersheim, France). The specimens were coated with 20 nm gold–palladium using a JEOL JFC-1600 Auto Fine Coater. The coater was operated at 15 kV, 30 mA, and 200 mTorr (argon) for 60 seconds. The shape and size distributions of the nanoparticles were measured by examining >100 particles in randomly selected regions on the SEM alloy. All measurements were performed on triplicate grids. Images were recorded on an imaging plate (Gatan Bioscan Camera Model 1792; Gatan, Inc.) with 20 eV energy windows at 100–10,000×, and they were digitally enlarged.
AFM test
Atomic force microscopy (AFM) images were obtained using the contact mode on a Nanoscope 3D AFM (Veeco Instruments, Inc., Plainview, NY, USA) under ambient conditions. Samples of PZL318 in water or in rat plasma (10−6 M at pH 7.0) were used for recording the images.
Theoretically predicting nanoparticle size
The mesoscale simulation software was used to perform the calculation, and to predict how many trimers of PZL318 can construct the smallest nanoparticle revealed by TEM. The Discover module of the Materials Studio software was used for the simulation. The PZL318 molecule was built and optimized simply in the Visualizer window. “Beads” were constructed from atomistic simulations and placed at the center-of-mass of groups of atoms corresponding to particular parts of the PZL318 molecule.
Size test
To represent the stability of the nanoparticles, 10−6 nM solution of PZL318 in ultrapure water was prepared, the 10-day particle sizes were tested for size and polydispersity index (PDI) by dynamic light scattering on a Malvern Zetasizer (Nano-ZS90; Malvern Instruments, Malvern, UK) with the DTS (Nano) Program.
Zeta potential test
After 12-day storage at room temperature, the solution of PZL318 in ultrapure water (10−6 nM) received zeta potential measurements at the mode of automatic measurement on a Malvern’s Zetasizer (Nano-ZS90; Malvern Instruments) with the DTS (Nano) Program.
Cell uptake of PZL318
HeLa or HaCaT cells (5×10⁴ cells/mL) were incubated in Dulbecco’s Modified Eagle’s Medium (DMEM) [containing 10% (v/v) fetal calf serum, 60 μg mL−1 penicillin, and 100 μg mL−1 streptomycin] at 37°C in a humidified atmosphere containing 5% CO2 for 24 hours. After removing the original medium, a solution of PZL318 (final concentration: 40 μM, in complete DMEM medium as above; 1 mL/well) was added, and cells were incubated at 37°C in a humidified atmosphere (containing 5% CO2) for 0 minutes, 15 minutes, 30 minutes, 60 minutes, 120 minutes, and 360 minutes. After removing the medium, the cells were washed with fresh medium (1 mL ×3 times) and resuspended in fresh medium (1 mL/well). PZL318 on the cell surface and in the cytoplasm were analyzed by use of an Axio Observer A1 fluorescence microscope (Carl Zeiss Meditec AG, Jena, Germany) or TCS SP5 confocal microscopy (Leica Microsystems, Wetzlar, Germany), respectively.
In vitro antiproliferation assay
In vitro cell viability assays were carried out using 96-well microtiter culture plates and 3-(4,5-dimethylthiazol-2-yl)-2, 5-diphenyltetrazolium bromide (MTT) staining, according to the standard procedures. S180, HeLa, HaCaT, and L02 cells (5×10⁴ cells/mL) were grown in DMEM medium [containing 10% (v/v) fetal calf serum; 60 μg mL−1 of penicillin, and 100 μg mL−1 of streptomycin]. Stock solution of PZL318 was prepared in DMSO and diluted with culture medium to desired concentrations. Cultures were propagated at 37°C in a humidified atmosphere (with 5% CO2) for 24 hours, and then PZL318 was added (final concentration was 40 μM). After 48 hours of treatment, MTT solution was added (5 μg/mL; 25 μL per well), and cells were incubated for an additional 4 hours. The optical density was measured at 570 nm by a microplate reader, after adding 100 μL of DMSO to dissolve the MTT–formazan product (n =6).
In vivo antitumor assay
Male ICR mice (purchased from Capital Medical University) were maintained at 21°C with a natural day/night cycle in a conventional animal colony. Mice were 10 weeks old at the beginning of the experiment. S180 ascites tumor cells were subcutaneously injected to form solid tumors. To initiate subcutaneous tumors, cells obtained in ascitic form from tumor-bearing mice were serially transplanted once per week. Subcutaneous tumors were implanted under the skin at the right armpit by injecting 0.2 mL of normal saline (NS) containing 2×10⁶ viable tumor cells. Twenty-four hours after implantation, mice were randomly divided into treatment groups (12 per group). Treatments were: PZL318 (0.001 μmol/kg or 0.01 μmol/kg); doxorubicin (1 μmol/kg; positive control); or vehicle only (negative control). NS (0.2 mL) was the vehicle. Injections were given intraperitoneally every day for 7 days. Mice were weighed daily. Twenty-four hours after the last injection, mice were weighed, sacrificed by ether anesthesia, and dissected to immediately obtain and weigh the tumor.
Distribution of PZL318 in tumor tissue and vital organs
The tumors, brain, heart, liver, spleen, kidney and blood from the mice receiving in vivo antitumor assay were analyzed by comparing to a PZL318 standard curve in HPLC. A Waters 2695 HPLC system with a Waters 2475 fluorescent detector was used (Waters Limited). The sample was separated on a Waters XTerraC18 reversed-phase column (5 μm; 150×2.1 mm) (Waters Limited) protected by a guard column of the same material (5 μm; 10×5 mm). Onto the column, 10 μL of sample solution was injected for analysis. The mobile phase consisted of solvent A (chromatographic pure methanol) and solvent B (0.2% aqueous ammonia). The flow rate was 0.2 mL/minute. Before each run, the column was washed with chromatographic pure methanol and equilibrated at initial condition for 15 minutes. Fluorescent absorption spectrum was recorded at 420 nm.
To draw the standard curve, a stock solution of 1,000 μg/mL of PZL318 (98.84% purity) was diluted with chromatographic pure methanol to prepare the standard solutions of PZL318 (concentrations: 0.16 μg/mL, 0.63 μg/mL, 2.5 μg/mL, 5.0 μg/mL and 10.0 μg/mL). A five-point calibration curve of PZL318 was drawn by injecting 10 μL of the solution; the area under the curve (AUC) was measured to establish the standard curve. To determine the blood and tissue levels of PZL318, the tumor, brain, heart, liver, spleen, kidney, and blood were quantitatively collected from the S180 mice treated with 0.1 μmol/kg of PZL318. After collection, the blood was centrifuged in Eppendorf tubes for 15 minutes at 300 g to separate plasma. All the tissues and plasma were thoroughly extracted with chromatographic pure methanol. The methanol solution was evaporated under vacuum. The residue was dissolved in 100 μL of chromatographic pure methanol, centrifuged at 1,000 g for 10 minutes to provide, the supernatant for HPLC analysis. By injecting 10 μL of the solution, the AUC was measured to calculate the level of PZL318 according to the standard curve.
In vivo liver injury assay
The blood from the mice receiving in vivo antitumor assay was collected and centrifuged at 500 g for 10 minutes to get the serum samples. Then, alanine transaminase (ALT) and aspartate transaminase (AST) in serum were measured according to guidance of the kits (AST/GOT testing kit, ALT/GPT testing kit; JCBIO Co., Nanjing, People’s Republic of China).
In vivo toxicity assay
ICR mice (purchased from Capital Medical University) were maintained at 21°C with a natural day/night cycle in a conventional animal colony. Mice were 10 weeks old at the beginning of the experiment. Twelve hours after fasting, mice were randomly divided into treatment groups (12 per group). Treatments were: intraperitoneal injection of PZL318 100 μmol/kg; or vehicle only (negative control). NS (0.2 mL) was the vehicle. We weighted the body weights and the food weights at 0 hour and 48 hour of the experiments to calculate the change of body weight and the consume of the food. Forty-eight hours later, the anesthetized mice were killed and the organs were weighed.
In vivo antithrombotic assay
Aspirin (as a positive control) and PZL318 were dissolved in NS (vehicle) shortly before administration. Male ICR mice (12 per group; weight range: 20–25 g) were intraperitoneally injected with PZL318 (0.01 μmol/kg), orally dosed with aspirin (83 μmol/kg), or intraperitoneally injected with NS (10 mL/kg). The mice were anesthetized with chloral hydrate (10 g/100 mL, intraperitoneally) and 1 cm of segment abdominal aorta was dissected. Then, thrombosis was triggered immediately by way of vessel damage, the artery was wrapped in gauze strips (0.5 cm in width and 3 cm in length) saturated with 25% ferric chloride solution for 15 minutes, 0.5 cm of artery segments with thrombi formation were excised, and the weights of the thrombus were determined. Data were statistically analyzed by Student’s t-test. P-values <0.05 were considered statistically significant.
Aortic strip contraction strain assay
Immediately after decapitation, rat aortic strips of 3–5 mm in length were prepared and put in a perfusion bath with 15 mL of warmed (37°C), oxygenated (95% O2, 5% CO2) Krebs solution (pH 7.4). The aortic strips were connected to the tension transducers and their relaxation–contraction curves were drawn on a two-channel recorder (paper speed: 1 mm/minute). The rest strain of the tension transducers was adjusted to 1.0 g, the strips were balanced for 30 minutes, and noradrenaline (NE, final concentration: 10−8 M; Sigma-Aldrich Co., St Louis, MO, USA) was added to trigger the prestimulation of the strips. On removal of NE by washing, the strips were balanced for another 30 minutes. When the constriction strain stabilized at a maximal level, 20 μL of NS or 20 μL of the solution of PZL318 in NS (final concentration: 5×10⁻⁷ M) was added. Upon stabilization, 20 μL of the solution of Ach (Sigma-Aldrich Co.) in NS (final concentration: 10−6 M) was added, and the NO· scavenging activity of PZL318 was expressed with the inhibition percentage of Ach-induced vasorelaxation.
ESR assay for NO· free radicals
On a JEOL JES300ESR, the signal of NO· free radicals, which was produced by the reaction of 5 μL of a solution of 7.325 mg of N-methyl-D-glucamine dithiocarbamate (MGD; Sigma-Aldrich Co.) in 1 mL of ultrapure water (25 mM); 5 μL of a solution of 3.475 g of FeSO4·7H2O (Sinopharm Chemical Reagent Beijing Co., Ltd., Beijing, People’s Republic of China) in 1 mL of ultrapure water (12.5 mM); and 5 μL of a solution of 0.25 mg of S-nitroso-N-acetyl-DL-penicillamine (SNAP; Sigma-Aldrich Co.) in 1 mL of ultrapure water (1.1 μM), were measured. The height of the signal was calculated and defined as the blank height of the NO· signal (BHNO). The effect of PZL318 on the level of NO· free radicals was measured by the signal of NO· free radicals formed from 5 μL of the solution of 7.325 mg of MGD in 1 mL of ultrapure water (25 mM), 5 μL of the solution of 3.475 g of FeSO4·7H2O in 1 mL of ultrapure water (12.5 mM), 5 μL of the solution of 0.25 mg of SNAP in 1 mL of ultrapure water (1.1 μM), and 5 μL of the solution of PZL318 in 1 mL of ultrapure water (final concentration: 1×10⁻⁶ M); the height of the signal was calculated and defined as the PZL318-treated height of the NO· signal (THNO). The NO· scavenging ratio was calculated according to the formula:
ESR assay for ·O2− free radicals
On a JEOL JES300ESR, the signal of ·O2− 2 free radicals, which were produced by the reaction of 5 μL of the solution of 11.316 mg of dimethylpyridine N-oxide (DMPO; Sigma-Aldrich Co.) in 1 mL of ultrapure water (0.1 M), 5 μL of a solution of diethylenetriamine pentaacetic acid (DETAPAC; Sigma-Aldrich Co.) in ultrapure water (0.9 mM), 5 μL of the solution of 0.3 g of xanthine (Sigma-Aldrich Co.) in 1 mL of ultrapure water (0.5 M), and 5 μL of the solution of commercial xanthine oxidase (Sigma-Aldrich Co.) diluted by ultrapure water (1/10, v/v) was measured; the height of the signal was calculated and defined as the blank height of the ·O2−signal (BH·O2−). The effect of PZL318 on the level of ·O2− free radicals was measured by the signal of ·O2− free radicals formed from 5 μL of the solution of 11.316 mg of DMPO in 1 mL of ultrapure water (0.1 M), 5 μL of a solution of DETAPAC in ultrapure water (0.9 mM), 5 μL of the solution of 0.3 g of xanthine in 1 mL of ultrapure water (0.5 M), 5 μL of the solution of commercial xanthine oxidase diluted by ultrapure water (1/10, v/v), and 5 μL of the solution of PZL318 in 1 mL of ultrapure water (final concentration: 1×10⁻⁶ M); the height of the signal was calculated and defined as the PZL318-treated height of the O2− signal (TH O2−). The O2− scavenging ratio was calculated according to the formula:
ESR assay for ·OH free radicals
On a JEOL JES300ESR, the signal of ·OH free radicals, which were produced by the reaction of 2.5 μL of the solution of 2.78 g of FeSO4·7H2O in 1 mL of ultrapure water (10 mM); 2.5 μL of the solution of 11.32 mg of DMPO in 1 mL of ultrapure water (0.1 M); and 5 μL of H2O2 (Sinopharm Chemical Reagent Beijing Co., Ltd.; 100 mM), was measured; the height of the signal was calculated and defined as the blank height of the ·OH signal (BH·OH). The effect of PZL318 on the level of ·OH free radicals was measured by the signal of ·OH free radicals formed from 2.5 μL of the solution of 2.78 g of FeSO4·7H2O in 1 mL of ultrapure water (10 mM), 2.5 μL of the solution of 11.32 mg of DMPO in 1 mL of ultrapure water (0.1 M), 5 μL of H2O2 (100 mM), and 5 μL of the solution of PZL318 in 1 mL of ultrapure water (final concentration: 1×10⁻⁶ M); the height of the signal was calculated and defined as the PZL318-treated height of the ·OH signal (TH·OH). The ·OH scavenging ratio was calculated according to the formula:
P-selectin enzyme-linked immunosorbent assay
Into a syringe containing 500 μL of 3.8% sodium citrate (anticoagulant), 4,500 μL of blood from the carotid of an anesthetized rat was collected and centrifuged at 200 g for 20 minutes to collect the plasma. To 960 μL of the plasma, 20 μL of PZL318 in NS (1 μM) or 20 μL of NS was added. The reaction mixtures were incubated at 37°C for 10 minutes; then, 20 μL of arachidonic acid (AA) in NS (0.15 g/L) was added and incubated for another 5 minutes. The plate was treated according to the manufacturer’s instructions (Rat P-selectin enzyme-linked immunosorbent assay kit; RAPID West Hills, CA, USA). At 450 nm, the optical density (OD) value of each well was tested and the P-selectin level was calculated according to the standard samples from the kit.
P-selectin flow cytometry assayCitation48
Rat blood was collected in an aqueous solution of 3.8% sodium citrate (1:9, v/v) and immediately centrifuged at 160 g for 15 minutes to collect platelet-rich plasma (PRP). To 500 μL of PRP, 10 μL of PZL318 (final concentration: 1 μM) was added, and the reaction mixture was incubated at 37°C for 30 minutes, to which 10 μL of AA in NS (0.15 mg/mL) was added. The system was incubated for 5 minutes at 37°C and centrifuged at 500 g for 10 minutes to allow the platelets to precipitate. The precipitated platelets were then stained with phycoerythrin (PE)–anti-CD62P (Shanghai XingYou Biological Technology Co., Ltd., Shanghai, People’s Republic of China) for 20 minutes. PE fluorescence for gated platelet populations was analyzed for ~10,000 events (counts) per sample aliquot, and fluorescence data were recorded accordingly. The level of platelet activation was assessed by the fluorescence height of P-selectin.
SEM of PZL318-treated platelets
Rat blood was collected in an aqueous solution of 3.8% sodium citrate (1:9, v/v) and immediately centrifuged at 160 g for 15 minutes to collect PRP. To 500 μL of PRP, 10 μL of PZL318 (final concentration: 1 μM) was added, and the mixture was incubated at 37°C for 5 minutes, to which 10 μL of AA in NS (0.15 mg/mL) was added. The system was incubated for 5 minutes at 37°C and centrifuged at 2,000 g for 15 minutes to allow the platelets to precipitate. The precipitated pellets were then immersed in 3% glutaraldehyde solution (Sinopharm Chemical Reagent Beijing Co., Ltd.) for 1 hour. Glutaraldehyde was separated using centrifugation, while the supernatant was discarded. The precipitants were subsequently washed in phosphate buffer for a total of three times and postfixed in 1% osmium tetroxide (Sigma-Aldrich Co.) for 1 hour. The sample was centrifuged again and treated with 50% ethanol for 10 minutes and for a total of two times. Then, the sample was dehydrated in graded series of ethanol (70%, 80%, 90%, and 100%), and incubated for 10 minutes. The sample was dried using a critical point dryer (CPD300; Leica Microsystems). The dried samples were mounted on an aluminum stub, coated with platinum using an autofine coater (JFC-1600; JEOL), and observed by SEM (S-4800; Hitachi Ltd., Tokyo, Japan).
Results
Molecular docking of PZL318 toward DNA
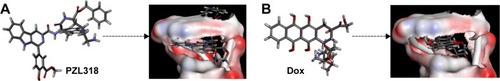
To predict the utility of PZL318 as the probe of anticancer agents, the molecular docking was performed following the standard procedure, and the stereo view of PZL318 and Dox, a known ligand, docking the crystal structures of DNA (Protein Data Bank ID: 1NAB) is shown in , and the docking score of PZL318 (220.450) is equal to that of Dox (216.531), suggesting that PZL318 has a satisfactory high score.
Figure 2 Stereoview of PZL318 and Dox in the pocket of DNA.
Notes: (A) PZL318; (B) Dox.
Abbreviation: Dox, doxorubicin.
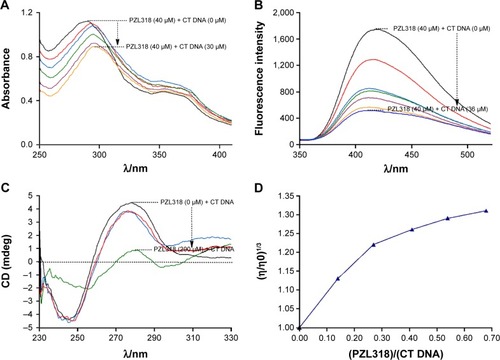
Some direct supports are provided by the in vitro intercalation of PZL318 toward CT DNA (). As can be seen, includes one spectrum of PZL318 alone and five spectra of PZL318 plus CT DNA. Clearly, CT DNA induced the spectra of PZL318, which had a total hypochromic effect of 20.7% and a total bathochromic shift of 8 nm, implying that the changes that occurred in the UV spectra were capable of visualizing the intercalation of PZL318 with CT DNA. includes one spectrum of PZL318 alone and six spectra of PZL318 plus CT DNA, which described a typical course for the fluorescence quenching. In the fluorescence quenching, a gradual decrease in the fluorescence intensity of PZL318 followed a gradual increase in the concentration of CT DNA. When the concentration of CT DNA was increased to 36 μM, the fluorescence intensity of PZL318 was lowered 70.3%. Besides, the total hypsochromic shift of 8 nm was also observed. includes a positive band (at 273 nm) and a negative band (at 245 nm). The positive band mirrors the base stacking and the negative band mirrors the right-handed helix. Besides, the intensity of both the positive band and negative band decreased, which could be the results of DNA intercalation. showed that PZL318 consistently increased the relative viscosity of CT DNA, and it visualized the intercalation of PZL318 toward DNA.
Figure 3 The in vitro intercalation of PZL318 towards CT DNA.
Notes: (A) Hypochromic effect and bathochromic shift occurred in the UV spectra of PZL318 plus CT DNA (0 μM, 6.0 μM, 12.0 μM, 18.0 μM, 24.0 μM, and 30.0 μM). (B) Course of fluorescence quenching of PZL318. In PBS (pH 7.4) the titration of 20 μL of CT DNA (0 μM, 6.0 μM, 12.0 μM, 18.0 μM, 24.0 μM, 30.0 μM, and 36.0 μM) concentrations dependently resulted in the typical course of fluorescence quenching of PZL318. (C) Effect of PZL318 on the CD spectra of CT DNA. A consistent variation of the intensity of both positive and negative bands in the CD spectra of CT DNA resulted from the intercalation of PZL318 toward CT DNA. (D) Effect of PZL318 at various concentrations on the relative viscosity of CT DNA (5.0×10⁻⁴ M; 28°C).
Abbreviations: CT DNA, calf thymus DNA; UV, ultraviolet; PBS, phosphate buffered saline; CD, circular dichroic.
Intermolecular actions driving PZL318 to form trimers and nanoparticles
To understand the course of PZL318 forming nanoparticles, the FT-MS and ROESY 2D NMR spectra were elucidated. gives an ion peak at 767.32239 of the mass of a monomer plus H, an ion peak at 1,533.66397 of the mass of a dimer plus H, and an ion peak at 1,150.97219 of the mass of a trimer plus 2H. The quadrupole collision-induced dissociation (qCID) spectrum is inserted to demonstrate that the dimer and the monomer resulted from the splitting of the trimer. Thus, the FT-MS spectrum supports that in aqueous solution, PZL318 exists as trimers.
Figure 4 FT-MS spectrum, ROESY 2D NMR spectrum, 3D structure of the trimer and predicted nano-size of PZL318.
Notes: (A) Ion peak in the FT-MS spectrum supporting trimerization of PZL318 (bearing two positive charges; 1,150.98902), of which the inset shows a qCID spectrum and indicates that the monomers and dimers resulted from fragmentation of the trimer under FT-MS conditions. (B) ROESY 2D NMR spectrum: four cross-peaks indicating the intermolecular interactions of PZL318 (labeled with red circles). (C) Three-dimensional structure of the PZL318 trimer, wherein the distances labeled with (1), (2), (3), and (4) represent the approaching manner of three molecules. (D) PZL318 molecules are built and optimized simply in the Visualizer window. “Beads” are constructed from atomistic simulations and placed at the center-of-mass of groups of atoms corresponding to the particular parts of PZL318 molecule. The four moieties are divided into four beads, and two yellow beads represent 3-methoxycarbonyl-4-hydroxyphenyl and L-Trp, two green beads represent β-carboline and L-Lys-OBzl. (E) Thirteen trimers can form a nanoparticle of 3.01 nm in diameter.
Abbreviations: MS, mass spectrometry; FT-MS, Fourier transform–mass spectrometry; qCID, quadrupole collision-induced dissociation; ROESY, rotating-frame Overhauser effect spectroscopy; NMR, nuclear magnetic resonance.
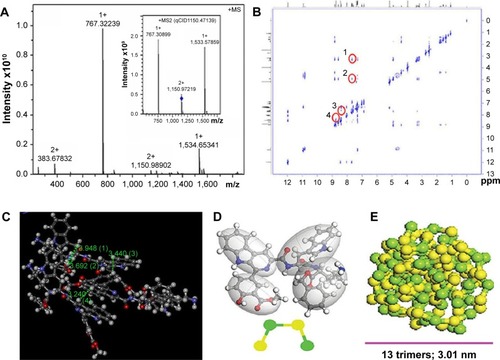
The ROESY 2D NMR spectrum () gives four interesting cross-peaks. Cross-peak 1 reflects the interaction of the 4-H of indole of L-Trp from one molecule with the β-H of L-Trp from another molecule, and cross-peak 2 reflects the interaction of the 4-H of the indole of the L-Trp from one molecule with the α-H of the L-Trp from another molecule, suggesting the distances between the indole of the L-Trp of one molecule and the α-H and β-H of the L-Trp of another molecule are less than 4 Å. Cross-peak 3 reflects the interaction of the 5-H of the β-carboline of one molecule with the 5-H of the 3-methoxycarbonyl-4-hydroxyphenyl of another molecule, and cross-peak 4 reflects the interaction of the 4-H of the β-carboline of one molecule with the 2-H of the 3-methoxycarbonyl-4-hydroxyphenyl of another molecule, suggesting the distances from the 4-H and 5-H of the β-carboline of one molecule to the 2-H and 5-H of the 3-methoxycarbonyl-4-hydroxyphenyl of another molecule are less than 4 Å. Thus, these cross-peaks define the intermolecular actions.
Based on the FT-MS spectrum-defined trimer and ROESY 2D NMR spectrum-defined intermolecular actions, the structure of the trimer is postulated as . Rationally, these intermolecular actions will also force the trimers to form the nanoparticles – ie, the trimer should be the building block of the nanoparticle. To know the trimer number in a nanoparticle, the mesoscale simulation was performed and it was predicted that 13 trimers can form a nanoparticle of 3.01 nm in diameter ().
Characterization of PZL318 nanoparticles
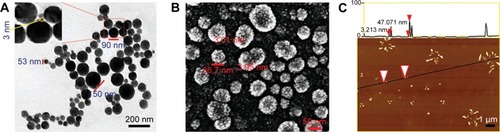
The nanofeature of PZL318 was visualized with TEM, SEM, and AFM images. The TEM image () is characterized by the nanoparticles of 3–150 nm in diameter (90% were <100 nm). The SEM image () is characterized by the nanoparticles of 3.01–36.7 nm in diameter. The AFM image () is characterized by the nanoparticles of ~47 nm in diameter. The TEM, SEM, and AFM images consistently visualize the nanoscale self-assembly and the formation of nanoparticles of PZL318.
Figure 5 TEM, SEM, and AFM images.
Notes: (A) TEM image of PZL318 in ultrapure water (pH 7.0; 10−6 M) and the diameter of the smallest nanoparticle is 3 nm. (B) SEM image of the powders from the aqueous solution of PZL318 (pH 7.0; 10−6 M). (C) These arrowheads were used to note the calculated area of minimum and maximum nano-sizes on the black line. AFM image of PZL318 in rat plasma and the diameter of the nanoparticles is ~47 nm.
Abbreviations: TEM, transmission electron microscopy; SEM, scanning electron microscopy; AFM, atomic force microscopy.
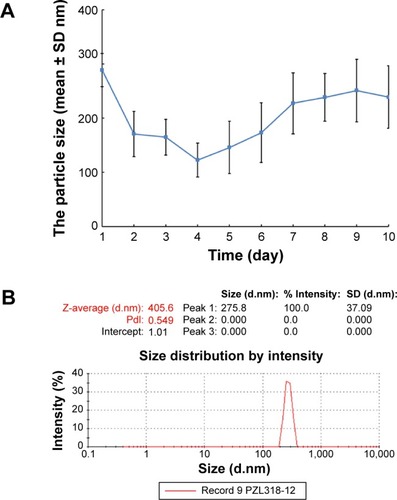
The 10-day sizes and zeta potentials of PZL318 were measured on Malvern’s Zetasizer (Nano-ZS90; Malvern Instruments) with the DTS (Nano) Program. indicates that on the 10th day, the diameter of the nanoparticles of the 10−6 nM solution of PZL318 in ultrapure water is 238.6±57.7 nm. When the 10−6 nM solution of PZL318 in ultrapure water is stored at room temperature for 12 days, the diameter is 275.8 nm and the PDI is 0.549 (). After 10 days of storage at room temperature, the zeta potential of the 10−6 nM solution of PZL318 in ultrapure water is 47.87±12.27 mV (n=3).
Figure 6 The size of PZL318 nanoparticles.
Notes: (A) The diameter change of PZL318 nanoparticles during 10 days (n = 3) (B) The size and PDI of PZL318 nanoparticles on day 12.
Abbreviations: SD, standard deviation; n, number; PDI, polydispersity index.
Selective interaction of PZL318 nanoparticles with cancer cells
With a 282 nm excitation wave, PZL318 can emit blue fluorescence of 418 nm, and this property was used to trace the nanoparticles. In this case, PZL318 nanoparticles on the cell surface were characterized by fluorescence images (). As seen, when the nontumorigenic cells (HaCaT) are treated with PZL318 for 15 minutes, 30 minutes, and 60 minutes, no blue fluorescent nanoparticles adhered to the cell surface. Even when the treatment time is lengthened to 120 minutes and 360 minutes, the blue fluorescence is still very weak. In contrast, the nanoparticles easily adhere to the surface of tumorigenic cells (HeLa). The blue fluorescent nanoparticles steadily increase when the treatment time is lengthened from 15 minutes to 360 minutes.
Figure 7 Fluorescent and confocal images of PZL318.
Notes: (A) Time-dependent adherence of the nanoparticles onto the surface of HeLa cells. (B) Amplified fluorescence images of the nanoparticles on the surface of HeLa cells. (C) The nanoparticles did not adhere to the surface of HaCaT cells. (D) The nanoparticles time-dependently entering into the cytoplasm of HeLa cells. (E) Amplified confocal images of the nanoparticles in the cytoplasm of HeLa cells. (F) The nanoparticles did not enter into the cytoplasm of HaCaT cells.
Abbreviations: min, minutes; DIC, differential interference contrast.
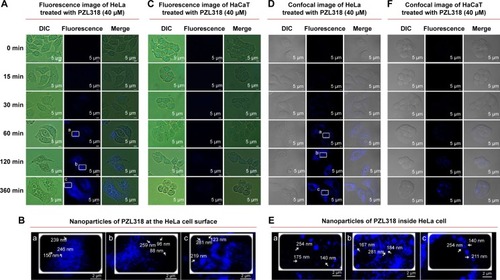
PZL318 nanoparticles entering into the cytoplasm of tumorigenic and nontumorigenic cells were characterized by confocal images (). When HaCaT cells are treated with PZL318 for 15 minutes, 30 minutes, and 60 minutes, no blue fluorescent nanoparticles occurred in the cytoplasm. Even when the treatment time is lengthened to 120 minutes and 360 minutes, the blue fluorescence is still very weak. In contrast, strong blue fluorescence occurs in the cytoplasm of HeLa cells, and the intensity steadily increases when the treatment time is lengthened from 30 minutes to 360 minutes.
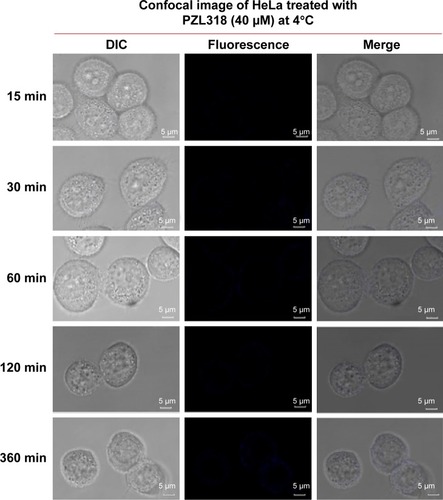
Possible mechanism of HeLa cell uptake of PZL318 nanoparticles
To know whether the endocytosis leads to PZL318 nanoparticles entering into cancer cells, HeLa cells were cultured with 40 μM of PZL318 at 4°C for 15 minutes, 30 minutes, 60 minutes, 120 minutes, and 360 minutes. In contrast to the confocal images of HeLa cells cultured with 40 μM of PZL318 at 37°C (), the confocal images of HeLa cells cultured with 40 μM of PZL318 at 4°C show no blue fluorescence (), suggesting that the endocytosis is the mechanism underlying the PZL318 nanoparticles entering the cancer cells.
Figure 8 Confocal image of PZL318 at 4°C.
Abbreviation: min, minutes.
Either natural or synthetic β-carbolines are of importance due to their anticancer activities and diverse mechanisms. The chemical structures, anticancer properties, specific absorption rate, and mechanisms of action of a series of β-carbolines reported in the last 4 years were excellently reviewed,Citation45 in which UV irradiation identified 1-electron poor phenyl and 3-funan substituted β-carbolines (20 and 21) that were able to effectively cleave pBR322 plasmid DNA. In contrast, PZL318 is 1-electron rich phenyl and 3-peptidyl substituted β-carboline, which enables it to have blue fluorescent emission, self-assemble, target cancer cells, and trace the course of its action on cancer cells.
PZL318 effectively inhibits tumor growth and has no side effects
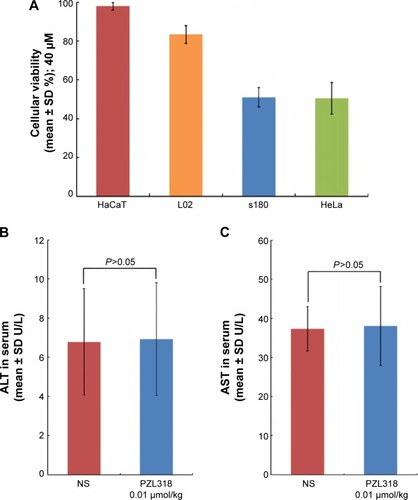
The difference between the interaction of the nanoparticles with tumorigenic cells and nontumorigenic cells influenced the in vitro proliferation of cancer cells. indicates that the cellular viabilities of 40 μM of PZL318-treated S180 cells and HeLa cells are ~50%, while the cellular viabilities of the treated HaCaT and L02 cells are more than 85%; 40 μM of PZL318 killed tumorigenic cells, but it did not interfere with the growth of nontumorigenic cells.
Figure 9 Effects of PZL318 on cell proliferation, mouse AST and mouse ALT.
Notes: (A) Effects of PZL318 on cell proliferation (n=6). (B) ALT in the serum of S180 mice treated with NS and 10 nmol/kg/day of PZL318 for 7 consecutive days (n=5). (C) AST in the serum of S180 mice treated with NS and 10 nmol/kg/day of PZL318 for 7 consecutive days (n=5).
Abbreviations: SD, standard deviation; ALT, alanine transaminase; NS, normal saline; AST, aspartate transaminase; n, number.
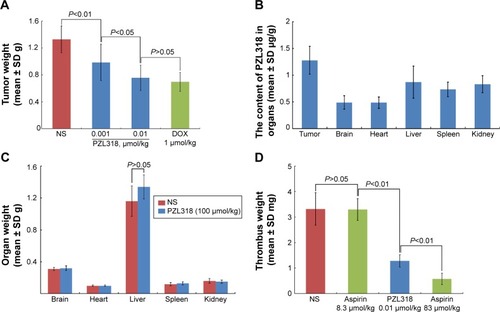
The difference between the interaction of the nanoparticles with tumorigenic cells and nontumorigenic cells led to the slowing of tumor growth in S180 mice and led to no toxic action for healthy mice. indicates that when S180 mice are intraperitoneally injected with 1 nmol/kg/day of PZL318 for 7 consecutive days, the tumor weight is significantly lower than that of NS-treated S180 mice (P<0.01). At a dose of 10 nmol/kg/day, the tumor weight of S180 mice treated with PZL318 equals that of S180 mice treated with 1 μmol/kg/day of doxorubicin (P>0.05), suggesting the effective dose of PZL318 is 100-fold lower than that of doxorubicin. indicates that when healthy mice are intraperitoneally injected with a single dose of NS or 100 μmol/kg of PZL318, no ill effects occur; the average weight of the mouse organs are the same for both groups.
Figure 10 Effects of PZL318 on tumor growth, thrombus formation and organ weight, as well as accumulation of PZL318 in tumor and organs.
Notes: (A) Tumor weight of S180 mice intraperitoneally injected with PZL318 for 7 consecutive days (n=12). (B) Distribution of PZL318 in the organs of S180 mice intraperitoneally injected with 10 nmol/kg/day of PZL318 for 7 consecutive days (note: the concentration of PZL318 in the blood is 0.27±0.07 μg/mL) (n=5). (C) Effect of intraperitoneally injected single NS or 100 μmol/kg of PZL318 on the organ weights of healthy mice (n=12). (D) Effect of intraperitoneal 10 nmol/kg of PZL318 on the thrombus weights of ferric chloride-treated mice (n=12).
Abbreviations: SD, standard deviation; NS, normal saline; n, number.
Distribution of PZL318 in tumor tissue, vital organs, and blood
The distribution of PZL318 in tumor tissue, as well as the brain, heart, liver, spleen, kidney, and blood of the mice receiving in vivo antitumor assay was identified by HPLC analysis. By using the standard curve, the level of PZL318 was calculated and the data are shown in . As seen, the level of PZL318 in the tumor tissue is ~2-fold higher than that in the vital organs.
PZL318 induces no liver injury in vivo
The blood from the mice receiving in vivo antitumor assay was collected to obtain the serum. The alanine transaminase (ALT) and aspartate transaminase (AST) in the serum were measured according to the guidance of the kits, and the data are shown in . As seen, ALT and AST in the serum of the mice treated with NS and 10 nmol/kg/day of PZL318 for 7 consecutive days are the same, suggesting that PZL318 does not induce liver injury in vivo.
PZL318 inhibits ferric chloride to induce thrombus development in mice
The antithrombotic activity of PZL318 was evaluated in a rat model. indicates that 10 nmol/kg of PZL318 effectively inhibits ferric chloride solution, triggering the abdominal aorta of mice to form a thrombus, and the thrombus weight is significantly lower than that of the mice treated with NS or 8.3 μmol/kg of aspirin (P<0.01).
PZL318 downregulating P-selectin and scavenging free radicals
It is well documented that in addition to enhancing the metastasis of carcinomas in vivo, P-selectin can band cancer cells to facilitate tumor growth in vivo,Citation46,Citation47 and cancer patients have a high level of plasma sP-selectin.Citation49 To demonstrate the relationship between P-selectin and anticancer activity, the effect of PZL318 on the P-selectin expression of AA-activated rat platelets was examined. shows that in vitro, 1 μM of PZL318 effectively downregulates AA-activated rat platelets expressing P-selectin.
Figure 11 Activities of PZL318 in depressing P-selectin expression, scavenging free radicals, and inhibiting platelet aggregation.
Notes: (A) PZL318 effectively depresses P-selectin expression at a 1 μM concentration. (B) Unlabeled platelets (background). (C) PE–anti-CD62P-labeled platelets. (D) PE–anti-CD62P-labeled and AA-activated platelets without PZL318. (E) PE–anti-CD62P-labeled and AA-activated platelets with 1 μM of PZL318. (F) SEM image of AA-activated rat platelets with NS. (G) SEM image of AA-activated rat platelets with 1 μM of PZL318. (H) At 1 μM, PZL318 effectively scavenges NO·, O2−, and ·OH radicals. (I) At 500 nM, PZL318 antagonizes ~75% vasorelaxation of the aortic ring in 1 μM of Ach.
Abbreviations: NS, normal saline; FCS-A, FCS-area; NE, noradrenaline; Ach, acetylcholine; PE, phycoerythrin; AA, arachidonic acid; SEM, scanning electron microscopy.
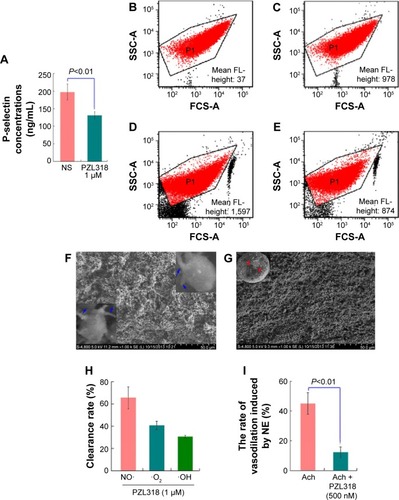
The PZL318 mediated downregulation of P-selectin expression was further evidenced with flow cytometry analysis, as mentioned in the Materials and methods, and the results are shown in . As can be seen, the fluorescence intensities of unlabeled platelets (background), PE–anti-CD62P-labeled platelets (normal reference), PE–anti-CD62P-labeled and AA-activated platelets without PZL318 (positive control), and PE–anti-CD62P-labeled and AA-activated platelets with 1 μM of PZL318 are 37, 978, 1,597, and 874, respectively.
To support the idea that PZL318 downregulates P-selectin expression relates to the interaction of the nanoparticles with the activation platelets; as such, the SEM images of rat platelets activated by AA were recorded. show the SEM images of the platelets treated with NS and 1 μM of PZL318, respectively. As can be seen, there are numerous nanoparticles on the surfaces of the platelets treated with 1 μM of PZL318, of which some are involved in the course of endocytosis, but no similar nanoparticles are found on the surface of NS-treated platelets.
The in vivo upregulation of P-selectin expression was found to be triggered by H2O2,Citation50 and it was enhanced by the production of reactive oxygen species.Citation51 To demonstrate the relationship between P-selectin expression and free radicals, the free radical scavenging capacity of PZL318 was examined. shows that 1 μM of PZL318 effectively scavenges NO·, O2−, and ·OH, and the clearance rate of NO· was over 60%. shows that 500 nM of PZL318 antagonizes ~75% of the vasorelaxation induced by 1 μM of Ach, which mirrors the ability of PZL318 scavenging tissue NO. This finding emphasized that H2O2, reactive oxygen species, and NO· upregulated P-selectin expression; it also implied that scavenging NO· was one of the mechanisms in the downregulation of sP-selectin expression.
Discussion
For a small molecule to reveal self-assembled nanospecies is of interest and importance. Based on the structural analysis of a series of β-carboline-3-carboxilic acid derivatives, a small molecule PZL318 was discovered as an antitumor and antithrombotic agent. TEM, SEM, and AFM images provide evidence that PZL318 forms nanoparticles with diameters <100 nm that favors delivery in blood circulation. At room temperature, the 10-day store does not change the size of the nanoparticles, which favors the application. FT-MS and qCID spectra demonstrate that in water, the structural unit of PZL318 is the trimer. The ROESY 2D NMR spectrum explores that the trimer of PZL318 takes a flyer-like conformation. Rationally, in water, the trimers assemble and form the nanoparticles.
In antitumor drug design, nanotechnology is widely used to improve targeting, enhance efficacy, and trace the action course. Surprising, at the 418 nm wavelength, PZL318 formed nanoparticles that emit blue fluorescence. Fluorescent and confocal images trace that within 6 hours, the nanoparticles time-dependently adhere onto the surfaces and then enter into the tumorigenic cells, but not nontumorigenic cells, suggesting that the nanoparticles are a cancer cell target. This not only leads to the effective dose of PZL318 to be 100-fold lower than that of doxorubicin, but it also leads to the high distribution of PZL318 in tumor tissue, but not in vital organs and blood; therefore, S180 mice treated with PZL318 and NS have the same ALT and AST viabilities, and the healthy mice receiving 100 μmol/kg of PZL318 and NS have an equal organ weight as well. The fact that the nanoparticles effectively enter into the cancer cells is consistent with the idea that PZL318 can intercalate into CT DNA.
As depicted by the SEM images, the nanoparticles adhere onto the surfaces of AA-activated rat platelets and promote endocytosis. This should be responsible for PZL318 down-regulating P-selectin expression, inhibiting platelet aggregation, and offering high antithrombotic activity. Besides, PZL318 effectively scavenges the free radicals NO, ·O2, and OH; thus, PZL318 blocks the function of the free radicals in triggering and enhancing P-selectin expression. This should be responsible for PZL318 inhibiting thrombosis and slowing tumor growth. Thrombosis is a vital complication of cancer patients; validated antithrombotic action can help PZL318 provide cancer patients with good outcomes.
Conclusion
PZL318, a typical small molecule, uses its trimers to form the nanoparticles capable of emitting blue fluorescence; it also traces them, targets cancer cells and AA-activated platelets, and explores their course as the nanoparticles adhere to and enter into the cancer cells and platelets. In this way, the nanoparticles effectively scavenge the free radicals, significantly downregulate the expression of P-selectin, selectively accumulate in tumor tissue, seriously injure tumor tissue without impairing vital organs and blood, and essentially kill the tumor and prevent the patients from thrombotic complications. PZL318 provides a probing strategy for small molecules to form nanoparticles, to target cancer cells and activated platelets, and to practice fluorescent trace.
Acknowledgments
The authors thank the financial supports of the Beijing Municipal Science and Technology Commission (Z141100002114049), TJSHG (201310025008), the Project of Construction of Innovative Teams and Teacher Career Development for Universities and Colleges Under Beijing Municipality, the NSFC (81172930, 81273379, 81270046, 81373265, and 81373264), the Beijing Natural Science Foundation (7132032), and the Beijing NOVA Program (XX2013039).
Disclosure
The authors report no conflicts of interest in this work.
References
- StebbingJJonesABarrett-LeePCardiotoxicity and anthracyclinesBreast Cancer Res Treat2008107345145318167621
- OctaviaYTocchettiCGGabrielsonKLJanssensSCrijnsHJMoensALDoxorubicin-induced cardiomyopathy: from molecular mechanisms to therapeutic strategiesJ Mol Cell Cardiol20125261213122522465037
- TacarOSriamornsakPDassCRDoxorubicin: an update on anticancer molecular action, toxicity and novel drug delivery systemsJ Pharm Pharmacol201365215717023278683
- ParkHTsutsumiHMiharaHCell-selective intracellular drug delivery using doxorubicin and α-helical peptides conjugated to gold nanoparticlesBiomaterials201435103480348724439396
- El-SheikhAAMorsyMAMahmoudMMRifaaiRAProtective mechanisms of coenzyme-Q10 may involve up-regulation of testicular P-glycoprotein in doxorubicin-induced toxicityEnviron Toxicol Pharmacol201437277278124632013
- CaoSDurraniFATóthKRustumYMSe-methylselenocysteine offers selective protection against toxicity and potentiates the antitumour activity of anticancer drugs in preclinical animal modelsBr J Cancer201411071733174324619073
- TortorellaSKaragiannisTCTransferrin receptor-mediated endocytosis: a useful target for cancer therapyJ Membr Biol2014247429130724573305
- JiménezJRiverón-NegreteLAbdullaevFEspinosa-AguirreJRodríguez-ArnaizRCytotoxicity of the beta-carboline alkaloids harmine and harmaline in human cell assays in vitroExp Toxicol Pathol2008604–538138918430551
- TuLCChenCSHsiaoICThe beta-carboline analog Mana-Hox causes mitotic aberration by interacting with DNAChem Biol200512121317132416356849
- LaronzeMBoisbrunMLéonceSSynthesis and anticancer activity of new pyrrolocarbazoles and pyrrolo-beta-carbolinesBioorg Med Chem20051362263228315830466
- BeauchardAJaunetAMurilloLSynthesis and antitumoral activity of novel thiazolobenzotriazole, thiazoloindolo[3,2-c]quinoline and quinolinoquinoline derivativesEur J Med Chem200944103858386519427714
- NapperADHixonJMcDonaghTDiscovery of indoles as potent and selective inhibitors of the deacetylase SIRT1J Med Chem200548258045805416335928
- BoeiraJMVianaAFPicadaJNHenriquesJAGenotoxic and recombinogenic activities of the two beta-carboline alkaloids harman and harmine in Saccharomyces cerevisiaeMutat Res20025001–2394811890933
- MansoorTARamalhoRMMulhovoSRodriguesCMFerreiraMJInduction of apoptosis in HuH-7 cancer cells by monoterpene and beta-carboline indole alkaloids isolated from the leaves of Tabernaemontana elegansBioorg Med Chem Lett200919154255425819525111
- BehforouzMCaiWMohammadiFSynthesis and evaluation of antitumor activity of novel N-acyllavendamycin analogues and quinoline-5,8-dionesBioorg Med Chem200715149551017035024
- TakikawaOClinical aspects of indoleamine 2,3-dioxygenase (IDO)-initiated tryptophan metabolism: IDO is a target of drug discovery for various diseasesInt Congr Ser20071304290297
- PouilhèsAKouklovskyCLangloisYSynthesis and biological evaluation of bengacarboline derivativesBioorg Med Chem Lett20081831212121618083028
- DeveauAMLabroliMADieckhausCMBarthenMTSmithKSMacdonaldTLThe synthesis of amino-acid functionalized beta-carbolines as topoisomerase II inhibitorsBioorg Med Chem Lett200111101251125511392530
- ArzelERoccaPGrellierPNew synthesis of benzo-delta-carbolines, cryptolepines, and their salts: in vitro cytotoxic, antiplasmodial, and antitrypanosomal activities of delta-carbolines, benzo-delta-carbolines, and cryptolepinesJ Med Chem200144694996011300877
- LiuJJiangXZhaoMA class of 3S-2-aminoacyltetrahydro-beta-carboline-3-carboxylic acids: their facile synthesis, inhibition for platelet activation, and high in vivo anti-thrombotic potencyJ Med Chem20105383106311620329729
- YaoKZhaoMZhangXA class of oral N-[(1S,3S)-1-methyl-1,2,3,4-tetrahydro-β-carboline-3-carbonyl]- N’-(amino-acid-acyl) hydrazine: discovery, synthesis, in vitro anti-platelet aggregation/in vivo anti-thrombotic evaluation and 3D QSAR analysisEur J Med Chem20114683237324921571404
- JiaoWHGaoHLiCYQuassidines A-D, bis-beta-carboline alkaloids from the stems of Picrasma quassioidesJ Nat Prod201073216717120095629
- CoussensLMWerbZInflammation and cancerNature2002420691786086712490959
- GrivennikovSIGretenFRKarinMImmunity, inflammation, and cancerCell2010140688389920303878
- KanzRVukovichTVormittagRThrombosis risk and survival in cancer patients with elevated C-reactive proteinJ Thromb Haemost201191576320874781
- SallahSWanJYNguyenNPVenous thrombosis in patients with solid tumors: determination of frequency and characteristicsThromb Haemost200287457557912008937
- WuJZhaoMQianKLeeKHMorris-NatschkeSPengSNovel N-(3-carboxyl-9-benzyl-beta-carboline-1-yl)ethylamino acids: synthesis, anti-tumor evaluation, intercalating determination, 3D QSAR analysis and docking investigationEur J Med Chem200944104153416119535177
- MitchellMJChenCSPonmudiVHughesADKingMRE-selectin liposomal and nanotube-targeted delivery of doxorubicin to circulating tumor cellsJ Control Release2012160360961722421423
- MitchellMJCastellanosCAKingMRNanostructured surfaces to target and kill circulating tumor cells while repelling leukocytesJ Nanomater20122012pii: 831263
- MitchellMJWayneERanaKSchafferCBKingMRTRAIL-coated leukocytes that kill cancer cells in the circulationProc Natl Acad Sci U S A2014111393093524395803
- MirMTahirbegiIBValle-DelgadoJJFernàndez-BusquetsXSamitierJIn vitro study of magnetite-amyloid β complex formationNanomedicine20128697498022115601
- MishraBPatelBBTiwariSColloidal nanocarriers: a review on formulation technology, types and applications toward targeted drug deliveryNanomedicine20106192419447208
- KhadkaDBHaynieDTProtein- and peptide-based electrospun nanofibers in medical biomaterialsNanomedicine2012881242126222406190
- RangnekarAZhangAMLiSSIncreased anticoagulant activity of thrombin-binding DNA aptamers by nanoscale organization on DNA nanostructuresNanomedicine20128567368121889476
- KawasakiESPlayerANanotechnology, nanomedicine, and the development of new, effective therapies for cancerNanomedicine20051210110917292064
- SundaramPWowerJByrneMEA nanoscale drug delivery carrier using nucleic acid aptamers for extended release of therapeuticNanomedicine2012871143115122321384
- LiLCuiGZhaoMAssembly of beta-cyclodextrin with 3S-tetrahydro-beta-carboline-3-carboxylic acid and self-assembly of 6-(3′S- carboline-3′-carboxylaminoethylamino)-6-deoxy-beta-cyclodextrin: approaches to enhance anti-oxidation stability and anti-thrombotic potencyJ Phys Chem B200811238121391214718754637
- RenXCuiGZhaoMWangCPengSCoordination of thrombolytic Pro-Ala-Lys peptides with Cu (II): leading to nanoscale self-assembly, increase of thrombolytic activity and additional vasodilationJ Phys Chem B2008112278174818018547100
- AbeleinALangLLendelCGräslundADanielssonJTransient small molecule interactions kinetically modulate amyloid β peptide self-assemblyFEBS Lett2012586223991399523058290
- SoodAAbidMHailemichaelSFosterMTörökBTörökMEffect of chirality of small molecule organofluorine inhibitors of amyloid self-assembly on inhibitor potencyBioorg Med Chem Lett200919246931693419880318
- KühnleASelf-assembly of organic molecules at metal surfacesCurr Opin Colloid Interface Sci2009142157168
- MatsonJBZhaRHStuppSIPeptide self-assembly for crafting functional biological materialsCurr Opin Solid State Mater Sci201115622523522125413
- WangYWuJKangGNovel nanomaterials, RGD-tetrapeptide-modified 17β-amino-11α-hydroxyandrost-1,4-diene-3-one: synthesis, self-assembly based nano-images and in vivo anti-osteoporosis evaluationJ Mater Chem2012221146524659
- JinSWangYZhuHNanosized aspirin-Arg-Gly-Asp-Val: delivery of aspirin to thrombus by the target carrier Arg-Gly-Asp-Val tetrapeptideACS Nano2013797664767323931063
- ZhangMSunDRecent advances of natural and synthetic β-carbolines as anticancer agentsAnticancer Agents Med Chem201515553754725430895
- WangWFangCWangXModifying mesoporous silica nanoparticles to avoid the metabolic deactivation of 6-mercaptopurine and methotrexate in combinatorial chemotherapyNanoscale20135146249625323680872
- ZhuHWangYWangYFolded conformation, cyclic pentamer, nano-structure and PAD4 binding mode of YW3-56J Phys Chem C Nanomater Interfaces201311719100701007823795230
- HuangGZhouZSrinivasanRAffinity manipulation of surface-conjugated RGD peptide to modulate binding of liposomes to activated plateletsBiomaterials200829111676168518192005
- Dymicka-PiekarskaVKemonaHDoes colorectal cancer clinical advancement affect adhesion molecules (sP-selectin, sE-selectin and ICAM-1) concentration?Thromb Res20091241808319136145
- FolchESalasAPratsNH(2)O(2) and PARS mediate lung P-selectin upregulation in acute pancreatitisFree Radic Biol Med20002881286129410889459
- SkoglundCWetteröJBengtssonTC1q regulates collagen-dependent production of reactive oxygen species, aggregation and levels of soluble P-selectin in whole bloodImmunol Lett20121421–2283322142906