
Abstract
Background
Graphene and graphene-based nanocomposites are used in various research areas including sensing, energy storage, and catalysis. The mechanical, thermal, electrical, and biological properties render graphene-based nanocomposites of metallic nanoparticles useful for several biomedical applications. Epithelial ovarian carcinoma is the fifth most deadly cancer in women; most tumors initially respond to chemotherapy, but eventually acquire chemoresistance. Consequently, the development of novel molecules for cancer therapy is essential. This study was designed to develop a simple, non-toxic, environmentally friendly method for the synthesis of reduced graphene oxide–silver (rGO–Ag) nanoparticle nanocomposites using Tilia amurensis plant extracts as reducing and stabilizing agents. The anticancer properties of rGO–Ag were evaluated in ovarian cancer cells.
Methods
The synthesized rGO–Ag nanocomposite was characterized using various analytical techniques. The anticancer properties of the rGO–Ag nanocomposite were evaluated using a series of assays such as cell viability, lactate dehydrogenase leakage, reactive oxygen species generation, cellular levels of malonaldehyde and glutathione, caspase-3 activity, and DNA fragmentation in ovarian cancer cells (A2780).
Results
AgNPs with an average size of 20 nm were uniformly dispersed on graphene sheets. The data obtained from the biochemical assays indicate that the rGO–Ag nanocomposite significantly inhibited cell viability in A2780 ovarian cancer cells and increased lactate dehydrogenase leakage, reactive oxygen species generation, caspase-3 activity, and DNA fragmentation compared with other tested nanomaterials such as graphene oxide, rGO, and AgNPs.
Conclusion
T. amurensis plant extract-mediated rGO–Ag nanocomposites could facilitate the large-scale production of graphene-based nanocomposites; rGO–Ag showed a significant inhibiting effect on cell viability compared to graphene oxide, rGO, and silver nanoparticles. The nanocomposites could be effective non-toxic therapeutic agents for the treatment of both cancer and cancer stem cells.
Introduction
Graphene is a single, tightly packed monolayer of carbon atoms arranged in a two-dimensional honeycomb network of spCitation2 hybridized carbon atoms.Citation1 Graphene has recently attracted considerable attention in scientific and industrial research areas due to it’s excellent properties, such as high electron mobility, excellent mechanical stiffness, extraordinary electronic transport, and high electrical conductivity.Citation2–Citation4 The graphene material is used in nanoelectronics,Citation5 nanocomposites,Citation6 and energy-storage devices.Citation7,Citation8 Further, graphene has recently been researched in biological applications; in addition to the physical and chemical properties already mentioned, the nanomaterial has excellent biological properties such as antibacterial,Citation9–Citation11 biosensing,Citation12 cellular imaging, and drug delivery capabilities,Citation13 as well as displaying anticancer activity.Citation14–Citation17
A limited number of studies have reported the anticancer activity of graphene or graphene oxide (GO). The anticancer behavior of a novel GO–hypocrellin A hybrid was superior to that of free hypocrellin A in aqueous solution.Citation18 A GO-TiO2 hybrid caused significant elevation in caspase-3 activity inducing apoptotic death; the hybrid showed excellent photodynamic anticancer activity without dark cytotoxicity.Citation19,Citation20 Hu et alCitation19 and Wang et alCitation20 demonstrated the dual functionality of graphene quantum dots as targeted anticancer drug carriers and DNA cleavage activity enhancers, which could be useful in cancer therapy. Transferrin-conjugated polyethylene glycolated GO was demonstrated as an efficient nanovector for the targeted delivery of anticancer drugs to brain tumors both in in vitro and in vivo conditions.Citation21,Citation22 Cheng et al showed a novel pH-sensitive nanostructured antitumor drug from a GO-CONH-Schiff base compound in which chitosan-xanthone Schiff base and GO acted as the tumor inhibitor and drug delivery carrier, respectively.Citation21
GO is used as a precursor for reduced GO (rGO) as it is strongly hydrophilic and generates stable and homogeneous colloidal suspensions of negatively charged GO sheets in aqueous and polar organic solvents.Citation5 The subsequent deoxy-genation of GO is necessary by chemically reducing oxygen-containing groups. Maintaining the individual separation of the graphene sheets is the most important and challenging part of the rGO production process.Citation23 GO reduction by chemical methods results in the formation of limited solubility or even irreversible agglomerates of rGO during preparation in water and most organic solvents (unless capping reagents are used) because of the strong π–π stacking tendency between rGO sheets.Citation24–Citation26 Agglomeration of rGO can be limited by attaching other molecules or polymers to the sheets. The most commonly used chemical reducing agents are hydrous hydrazine,Citation27 hydrazine monohydrate, sodium borohydride, and hydrogen sulfide, which are highly toxic to living organisms and the environment.Citation14,Citation28 Several laboratories have developed biological reducing and stabilizing agents, such as ascorbic acid,Citation29 amino acids,Citation30 melatonin,Citation31 glucose,Citation14 humanin,Citation32 microorganisms,Citation33–Citation35 and plant extracts.Citation16
Ag nanoparticles (AgNPs) exhibit very small sizes and large surfaces compared to the bulk metal. For several decades, AgNPs have been of considerable interest in several areas of research, including optics, electronics, magnetics, mechanics, catalysis, energy science, nanobiotechnology, and nanomedicine – particularly as antimicrobial agents for diagnostic purposes.Citation36 AgNPs also have potential applications in surface enhanced Raman scattering,Citation37 catalysis,Citation38 nanoscale electronics,Citation39 and imaging.Citation40 Several studies have reported the use of AgNPs as anticancerCitation41 and antiangiogenic agents in retinal endothelial cells. AgNPs showed significant toxicity in various human cell lines such as human lung fibroblast cells (IMR-90) and human glioblastoma cells (U251),Citation42 endothelial cells,Citation43 and MDA-MB-231 human breast cancer cells.Citation44 However, Ag and graphene as individual agents both show weaker biological activity than graphene–silver nanocomposites. Yu et alCitation45 showed the enhanced antibacterial activity of AgNPs/halloysite nanotubes/graphene nanocomposites against Escherichia coli and Staphylococcus aureus. Several previous studies reported the toxicity of GO and graphene-related materials in human cells, including neural pheochromocytoma-derived PC12,Citation46 human lung epithelial cells or fibroblasts,Citation47 A549 cells,Citation48 MCF-7 cells,Citation17 and MDA-MB-231 human breast cancer cells.Citation16 No study has yet detailed the use of graphene–AgNP nanocomposites in ovarian cancer cells.
The synthesis of graphene composites with various metal NPs has recently generated extensive interest for the novel optical, electronic, mechanical, and catalytic properties of the composites.Citation8,Citation49–Citation51 AgNP-decorated graphene is most promising for optoelectronics,Citation51 catalysis,Citation52 and electrochemistryCitation53 applications; it also shows enhanced antibacterial activity.Citation45,Citation54,Citation55 Therefore, the fabrication of graphene–Ag nanocomposites is of great interest. Until now, most studies focused on the synthesis of AgNPs–graphene composites used hazardous reducing agents such as sodium borohydride, formaldehyde, and hydrazine. These synthesis processes involve multiple steps and complex operations.Citation8,Citation54,Citation56,Citation57 The use of surfactants as stabilizing agent molecules, which are strongly absorbed on the surface of the metal NPs, decreases the performance of the metal nanoparticle–rGO composite.Citation58 Efforts have focused on the synthesis of metal nanoparticle–rGO composites by physical and chemical methods. Few studies have exploited green synthesis methods to produce AgNP–rGO films.Citation59
No data exist concerning the biological activity of rGO–Ag nanocomposites in human cancer cells and cancer stem cells (CSCs), particularly in human ovarian cancer cells. It is clinically necessary to identify possible new therapeutic molecules that may significantly enhance cancer cell apoptosis. These aspects of nanomedicine remain subjects of particular interest.
Ovarian cancer accounts for approximately 3% of cancers among women; it primarily develops in women over the age of 50. Most ovarian cancer cells are initially chemosensitive, as evidenced by high initial chemotherapy response rates; however, high recurrence rates suggest the development of chemoresistance. To address the anticancer activity of rGO–Ag nanocomposites, the well-characterized human ovarian cancer cell line A2780 served as a biological model in the in vitro experiments presented here. The A2780 cell lines are poorly differentiated, highly tumorigenic, and heterogeneous with certain phenotypic subsets attributable to CSC-like properties.Citation60–Citation62
Considering the current state of nanomedical research, we chose the following objectives. The first goal of this study aimed to develop a simple, non-toxic, cost-effective, quick, and environmentally friendly synthesis approach for rGO–Ag nanocomposites using Tilia amurensis plant extracts (TAPE). The second objective was to determine the efficacy of the rGO–Ag nanocomposite in the ovarian cancer cell line A2780 using an in vitro model system.
Materials and methods
Penicillin–streptomycin solution, trypsin–EDTA solution, Dulbecco’s Modified Eagle’s Medium (DMEM), Roswell Park Memorial Institute (RPMI) 1640 medium, and 1% antibiotic–antimycotic solution were obtained from Thermo Fisher Scientific (Waltham, MA, USA). Polyethylene, AgNO3, fetal bovine serum, and the in vitro toxicology assay kit were purchased from Sigma-Aldrich Co. (St Louis, MO, USA). Graphite (Gt) powder, NaOH, KMnO4, NaNO3, anhydrous ethanol, 98% H2SO4, 36% HCl, 30% H2O2 aqueous solution, and all other chemicals were purchased from Sigma-Aldrich Co., unless otherwise stated.
Synthesis of AgNPs
The synthesis of AgNPs was conducted according to the method described previously.Citation63 T. amurensis leaves were collected at the Konkuk University campus in Seoul, Republic of Korea, and stored at 4°C until needed. Twenty grams of T. amurensis leaves were washed thoroughly with double-distilled water, and then sliced into fine pieces, approximately 1–5 cm, using a sharp stainless steel knife. The finely cut T. amurensis leaves were suspended in 100 mL sterile distilled water and boiled for 5 minutes. The resulting mixture was filtered through a Whatman number 1 filter paper. The filtered extract was used for the synthesis of AgNPs by adding 10 mL to 100 mL 5 mM aqueous AgNO3; the mixture was incubated for 6 hours at 60°C at pH 8.0. The bio-reduction of the silver ions was monitored spectrophotometrically at 420 nm. Further characterizations of the synthesized AgNPs were performed as described previously.Citation64
Synthesis of GO
GO was synthesized as described previouslyCitation10,Citation65,Citation66 with suitable modifications. In a typical synthesis process, 2 g natural Gt powder was added to 350 mL H2SO4 at 0°C; 8 g KMnO4 and 1 g NaNO3 were added gradually while stirring. The mixture was transferred to a 40°C water bath and stirred for 60 minutes. Deionized water (250 mL) was slowly added and the temperature was increased to 98°C. The mixture was maintained at 98°C for 30 minutes; the reaction was terminated by the addition of 500 mL deionized water and 40 mL 30% H2O2 solution. The color of the mixture changed to brilliant yellow, indicating the oxidation of pristine Gt to Gt oxide. The mixture was filtered and washed with diluted HCl to remove metal ions. The product was washed repeatedly with distilled water until a pH of 7.0 was achieved; the synthesized Gt oxide was further sonicated for 15 minutes.
Reduction of GO by TAPE
The reduction of GO was accomplished as described earlier.Citation16 Briefly, rGO was obtained from the reaction of TAPE with GO. In a typical reduction experiment, 10 mL TAPE was added to 90 mL 1.0 mg/mL aqueous GO; the mixture was sealed tightly in a glass bottle and stirred at 30°C for 12 hours. Subsequently, by using a magneto-stirrer heater, the rGO suspension was stirred at 400 rpm at a temperature of 30°C for 30 minutes. A homogeneous TAPE–rGO suspension was obtained without aggregation. The obtained material was washed with distilled water several times to remove the excess TAPE residue and re-dispersed in water by sonication. The suspension was centrifuged at 5,000 rpm for 30 minutes; the final product was collected by vacuum filtration and vacuum-dried.
Synthesis of rGO–Ag nanocomposite
Synthesized rGO–Ag nanocomposites were prepared using TAPE. An aqueous solution of 100 mg GO and 5 mM of AgNO3 was used as precursors for the rGO–Ag nanocomposites. Initially, 100 mg GO was dispersed in 60 mL water by 60 minutes sonication. The reaction mixture was prepared in a 250 mL round bottom flask by dissolving 5 mM AgNO3 in 30 mL water. To this solution, 60 mL GO dispersion and 10 mL of aqueous TAPE were added and the mixture was stirred at 90°C for 12 hours. After 12 hours, the reaction was stopped and the resultant mixture was washed three times with water using centrifugation. The product was obtained as a black powder and used for further experiments.
Characterization of rGO and rGO–Ag nanocomposite
GO, rGO, and the rGO–Ag nanocomposite were characterized according to the methods described previously.Citation16,Citation67 Ultraviolet-visible (UV-Vis) spectra of GO, rGO, and rGO–Ag were recorded using an OPTIZEN POP spectrophotometer (Mecasys Co., Seoul, Republic of Korea). X-ray diffraction (XRD) analyses were performed in a Bruker D8 DISCOVER X-ray diffractometer (Bruker AXS GmBH, Karlsruhe, Germany). The X-ray source was 3 kW with a Cu target; high-resolution XRD patterns were measured using a scintillation counter (λ=1.5406 Å). The XRD was run at 40 kV and 40 mA, and samples were recorded at 2θ values between 10° and 80°. The dried powders of GO, rGO, and rGO–Ag nanocomposite were diluted with KBr to perform Fourier transform infrared (FTIR) spectroscopy (PerkinElmer Inc., Waltham, MA, USA) and spectrum GX spectrometry within a range of 500–4,000 cm−1. A JSM-6700F semi-in-lens field emission scanning electron microscope (SEM) (JEOL, Tokyo, Japan) was used to acquire SEM images. The solid samples were transferred to a carbon tape held in an SEM sample holder, and the analyses were performed at an average working distance of 6 mm. Transmission electron microscopy (TEM; Hitachi H-7500, Hitachi Ltd., Tokyo, Japan) was used to determine the size and morphology of the dispersed AgNPs. Raman spectra of GO, rGO, and rGO–Ag were measured using a WITEC Alpha300 laser with a wavelength of 532 nm. The calibration was initially performed using an internal Si reference at 500 cm−1, yielding a peak position resolution of less than 1 cm−1. The spectra were measured from 500 to 4,500 cm−1. All samples were deposited on glass slides in powdered form without a solvent.
Cell culture and exposure of ovarian cancer cells A2780 to rGO–Ag nanocomposite
Human ovarian cancer cells A2780 were cultured in DMEM supplemented with 10% fetal bovine serum, 2 mM glutamine, and 100 U/mL penicillin–streptomycin in a humidified 5% CO2 incubator at 37°C. At approximately 75% confluence, the cells were harvested using 0.25% trypsin and subcultured in 75 cm2 flasks, six-well plates, or 96-well plates, depending on the intended use. The cells were allowed to attach to the substratum for 24 hours prior to treatment. The medium was replaced three times per week, and the cells were passaged at subconfluency. The cells were prepared in 100 μL aliquots at a density of 1×10⁵ mL−1 and plated in 96-well plates. After the cells were cultured for 24 hours, the medium was replaced with a medium containing GO (0–100 μg/mL), rGO (0–50 μg/mL), rGO–Ag (0–25 μg/mL), or AgNPs (0–50 μg/mL). After incubation for an additional 24 hours, the cells were analyzed for viability. The cells that were not exposed to GO, rGO, rGO–Ag, or AgNPs served as controls.
Cell viability assay
The WST-8 assay was performed as described previously.Citation16,Citation44 Typically, 1×10⁴ cells were seeded in a 96-well plate and cultured in DMEM supplemented with 10% fetal bovine serum at 37°C under 5% CO2. After 24 hours, the cells were washed twice with 100 μL of serum-free DMEM and incubated with 100 μL of different concentrations of GO, rGO, rGO–Ag, or AgNPs, as described above. After 24 hours of exposure, the cells were washed twice with serum-free DMEM, and 15 μL of WST-8 solution was added to each well containing 100 μL of serum-free DMEM. After 1 hour of incubation at 37°C under 5% CO2, 80 μL of the mixture was transferred to another 96-well plate. The absorbance of the mixture solutions was measured at 450 nm using a microplate reader. Cell-free control experiments were performed to determine the reactivity of the GO, rGO, rGO–Ag, and AgNPs with the WST-8 reagents. Typically, 100 μL of GO, rGO, rGO–Ag, or AgNP suspensions with different concentrations was added to a 96-well plate and 10 μL of WST-8 reagent solution was added to each well; the mixture was incubated at 37°C under 5% CO2 for 1 hour. After incubation, the GO, rGO, rGO–Ag, or AgNPs were centrifuged, and 100 μL of the supernatant was transferred to another 96-well plate. The optical density was measured at 450 nm.
Cell morphology
Ovarian cancer cells were plated in six-well plates (1×10⁴ cells per well) and incubated with the respective inhibitory concentration (IC)50 concentrations of GO, rGO, rGO–Ag, or AgNPs for 24 hours. Cells cultured in a medium without the addition of GO, rGO, rGO–Ag, or AgNPs were used as the control. Cell morphology was analyzed using an optical OLYMPUS IX71 microscope (Olympus Corporation, Tokyo, Japan) at 24 hours post-treatment using the appropriate filter sets.
Membrane integrity
The cell membrane integrity of the human ovarian cancer cells was evaluated by determining the activity of lactate dehydrogenase (LDH) leaking out of the cells according to the manufacturer’s instructions (in vitro toxicology assay kit, TOX7; Sigma-Aldrich Co.) and also as described previously.Citation16,Citation44 Briefly, the cells were exposed to the respective IC50 concentrations of GO, rGO, rGO–Ag, or AgNPs for 24 hours, and then 100 μL per well of each cell-free supernatant was transferred in triplicate into the wells of a 96-well plate; subsequently, 100 μL of the LDH assay reaction mixture was added to each well. After 3 hours of incubation under standard conditions, the optical density of the color generated was determined at a wavelength of 490 nm using a microplate reader.
Determination of ROS
Reactive oxygen species (ROS) was estimated according to a method described previously.Citation16,Citation44 Intracellular ROS was measured based on the intracellular peroxide-dependent oxidation of 2′,7′-dichlorodihydrofluorescein diacetate (DCFH-DA, Molecular Probes, Thermo Fisher Scientific, Waltham, MA, USA) to form the fluorescent compound 2′,7′-dichlorofluorescein, as previously described. The cells were seeded onto 24-well plates at a density of 5×10⁴ cells per well and cultured for 24 hours. After washing twice with phosphate-buffered saline (PBS), fresh media containing respective IC50 concentrations of GO, rGO, rGO–Ag, or AgNPs were added and incubated for 24 hours. The cells were then supplemented with 20 μM DCFH-DA, and the incubation continued for 30 minutes at 37°C. The cells were rinsed with PBS, 2 mL of PBS was added to each well, and the fluorescence intensity was determined using a spectrofluorometer (Gemini EM) with excitation at 485 nm and emission at 530 nm.
Determination of MDA
Malonaldehyde (MDA) was measured according to the method described earlierCitation68 with slight modifications. The A2780 cells were seeded into six-well microplates at 2.0×10⁶ cells per well. The cells were treated with the respective IC50 concentrations of GO, rGO, rGO–Ag, or AgNPs for 24 hours. After incubation, the cells were harvested and washed twice with an ice-cold PBS solution. The cells were collected and disrupted by ultrasonication for 5 minutes on ice. The cell extract (100 μL) was used to detect MDA according to the procedure recommended by the manufacturer of the MDA assay kit (Sigma, St Louis, USA). The concentration of MDA was measured on a microplate reader at a wavelength of 530 nm. The protein concentration was determined using the Bio-Rad protein assay kit (Bio-Rad Laboratories Inc., Hercules, CA, USA).
Determination of GSH
The cellular extract was prepared similar to that used to measure MDA. The concentration of glutathione (GSH) was expressed as nmol per milligram of protein. The cell suspension (100 μL) was mixed with 100 μL of precipitant and centrifuged at 5,000 rpm for 10 minutes. After centrifugation, 100 μL supernatant was used for the GSH assay, performed according to the manufacturer’s protocol. The reaction was monitored at 405 nm in a microplate reader. The protein concentration was determined using the Bio-Rad protein assay kit (Bio-Rad Laboratories Inc.).
Measurement of caspase-3 activity
The measurement of caspase-3 was performed according to the method described earlier.Citation45 The cells were treated with the respective IC50 concentrations of GO, rGO, rGO–Ag, and AgNPs or caspase-3 inhibitor for 24 hours. The activity of caspase-3 was measured in the cancer cells using a kit from Sigma-Aldrich Co., according to the manufacturer’s instructions. The cells were washed with ice-cold PBS and lysed with 100 μL of lysis buffer (50 mM Tris-HCl, pH 7.5; 150 mM NaCl; 1 mM ethylene glycol tetraacetic acid; 1 mM NaF; 1% Nonidet P-40; 1 mM phenylmethylsulfonyl fluoride protease inhibitor cocktail) for 30 minutes at 4°C. The protein extracts were collected after centrifugation at 10,000 rpm for 10 minutes. The protein concentration was determined using the Bio-Rad protein assay kit (Bio-Rad Laboratories Inc.). Equal amounts (50 μg) of protein extracts were mixed with the assay buffer (20 mM HEPES, pH 7.4; 100 mM NaCl; 0.1% CHAPS; 10 mM DTT; 1 mM EDTA; 10% sucrose), added to 96-well microtiter plates, and incubated with the caspase-3 substrate (acetyl-Asp-Glu-Val-Asp p-nitroanilide, Ac-DEVD-pNA) and caspase-3 inhibitor (Ac-DEVD-CHO) for 1 hour before the absorbance at 405 nm was read. The calorimetric assay was based on the hydrolysis of the caspase-3 substrate by caspase-3 resulting in the release of the p-nitroaniline (pNA) moiety. The concentration of pNA released from the substrate was calculated from the absorbance values at 405 nm. The assay was done with non-induced cells and also in the presence of the caspase-3 inhibitor (Ac-DEVD-CHO) for a comparative analysis.
TUNEL assay
Apoptosis induced by GO, rGO, rGO–Ag, and AgNPs was determined using the TUNEL assay. Apoptotic cells were determined using a DNA Fragmentation Imaging Kit (Hoffman-La Roche Ltd., Basel, Switzerland) following the manufacturer’s instruction. Briefly, 1.5×10⁶ A2780 cells per well were cultured in six-well plates to study the apoptosis in adherent cells. Cells were treated with the respective IC50 concentrations of GO, rGO, rGO–Ag, and AgNPs for 24 hours. After the incubation period, the culture medium was aspirated and the cell layers trypsinized. The trypsinized cells were reattached on 0.01% polylysine-coated slides, fixed with 4% methanol-free formaldehyde solution, and stained according to the manufacturer’s instructions for the TUNEL protocol (Sigma, St Louis, USA). The stained cells were observed with a Carl Zeiss epifluorescence microscope (Axiovert, Carl Zeiss Meditec AG, Jena, Germany) using a triple bandpass filter. To determine the percentage of cells experiencing apoptosis, 1,000 cells were counted in each experiment. Based on the TUNEL reaction using terminal deoxynucleotidyl transferase and fluorescein-labeled dUTP, fluorescence detection of cells with apoptotic DNA strand breaks was performed. To examine the total cell numbers, the nuclei were labeled simultaneously with DAPI (4′,6-diamidino-2-phenylindole). Merged images of both channels were shown using a fluorescence microscope (Olympus Corporation) at 500× magnification.
Statistical analyses
All assays were conducted in triplicate and each experiment was repeated at least three times. The results are presented as means ± standard deviation. All the experimental data were compared using the Student’s t-test. A P-value less than 0.05 was considered statistically significant.
Results and discussion
Synthesis and characterization of rGO–Ag nanocomposite using UV-Vis spectroscopy
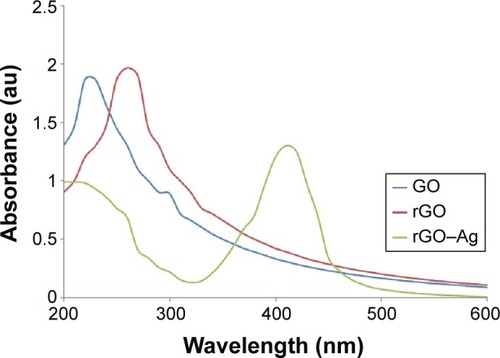
The nanocomposite was synthesized by mixing GO and AgNO3 using TAPE as a reducing and stabilizing agent. shows the UV-Vis spectrum of GO, rGO, and the rGO–Ag nanocomposite. GO exhibits two characteristic peaks at 230 and 300 nm, corresponding to the π–π* transitions of aromatic C–C bonds and n–π* transitions of C=O bonds, respectively. The UV-Vis spectrum of rGO exhibits a characteristic band at 261 nm, indicating the restoration of the extensive conjugated spCitation2 carbon network.Citation10,Citation57,Citation69–Citation71 A new peak at 410 nm is observed after the deposition of AgNPs on the rGO surface; the band at 410 nm in the absorption spectrum of the rGO–Ag nanocomposite is attributed to surface plasmons and indicates the presence of AgNPs.Citation64,Citation69,Citation71,Citation72 The disappear ance of the characteristic peaks of rGO and the emergence of a new band originating from AgNPs clearly indicate the simultaneous reduction of both rGO and AgNO3 and the formation of the rGO–Ag composite. Pasricha et alCitation54 reported the synthesis of Ag–GO nanocomposites under alkaline conditions. NaBH4 was used to reduce Ag ions to generate GO nanosheet-based nanocomposites.Citation73 Al-Marri et alCitation74 reported the simultaneous reduction of both GO and Ag ions using Pulicaria glutinosa plant extract as the reducing agent. GO–Ag nanocomposites have been prepared with AgNO3 using various reducing agents such as sodium citrate,Citation69 ammonia,Citation52 and poly(N-vinyl-2-pyrrolidone).Citation75 However, rGO–Ag nanocomposites can also be obtained using TAPE, which possesses better reducing abilities at normal pH values without requiring alkali and additional reductants as TAPE contains a large amount of natural antioxidants such as alkaloids, tannin, steroids, phenol, saponins, and flavonoids in aqueous extracts. These molecules are demonstrated by the results in to be strong reducing and stabilizing agents, with numerous OH groups found in the extracts. This method provides a simple, easy, and biomolecule-mediated synthesis of rGO–Ag nanocomposites.
Figure 1 Synthesis and characterization of graphene oxide (GO), reduced graphene oxide (rGO), and rGO–Ag nanocomposite using ultraviolet-visible spectroscopy.
Notes: Spectra of GO exhibit a maximum absorption peak at ~231 nm corresponding to the π–π transitions of aromatic C–C bonds. The absorption peak for rGO is red-shifted to 261 nm. A new peak at 410 nm is observed after deposition of Ag nanoparticles (AgNPs) on the rGO surface; the band at 410 nm in the absorption spectrum of the rGO–Ag nanocomposite is attributed to surface plasmons and the presence of AgNPs. At least three independent experiments were performed for each sample and reproducible results were obtained. The data present the results of a representative experiment.
XRD analysis of GO, rGO, and rGO–Ag nanocomposite
To support the data obtained by UV-Vis spectroscopy, GO, rGO, and rGO–Ag were further characterized using XRD. The XRD patterns of GO, rGO, and rGO–Ag are shown in , which confirms the crystalline nature of the rGO–Ag nanocomposites. GO exhibits a reflection at a low angle (2θ=10.9°) compared with the pattern of pristine Gt (2θ=26.5°). The reflection at 2θ=10.9° in GO disappears and a new reflection emerges at 2θ=26.4°, indicating the reduction of GO. However, in the rGO–Ag nanocomposites, apart from the characteristic reflections of rGO (2θ=26.4°), two different distinct reflections in the diffractogram appear at 33.1° and 45.3°, corresponding to the (111) and (200) planes, respectively, of the cubic Ag crystal of AgNPs (JCPD No 04-0783).Citation55,Citation69,Citation70,Citation75,Citation76 This confirms the formation of metallic AgNPs after reduction. Compared with the patterns of GO and rGO, the XRD pattern of the rGO–Ag nanocomposite shows clear peaks corresponding to the (111) and (200) diffraction peaks of fcc Ag, confirming that Ag exists in a crystalline state.Citation55 The absence of any additional reflections besides those of graphene and Ag clearly indicates the reduction of GO and Ag ions and suggests that the rGO–Ag nanocomposite lattice is unaffected by other molecules in the plant extract.Citation74
Figure 2 X-ray diffraction (XRD) patterns of graphene oxide (GO), reduced graphene oxide (rGO), and rGO–Ag nanocomposite.
Notes: In the XRD pattern of GO, a strong sharp peak at 2θ=10.9° corresponds to an interlayer distance of 7.6 Å. rGO has a broad peak centered at 2θ=26.4° corresponding to an interlayer distance of 3.6 Å. Apart from the characteristic reflections of rGO (2θ=26.4°), the rGO–Ag nanocomposite shows two different distinct reflections in the diffractogram at 33.1° and 45.3° corresponding to the (111) and (200) planes, respectively, of face centered cubic Ag. At least three independent experiments were performed for each sample and reproducible results were obtained. The data present the results of a representative experiment.
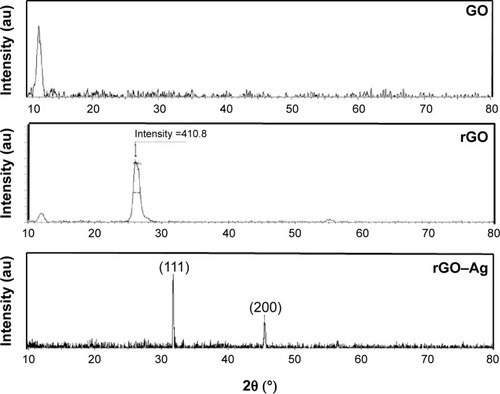
In contrast, GO shows a peak at 10.7° from the stacking of the GO layers, which may be intensified by inter-lamellar water trapped between the hydrophilic GO sheets;Citation49 the peak disappears after the decoration of GO with AgNPs. The XRD results suggest that Ag ions were reduced and AgNPs formed and then loaded on the surface of the GO sheets, preventing the stacking of the GO layers. This phenomenon may be associated with the destruction of the pre-existing lamellar structure of the GO sample after the incorporation of Ag.Citation69,Citation70,Citation72
FTIR analysis of rGO–AgNP nanocomposite
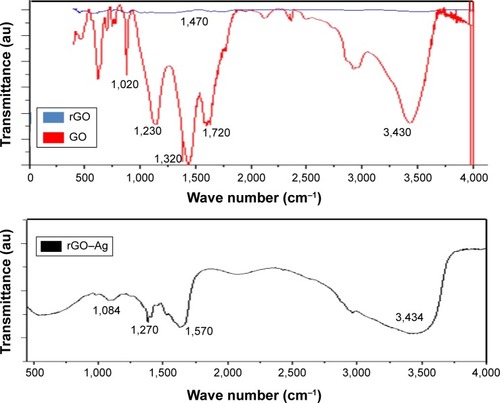
FTIR spectroscopy was used to verify the biomolecule-mediated rGO–Ag nanocomposite synthesis. The FTIR spectra of GO, rGO, and rGO–Ag nanocomposite are shown in . The GO spectrum shows dominant peaks at 1,020, 1,200, 1,350, 1,600, 1,720, and 3,430 cm−1. The peak at 1,020 cm−1 corresponds to a stretching vibration from the C–O–C bonds of epoxy or alkoxy groups. The peak at 1,200 cm−1 is attributed to C–OH bonds, while the peak centered at 1,600 cm−1 is assigned to C=C bonds associated with the skeletal vibrations of unoxidized Gt domains. The peak at 1,720 cm−1 is attributed to C=O bonds in carboxylic acid and carbonyl moieties.Citation34,Citation77,Citation78 The adsorption band at approximately 1,600 cm−1 corresponds to the C=C bonding of aromatic rings within the GO carbon skeleton structure.Citation16 Other oxygenated functional groups identified include OH at approximately 3,430 and 1,350 cm−1; C=O at approximately 1,720 cm−1; C–OH at approximately 1,200 cm−1; and C–O at approximately 1,050 cm−1. Notably, the rGO–Ag nanocomposite shows a new band at 1,420 cm−1, resulting from the C–N stretching vibration of TAPE-reduced rGO–Ag. In addition, the rGO–Ag nanocomposite spectrum shows a significant decrease in the intensity of the adsorption bands of the oxygenated functional groups; this could result from the interaction of GO with TAPE that produces C=O groups on the surface, the presence of Ag on the rGO surface, or the slight reduction of GO during the synthesis of the rGO–Ag nanocomposite.Citation79 Similarly, Chook et alCitation52 reported the synthesis of Ag–GO nanocomposites using glucose as a reducing agent in the presence of an AgNH3 complex with a GO suspension. In the FTIR spectrum of the rGO–Ag nanocomposite, the peaks at 1,020, 1,230, 1,320, 1,720, and 3,430 cm−1 are relatively weak compared to those of GO. Furthermore, the absorption peak at approximately 1,270 cm−1 is attributed to the C–OH bond, and the new absorption band at 1,570 cm−1 is attributed to the skeletal vibration of the graphene sheets.Citation71,Citation80 These results clearly demonstrate that GO was successfully exfoliated and reduced to graphene and that strong interactions may exist between AgNPs and the remaining surface hydroxyl groups.Citation81
Figure 3 Fourier transform infrared (FTIR) spectra of graphene oxide (GO), reduced graphene oxide (rGO), and rGO–Ag nanocomposite.
Notes: Dried powders of GO, rGO, and rGO–silver nanoparticle (AgNP) nanocomposite were diluted with KBr to perform FTIR spectroscopy and spectrum GX spectrometry within the range of 500–4,000 cm−1.
SEM analysis of GO, rGO, and rGO–Ag nanocomposite
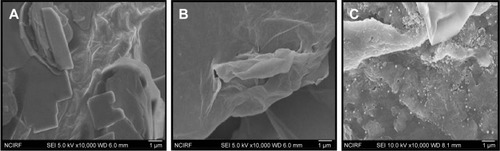
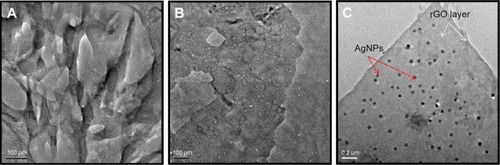
shows the SEM images of GO (), rGO (), and rGO-Ag (). GO shows a closely packed lamellar structure and a flaky texture, reflecting the multilayered microstructure (). The GO samples contain several layers of aggregated and square-shaped crumpled sheets closely associated with each other to form a continuous conducting network.Citation10,Citation65,Citation67 With the exfoliation of Gt into GO, the edges of the GO sheets become crumpled, folded, and closely restacked, and the surface of GO exhibits a soft carpet-like morphology, possibly because of the presence of residual H2O molecules and hydroxyl or carboxyl groups.Citation82 In contrast to GO, rGO exhibits transparent rippled silk-like waves or a flaky, scale-like, layered structure.Citation16 These observations agree well with a previous study in which graphene sheets obtained from GO by rapid thermal expansion in atmospheric N2 showed curled morphologies consisting of thin, wrinkled, paper-like structures, with fewer layers (approximately four) and larger specific surface areas than GO.Citation83 shows typical SEM images of the as-prepared rGO–Ag hybrids; well-dispersed AgNPs with sizes from 10 to 20 nm are deposited on the graphene. Interestingly, in the rGO doped with Ag particles and reduced, the Ag crystallites are deposited on graphene surfaces as spacers between neighboring sheets, and a curled and wavy morphology is observed. The AgNPs are well separated from each other and randomly distributed on the graphene sheets as spacers keeping the neighboring sheets separate.
Figure 4 SEM images of GO, rGO, and rGO–Ag nanocomposite.
Notes: Representative SEM images of (A) GO, (B) rGO, and (C) rGO–Ag nanocomposite dispersions at 500 μg/mL.
Abbreviations: SEM, scanning electron microscopy; GO, graphene oxide; rGO, reduced graphene oxide.
Analysis of surface morphological features of GO, rGO, and rGO–Ag by TEM
The morphological features of GO, rGO, and the rGO–Ag nanocomposite were determined by TEM analysis. shows typical TEM images of GO, rGO, and rGO–Ag; GO exhibits a closely packed lamellar and plate structure with a clean surface. In contrast to GO, rGO shows a typical sheetlike structure with a size of 100 nm. The synthesis of smaller GO sheets is extremely tedious; these results show that the synthesis method may be useful for several applications. In addition, the rGO–Ag nanocomposite shows many NPs anchored to the surfaces of both samples. The adhered NPs have spherical morphologies, an even distribution, and a homogeneous dispersion on the rGO surfaces; most of the NPs have a diameter of 20 nm. In addition, the presence of evenly distributed silky waves of rGO sheets can be observed. As shown in , well-dispersed AgNPs are homogeneously deposited on rGO sheets with sizes uniformly distributed around 20 nm. On the surface of the rGO–Ag nanocomposite, the sheets exhibit very clean silky and wavy structures. These may be important for preventing the aggregation of rGO and maintaining a surface facilitating the attachment of AgNPs to the graphene sheets. The TEM image of the rGO–Ag nanocomposite clearly indicates strong interactions between the AgNPs and GO because almost all AgNPs are distributed within the GO sheets and very few AgNPs reside outside the GO support.Citation75
Figure 5 TEM images of (A) GO, (B) rGO, and (C) rGO–Ag nanocomposite.
Abbreviations: TEM, transmission electron microscopy; GO, graphene oxide; rGO, reduced graphene oxide; AgNPs, silver nanoparticles.
Recently, Yuan et alCitation81 fabricated graphene/Ag nanocomposites (GNS/AgNPs) via a green and facile method employing GO as a precursor of graphene, AgNO3 as a precursor of AgNPs, and sodium citrate as the reducing and stabilizing agent. Chook et alCitation52 demonstrated the fabrication of AgNPs and Ag–GO nanocomposites by green microwave irradiation; the resulting Ag–GO samples showed the deposition of AgNPs with an average size of 40.7±7.5 nm on the GO sheets. The presence of transparent and uniform silk waves of rGO sheets can also be observed and attributed to the deposition of AgNPs on the surface of the GO sheets. Yun et alCitation84 reported thiolated carbon nanotube (CNT)–Ag and GO–Ag surfaces with average sizes of 2 to 4 nm. Hu et alCitation75 fabricated rGO and AgNPs using poly(N-vinyl-2-pyrrolidone) as a reductant and stabilizer. The prepared rGO–Ag nanocomposite showed nearly transparent GO sheets decorated with large amounts of well-dispersed AgNPs with average sizes of 13 nm and confined within the rGO sheets.
de Faria et alCitation69 reported the preparation and mechanisms of GO decorated with biogenic AgNPs with an average size of 3.5 nm. During the chemical synthesis of the GO–Ag nanocomposites, the AgNPs were attached to GO via the interaction of the Ag ions with the oxygenated groups on the GO surface; the carboxylic, epoxy, and hydroxyl groups could have provided sites for the anchoring and growth of the AgNPs.Citation54,Citation76,Citation85 de Faria et alCitation69 proposed a possible mechanism of GO–Ag synthesis using biological molecules in which a protein surrounding the metallic NPs could interact with oxygenated groups to allow the anchoring of AgNPs on the GO surface. The data from our experiments suggest similar mechanisms for rGO–Ag nanocomposite synthesis in which the amine groups available in TAPE could be involved in the interaction of Ag with the oxygenated groups of GO.
Raman spectroscopy analysis of GO, rGO, and rGO–Ag nanocomposite
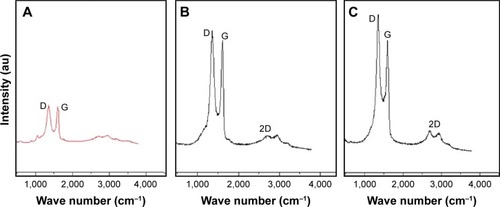
Raman spectroscopy was used to analyze information related to the electronic and structural properties of GO, rGO, and rGO–Ag nanocomposite as it is a powerful nondestructive tool for the characterization of carbonaceous materials and distinguishing ordered and disordered carbon structures.Citation71,Citation86,Citation87 This technique provided additional evidence of the reducing ability of TAPE for GO and AgNO3. As shown in , in the Raman spectrum of GO, the G band is broadened and shifted to 1,599 cm−1 while a broadened D band at 1,347 cm−1 also appears (). After the GO reduction, the Raman spectrum of rGO shows a G band at 1,584 cm−1 and a D band at 1,351 cm−1 (). The Raman spectrum shows that the typical features of rGO are a D band at approximately 1,351 cm−1 and a G band at approximately 1,584 cm−1. The D band is assigned to the breathing mode of the k-point phonons with A1g symmetry, whereas the G band introduces the E2g phonon of the carbon spCitation2 atoms.Citation88,Citation89 The prominent D peak is derived from the structural imperfections created by the attachment of hydroxyl and epoxide groups on the carbon basal plane. In the corresponding Raman spectra, the G bands of rGO and rGO–Ag are broadened because of the enhanced isolated double bonds, whereas the D bands intensify because of the enhanced disorder of the rGO and rGO–Ag nanocomposite. As shown in , the G band of the rGO–Ag nanocomposite at 1,611 cm−1 is clearly upshifted by 27 cm−1 with respect to that of rGO (1,584 cm−1), consistent with previous research showing that the introduction of Au caused the upshift of the G band by electron– phonon coupling.Citation55 Wang et alCitation90 also showed that the G band of the Au–rGO nanocomposite was clearly upshifted by 11 cm−1 with respect to that of GO. The intensity ratio of the D to G bands (ID/IG) is often used as a measure of the defect levels in graphitic systems.Citation90 Upon the introduction of Ag, the ratio of ID/IG increases to 2.09 (rGO–Ag nanocomposite) from 1.74 (rGO) and 1.54 (GO), indicating that the size of the spCitation2 domain decreases as the graphene sheet is broken into fragments during the AgNP treatment. In addition, the presence of rGO–Ag in the composites enhances the relative intensity ratio of D/G, which represents the degree of disorder. The 2D band is well known for distinguishing the thickness of the graphene sheets. For the simultaneous reductions of GO and AgNPs by TAPE, a broad 2D band at 2,672 cm–1 for the rGO–Ag nanocomposites is observed, confirming the presence of a few layers of graphene sheets in the as-prepared nanocomposite.
Figure 6 Raman spectroscopy analyses of (A) graphene oxide (GO), (B) reduced graphene oxide (rGO), and (C) rGO–Ag nanocomposite.
Notes: Raman spectra of (A) GO, (B) rGO, and (C) rGO–Ag nanocomposite were obtained using a laser excitation wavelength of 532 nm at the power of 1 mW after the removal of background fluorescence. The intensity ratio of the D to G bands (ID/IG) increases to 2.09 (rGO–Ag nanocomposite) from 1.74 (rGO) and 1.54 (GO). At least three independent experiments were performed for each sample and reproducible results were obtained.
Dose-dependent effect of rGO–Ag nanocomposite on cell viability of ovarian cancer cells
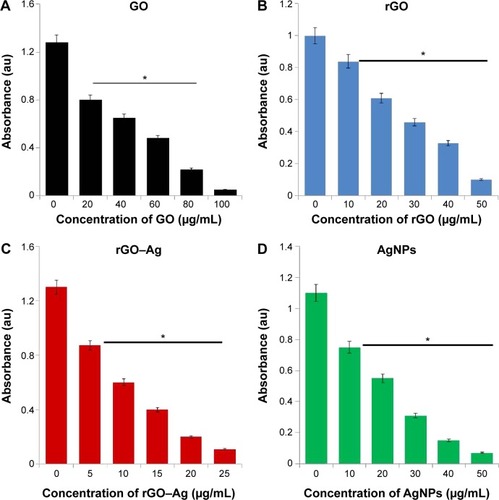
The as-prepared rGO–Ag nanocomposite materials showed significant stability and solubility in water with no aggregation after 3 months owing to the strong interactions between the rGO sheets and Ag molecules.Citation79 To show the potential applications of the rGO–Ag nanocomposite as an anticancer agent, the in vitro cytotoxicity of the rGO–Ag nanocomposite on ovarian cancer cells was determined using the MTT assay. Here, we evaluated the efficiency of the rGO–Ag nanocomposite as a potential inhibitory agent for ovarian cancer cells and used three different nanomaterials of GO, rGO, and AgNPs as controls. shows the results of the cell viability analysis. A dose-dependent inhibition of the cell viability is observed with GO in the range of 20–100 μg/mL with an IC50 of ~60 μg/mL (). Using rGO, a dose-dependent inhibition of the cell viability is observed in the range of 10–50 μg/mL with an IC50 of ~25 μg/mL (). With rGO–Ag, a dose-dependent inhibition of the cell viability is observed in the range of 5–25 μg/mL with an IC50 of ~12.5 μg/mL (). A dose-dependent inhibition of the cell viability is observed with AgNPs in the range of 10–50 μg/mL with an IC50 of ~20 μg/mL (). rGO–Ag is shown to have a more pronounced inhibitory effect on the cell viability than the other tested nanomaterials. Altogether, the results suggest that the rGO–Ag nanocomposite is a promising material for inhibiting the viability of ovarian cancer cells. Similarly, Hu et alCitation75 observed significant solubility and toxicity against HeLa cells using rGO–AgNP–folic acid. Earlier findings from other laboratories also support the reduced toxicity effect of GO observed in our results.Citation91,Citation92 Akhavan et alCitation14 demonstrated effective photothermal therapy in cancer cells and observed that the activity of the transparent GO sheets was not as effective as the action of the rGO produced through the reduction by glucose in the presence of an Fe catalyst. In our previous studies, we also reported that GO is less toxic than rGO for several cancer and non-cancer cells.Citation16,Citation44,Citation67 Yu et alCitation45 reported the efficacy of a graphene/Ag nanocomposite in bacteria.Citation39 Recently, Fiorillo et alCitation15 using large GO flakes, observed a dose-dependent inhibition of tumor sphere formation; interestingly, neither small nor large GO flakes affected the viability of the bulk non-CSC population of the MCF7 cells indicating the selectivity of GO toward CSCs of ovarian, prostate, pancreatic, and lung cancers as well as glioblastoma. This is the first comprehensive study showing the efficacy of GO, rGO, rGO–Ag nanocomposite, and AgNPs. Based on the cell viability assay above, the results suggest that the obtained rGO–Ag nanocomposite has a stronger inhibitory effect than GO, rGO, and AgNPs.
Figure 7 (A) Effects of graphene oxide (GO), (B) reduced graphene oxide (rGO), (C) rGO–Ag nanocomposite, and (D) Ag nanoparticles (AgNPs) on the viability of human ovarian cancer cells.
Notes: The viability of A2780 human ovarian cancer cells was determined after 24-hour exposure to different concentrations of GO, rGO, rGO–Ag nanocomposite, and AgNPs using the WST-8 assay. The results are expressed as the mean ± standard deviation of three independent experiments. A significant difference was observed above 50 μM. The viability of treated cells compared to the untreated cells by the Student’s t-test (*P<0.05).
Effect of rGO–Ag nanocomposite on cell morphology of ovarian cancer cells
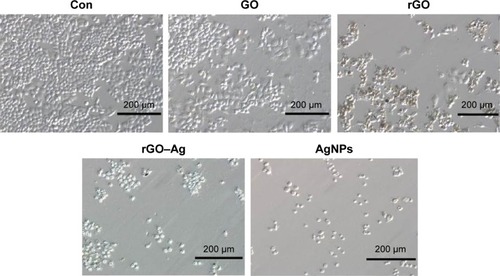
Previous studies showed that the use of GO and rGO induce apoptosis in cancer and non-cancer cells. Therefore, we examined whether the addition of the rGO–Ag nanocomposite to A2780 cultures produced any pronounced effect on the cellular morphology. In addition, to support the results of the cell viability assay, we further evaluated the effect of GO, rGO, rGO–Ag nanocomposite, and AgNPs on the cell morphology of ovarian cancer cells. To this end, we selected the IC50 concentrations of GO, rGO, rGO–Ag nanocomposite, and AgNPs, and treated the cells for 24 hours. shows a photomicrograph composite of the A2780 cells incubated for 24 hours in the presence or absence (control) of the respective IC50 concentrations of GO, rGO, rGO–Ag nanocomposite, and AgNPs. The control A2780 cells appear as small, round, dense clumps of cells with indistinct cell borders. A reduced number of cells and a significant effect on the cell morphology are observed in the A2780 cells treated with GO. The GO-treated cells look slightly different from those of the control group. A clear difference is observed between the rGO and rGO–Ag nanocomposite-treated cells and the control sample. The rGO and rGO–Ag nanocomposite-treated cells are denser and more oval, with shorter protrusions than those in the control cells. The AgNP-treated cells also show dramatic differences, but these are less evident than those observed on the rGO–Ag nanocomposite-treated cells. Similarly, Jaworski et alCitation93 reported the differential toxicity effect of GO and rGO in glioma cells. Interestingly, a severe effect on the morphology and number of the cells was observed in cells treated with rGO and rGO–Ag nanocomposite (). With the exception of the control cells, all samples show a decrease in the number of cells after treatment with GO, rGO, rGO–Ag nanocomposite, and AgNPs. A more pronounced effect on cell growth is observed in the rGO–Ag nanocomposite-treated cells than on AgNP-, rGO-, and GO-treated cells. The order of degree of the cell growth inhibition is observed as rGO–Ag nanocomposite, AgNPs, rGO, and lastly GO.
Figure 8 Morphology of human ovarian cancer cells treated with GO, rGO, rGO–Ag nanocomposite, and AgNPs.
Abbreviations: Con, control; GO, graphene oxide; rGO, reduced graphene oxide; AgNPs, silver nanoparticles.
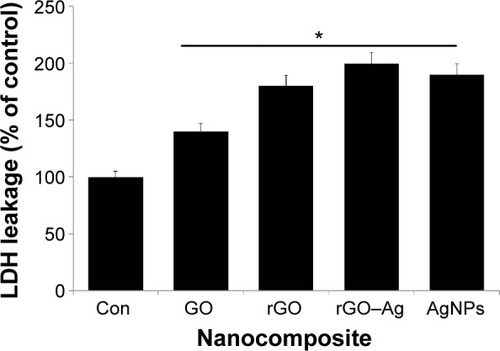
Effect of rGO–Ag nanocomposite on membrane integrity
The measurement of the cell membrane integrity is widely used to assess the cytotoxicity of chemical agents used in cells.Citation94 Among several enzymatic assays, the measurement of the extracellular activity of LDH in the culture medium is routine for toxicity assays. In this experiment, we treated the cells with IC50 concentrations of GO, rGO, rGO–Ag nanocomposite, and AgNPs for 24 hours. The intracellular LDH molecules were released into the culture medium upon the damage of the cell membrane by the treatment with graphene nanomaterials.Citation16,Citation44,Citation93 The level of LDH in the culture media indicates the extent of damage caused by the agent. The results obtained from this experiment are consistent with those of the cell viability assays, indicating that the rGO–Ag nanocomposite causes a higher leakage of LDH than the other tested nanomaterials (). Although all nanomaterials induce LDH leakage, the rGO–Ag nanocomposite has a remarkable response and a significant impact on the membrane integrity compared with the control sample. The cytotoxicity strongly depends on the type of graphene materials as well as on physical and chemical properties and the type and level of chemical functionalization.Citation10,Citation14,Citation16,Citation24,Citation44,Citation95,Citation96
Figure 9 Effect of GO, rGO, rGO–Ag nanocomposite, and AgNPs on the leakage of LDH to culture supernatant of human ovarian cancer cells.
Notes: LDH activity is measured at 490 nm using the LDH cytotoxicity kit. The results are expressed as the mean ± standard deviation of three independent experiments. There was a significant difference in the LDH activity of rGO–Ag nanocomposite-treated cells compared to that of the untreated cells by the Student’s t-test (*P<0.05).
Abbreviations: Con, control; GO, graphene oxide; rGO, reduced graphene oxide; AgNPs, silver nanoparticles; LDH, lactate dehydrogenase.
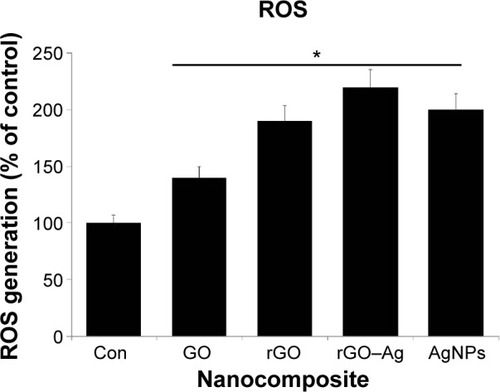
Impact of rGO–Ag nanocomposite on ROS generation
Several studies have reported the importance of ROS in cytotoxicity. Oxidative stress is one proposed toxicological mechanism of various nanomaterials, including graphene.Citation10,Citation14,Citation49 To investigate the effect of the rGO–Ag nanocomposite on ROS generation, the cells were treated with rGO–Ag nanocomposites and the other nanomaterials of GO, rGO, and AgNPs. The results clearly indicate that rGO–Ag profoundly affects ROS generation when compared to control. Although other nanomaterials also induce ROS generation, the effect of the rGO–Ag nanocomposite is considerably stronger (). Our results are consistent with previous reports on various cancer cell lines with graphene and graphene-related materials. These results show the increased generation of ROS in rGO–Ag nanocomposite-treated cells, which may result from the high cellular uptake of the rGO nanocomposite.Citation97 Chang et alCitation48 reported that GO did not enter A549 cells and exerted no significant cytotoxic effects, but induced oxidative stress in cells at high concentrations. Lammel et alCitation98 demonstrated that GO was cytotoxic to HepG2 cells through the induction of plasma membrane damage and oxidative stress. Zhang et alCitation46 clearly demonstrated the role of ROS in the cytotoxicity of PC12 cells. Our previous studies also showed that GO and rGO induced significant oxidative stress in various cancer cells, including MCF-7 cellsCitation17 and MDA-MB-231 human breast cancer cells.Citation16 Interestingly, this study shows that the toxicity of the rGO–Ag nanocomposite has a more dramatic effect on ROS generation than that of rGO, GO, or AgNPs. Thus, the mechanisms behind the cytotoxicity of the rGO–Ag nanocomposite may relate to oxidative stress.
Figure 10 GO-, rGO-, rGO–Ag nanocomposite-, and AgNP-induced ROS generation in human ovarian cancer cells.
Notes: Relative fluorescence of 2′,7′-dichlorofluorescein was measured at the excitation wavelength of 485 nm and emission wavelength of 530 nm using a spectrofluorometer. The results are expressed as the mean ± standard deviation of three independent experiments. The treated groups showed statistically significant differences from the control group by the Student’s t-test (*P<0.05).
Abbreviations: Con, control; GO, graphene oxide; rGO, reduced graphene oxide; AgNPs, silver nanoparticles; ROS, reactive oxygen species.
Effect of rGO–Ag nanocomposite on the levels of MDA and GSH
Oxidative stress plays an important role in the cytotoxicity mechanism of nanomaterials. To support the oxidative responses of the rGO–Ag nanocomposite, we assayed the cellular levels using the two well-known biomarkers of pro-oxidant MDA and antioxidant GSH. The levels of MDA are shown in . In the cells treated with GO, rGO, rGO–Ag nanocomposite, and AgNPs, MDA increases from 0.5 nmol/mg protein to 1, 1.5, 2.5, and 2.0 nmol/mg protein, respectively, compared with that in control cells. These results suggest that the rGO–Ag nanocomposite significantly increases the intracellular production of MDA. Although all tested nanomaterials affected MDA production, the strongest effect is observed in rGO–Ag nanocomposite-treated cells.
Figure 11 (A) Cellular MDA levels of A2780 cells exposure to GO, rGO, rGO–Ag nanocomposite, and AgNPs. (B) Cellular GSH levels of A2780 cells after exposure to GO, rGO, rGO–Ag nanocomposite, and AgNPs.
Notes: (A) A2780 cells were treated with the respective IC50 concentrations of GO, rGO, rGO–Ag nanocomposite, and AgNPs for 24 hours. After incubation, the cells were harvested and washed twice with an ice-cold PBS solution. The cells were collected and disrupted by ultrasonication for 5 minutes on ice. The concentration of MDA was measured on a microplate reader at a wavelength of 530 nm. (B) A2780 cells were treated with the respective IC50 concentrations of GO, rGO, rGO–Ag nanocomposite, and AgNPs for 24 hours. After incubation, the cells were harvested and washed twice with an ice-cold PBS solution. The cells were collected and disrupted by ultrasonication for 5 minutes on ice. The concentration of GSH was expressed as nmol per milligram of protein. The reaction was monitored at 405 nm in a microplate reader. *P<0.05.
Abbreviations: Con, control; IC, inhibitor concentration; MDA, malonaldehyde; GO, graphene oxide; rGO, reduced graphene oxide; AgNPs, silver nanoparticles; PBS, phosphate-buffered saline; GSH, glutathione.
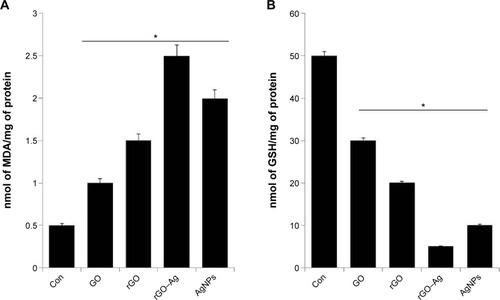
In cells, an imbalance between pro-oxidant (MDA) and antioxidant (GSH) compounds may lead to oxidative stress.Citation68 Therefore, we examined the levels of GSH (). The GSH decreased from 50 to 30, 20, 5, and 10 in cells treated with GO, rGO, rGO–Ag nanocomposite, and AgNPs, respectively, when compared with the control cells. This suggests that the rGO–Ag nanocomposite reduces the intracellular GSH level more than the other tested nanomaterials do.
In this study, the oxidative stress was evaluated by the measurement of intracellular MDA and GSH levels. The levels of MDA indicated that the lipid peroxidation significantly increased when the cells were treated with the rGO–Ag nanocomposite. Interestingly, the amounts of intracellular MDA in cells treated with the rGO–Ag nanocomposite were twice that of the control cells whereas the intracellular GSH level of the cells treated with the rGO–Ag nanocomposite was four times lower than that of the control cells. This agrees with the suggestion from previous works that an imbalance between MDA and GSH compounds could lead to oxidative stress.Citation68 Recently, Dinh et alCitation99 reported that the antibacterial activity and mechanisms of Ag-decorated multi-walled CNTs induced toxicity in bacteria. They concluded that the significant antibacterial activity resulted from synergistic effects between AgNPs and multi-walled CNTs. Our data also suggest that the possible mechanism of the cell toxicity activity is related to the synergy between membrane stress and oxidative stress. Membrane stress is mediated by the direct physical contact of rGO and Ag with the cell membrane walls, while oxidative stress is caused by the induction of ROS mediated by the functionalized rGO and Ag materials.Citation99–Citation101
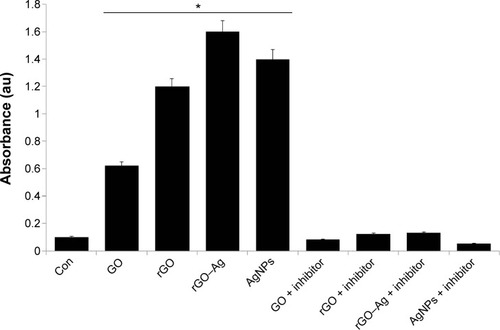
rGO–Ag nanocomposite-induced caspase-3 activity
ROS and caspases have been implicated as potential mediators of cell death.Citation102 Caspase-3, a cysteine protease, has been shown to be critical in Fas-mediated,Citation103 spontaneous,Citation104 and staurosporine-mediatedCitation105 apoptosis. However, the mechanistic relationship remains unclear in the context of graphene and graphene-related material-induced toxicity. Therefore, we investigated the role of caspases in apoptosis induced by the ROS generated by rGO–Ag and other carbon nanomaterials. To determine the importance of caspase-3 activation in the apoptotic pathway of the cells, the cells were treated with respective IC50 concentrations of GO, rGO, rGO–Ag nanocomposite, and AgNPs. When the cells are treated for 24 hours, the activity of caspase-3 increases significantly compared to that of the control (). However, as with the other biochemical assays, the rGO–Ag nanocomposite-treated culture shows a remarkably higher level of caspase-3 activity than cultures treated with other tested nanomaterials. Treatment with iron oxide NPs in MCF-7 cells revealed that the mode of cell death was apoptosis, mediated by the ROS-triggered mitochondrial pathway, as evidenced by the cleavage of the caspase-3 activity.Citation106 The activation signal of caspase-3 seemed to be through the induction of ROS; generally, toxic chemicals like iron oxide NPs,Citation107 cadmium, and mercuryCitation108 induce ROS generation. Here, a similar phenomenon may occur for the caspase-3 activation by GO, rGO, rGO–Ag nanocomposite, and AgNPs. The activation of poly(ADP-ribose)polymerase cleavable protease, such as caspase 3-like protease, has been suggested to be promoted by ROS.Citation109 The results of this assay suggest that graphene materials cause the direct involvement of a caspase-family protease in ROS-induced apoptosis. In addition, we also show that the irreversible caspase-3 inhibitor prevents the caspase-3 activation.
Figure 12 Effects of GO, rGO, rGO–Ag nanocomposite, and AgNPs on caspase-3 activity in human ovarian cancer cells.
Notes: Ovarian cancer cells were treated with GO, rGO, rGO–Ag nanocomposite, and AgNPs with or without the caspase-3 inhibitor Ac-DEVD-CHO for 24 hours. The concentration of p-nitroanilide released from the substrate was calculated from the absorbance at 405 nm. The results are expressed as the mean ± standard deviation of three separate experiments. The treated groups showed statistically significant differences from the control group by the Student’s t-test (*P<0.05).
Abbreviations: Con, control; GO, graphene oxide; rGO, reduced graphene oxide; AgNPs, silver nanoparticles; Ac-DEVD-CHO, N-Ac-Asp-Glu-Val-Asp-CHO; Ac-DEVD-pNA, acetyl-Asp-Glu-Val-Asp p-nitroanilide.
rGO–Ag nanocomposite-induced apoptosis in ovarian cancer cells
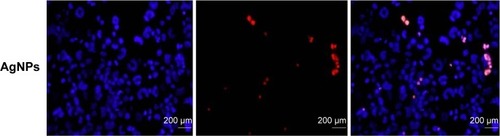
The data from the previous experiments, such as the increased production of ROS and MDA and the reduced activity of the antioxidant enzymes and GSH, suggested that the rGO–Ag nanocomposite caused induced oxidative stress, which may result in cell damage and apoptosis via DNA damage. Therefore, this experiment was designed to address whether the rGO–Ag nanocomposite could induce DNA fragmentation by oxidative stress. The DNA fragmentation assay enables the assessment of cell death, which is a hallmark of apoptosis. To confirm the induction of apoptosis in A2780 cells, the cells were treated with GO, rGO, and rGO–Ag nanocomposite for 24 hours; the TUNEL analysis was performed on the treated cells. The results indicate that treatment with GO, rGO, and rGO–Ag nanocomposite causes the appearance of a significant number of TUNEL-positive A2780 cells, whereas no apoptotic cells are observed in the control (). Interestingly, the rGO–Ag nanocomposite-treated cells show an advanced degree of fragmentation when compared with the cells treated with other tested nanomaterials. This indicates that the cytotoxicity of the rGO–Ag nanocomposite is associated with the induction of apoptosis. Recently, Akhavan et alCitation14 observed that both DNA fragmentations and chromosomal aberrations in human mesenchymal stem cells treated with low concentration rGO–NPs were caused by penetration into the cells, which resulted in interactions between the penetrated nanosheets and the cell nuclei. Earlier studies suggested that carbon nanomaterials, including multi-walled CNTs and nanodiamonds, could induce the expression of chromosomal DNA-damage biomarkers, p53, MOGG-1, and Rad51, and DNA fragmentation in mouse embryonic stem cells and embryonic stem cells, respectively.Citation110,Citation111 In our study, we observed similar DNA fragmentation in the cells treated with the rGO–Ag nanocomposite; the fragmentation is significantly higher than that in rGO-treated cells. Altogether, the data suggest that the rGO–Ag nanocomposite is a promising agent to inhibit the growth of cancer cells. The hypothetical mechanism is shown in .
Figure 13 rGO–Ag nanocomposite-induced apoptosis in human ovarian cancer cells.
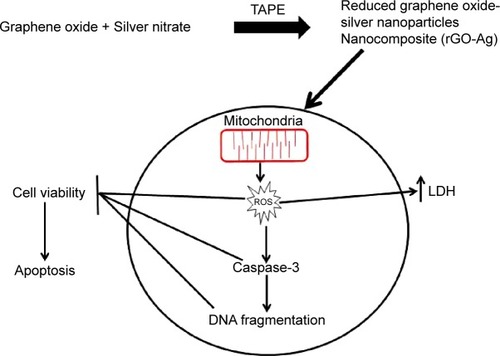
Figure 14 The hypothetical model for synthesis of rGO–Ag and its mechanisms in inducing cell death in human ovarian cancer cells.
Abbreviations: GO, graphene oxide; rGO, reduced graphene oxide; AgNO3, silver nanoparticle; LDH, lactate dehydrogenase; TAPE, Tilia amurensis plant extracts; ROS, reactive oxygen species.
Notes: The cells were treated with respective IC50 concentrations of GO, rGO, rGO–Ag nanocomposite, and AgNPs for 24 hours. Apoptosis of human ovarian cancer cells after 24-hour treatment was assessed by the TUNEL assay; the nuclei were counterstained with DAPI. Representative images show apoptotic (fragmented) DNA (red staining) and the corresponding cell nuclei (blue staining).
Abbreviations: Con, control; GO, graphene oxide; rGO, reduced graphene oxide; AgNPs, silver nanoparticles.

Conclusion
In this work, we demonstrated a simple, environmentally friendly, and dependable approach for the synthesis of rGO–Ag nanocomposites using the natural enzyme TAPE. The synthesized rGO–Ag nanocomposite was characterized by UV-Vis, FTIR, Raman spectroscopy, XRD, SEM, and TEM, which demonstrated that AgNPs with diameters of approximately 20 nm were deposited uniformly and compactly on rGO. Moreover, the rGO–Ag nanocomposite nanosheets showed excellent solubility and stability for more than 3 months. The rGO–Ag nanocomposite displayed significant cytotoxicity and showed highly effective apoptotic activity against ovarian cancer cells. The combined nanomaterials in our assays yielded a synergistic effect, which indicated that the combined process efficacy was higher than the sum of the individual efficacies of the individual nanomaterials. This novel formulation may aid the development of better anticancer therapeutics and could provide new treatments for the cancer and CSC-targeted cancer therapies.
Acknowledgments
This work was supported by the KU-Research Professor Program of Konkuk University. Dr Sangiliyandi Gurunathan was supported by a Konkuk University KU-full-time Professorship. This work was also supported by the Woo Jang-Choon project (PJ007849) and Biogreen 21 (PJ011328) from the Rural Development Administration (RDA), Republic of Korea.
Disclosure
The authors report no conflicts of interest in this work.
References
- GeimAKNovoselovKSThe rise of grapheneNat Mater20076318319117330084
- LeeCHHsueYCChenRBLiTSLinMFElectronic structures of finite double-walled carbon nanotubes in a magnetic fieldJ Phys Condens Matter2008207075213
- NovoselovKSGeimAKMorozovSVElectric field effect in atomically thin carbon filmsScience2004306569666666915499015
- StollerMDParkSJZhuYWAnJHRuoffRSGraphene-based ultracapacitorsNano Lett20088103498350218788793
- LiDMullerMBGiljeSKanerRBWallaceGGProcessable aqueous dispersions of graphene nanosheetsNature Nanotechnol20083210110518654470
- KhanJMKurchaniaRSethiVKSynthesis and characterization of two dimensional graphene lamellae based PAn nanocompositesThin Solid Films2010519310591065
- HeYMChenWJGaoCTZhouJYLiXDXieEQAn overview of carbon materials for flexible electrochemical capacitorsNanoscale20135198799882023934430
- HuiKSHuiKNDinhDAGreen synthesis of dimension-controlled silver nanoparticle-graphene oxide with in situ ultrasonicationActa Mater201464326332
- AkhavanOGhaderiEToxicity of graphene and graphene oxide nanowalls against bacteriaACS Nano20104105731573620925398
- GurunathanSHanJWDayemAAEppakayalaVKimJHOxidative stress-mediated antibacterial activity of graphene oxide and reduced graphene oxide in Pseudomonas aeruginosaInt J Nanomed2012759015914
- HuWBPengCLuoWJGraphene-based antibacterial paperACS Nano2010474317432320593851
- LuCHYangHHZhuCLChenXChenGNA graphene platform for sensing biomoleculesAngew Chem Int Edit2009482647854787
- SunXMLiuZWelsherKNanographene oxide for cellular imaging and drug deliveryNano Res20081320321220216934
- AkhavanOGhaderiEAghayeeSFereydooniYTalebiAThe use of a glucose-reduced graphene oxide suspension for photothermal cancer therapyJ Mater Chem201222271377313781
- FiorilloMVerreAFIliutMGraphene oxide selectively targets cancer stem cells, across multiple tumor types: implications for non-toxic cancer treatment, via “differentiation-based nanotherapy”Oncotarget2015663553356225708684
- GurunathanSHanJParkJHKimJHAn in vitro evaluation of graphene oxide reduced by Ganoderma spp. in human breast cancer cells (MDA-MB-231)Int J Nanomed2014917831797
- GurunathanSHanJWEppakayalaVKimJHGreen synthesis of graphene and its cytotoxic effects in human breast cancer cellsInt J Nanomed2013810151027
- ZhouLWangWTangJZhouJHJiangHJShenJGraphene oxide noncovalent photosensitizer and Its anticancer activity In vitroChem-Eur J20111743120841209121915922
- HuZHuangYDSunSFVisible light driven photodynamic anticancer activity of graphene oxide/TiO2 hybridCarbon20125039941004
- WangCWuCYZhouXJEnhancing cell nucleus accumulation and DNA cleavage activity of anti-cancer drug via graphene quantum dotsSci Rep-Uk201332852
- ChengRMZouRTOuSJGraphene oxide complex as a pH-sensitive antitumor drugPolym Chem201561324012406
- LiuGDShenHMaoJNTransferrin modified graphene oxide for glioma-targeted drug delivery: in vitro and in vivo evaluationsACS Appl Mater Interfaces20135156909691423883622
- YunSWChaJRGongMSEasy preparation of nanosilver-decorated graphene using silver carbamate by microwave irradiation and their propertiesB Korean Chem Soc201435822512256
- GurunathanSHanJWKimESParkJHKimJHReduction of graphene oxide by resveratrol: a novel and simple biological method for the synthesis of an effective anticancer nanotherapeutic moleculeInt J Nanomed20151029512969
- KhanraPKuilaTKimNHBaeSHYuDSLeeJHSimultaneous bio-functionalization and reduction of graphene oxide by baker’s yeastChem Eng J2012183526533
- KimYKKimMHMinDHBiocompatible reduced graphene oxide prepared by using dextran as a multifunctional reducing agentChem Commun2011471131953197
- StankovichSPinerRDChenXQWuNQNguyenSTRuoffRSStable aqueous dispersions of graphitic nanoplatelets via the reduction of exfoliated graphite oxide in the presence of poly(sodium 4-styrene-sulfonate)J Mater Chem2006162155158
- GurunathanSHanJWEppakayalaVDayemAAKwonDNKimJHBiocompatibility effects of biologically synthesized graphene in primary mouse embryonic fibroblast cellsNanoscale Res Lett20138139324059222
- Fernandez-MerinoMJGuardiaLParedesJIVitamin C is an ideal substitute for hydrazine in the reduction of graphene oxide suspensionsJ Phys Chem C20101141464266432
- GaoJLiuFLiuYLMaNWangZQZhangXEnvironment-friendly method to produce graphene that employs vitamin C and amino acidChem Mater201022722132218
- EsfandiarAAkhavanOIrajizadAMelatonin as a powerful bio-antioxidant for reduction of graphene oxideJ Mater Chem201121291090710914
- GurunathanSHanJKimJHHumanin: A novel functional molecule for the green synthesis of grapheneColloids Surf B Biointerfaces201311137638323850746
- AkhavanOGhaderiEEscherichia coli bacteria reduce graphene oxide to bactericidal graphene in a self-limiting mannerCarbon201250518531860
- GurunathanSHanJWEppakayalaVKimJHMicrobial reduction of graphene oxide by escherichia coli: a green chemistry approachColloids Surf B Biointerfaces201310277277723107955
- SalasECSunZZLuttgeATourJMReduction of graphene oxide via bacterial respirationACS Nano2010484852485620731460
- StensbergMCWeiQMcLamoreESPorterfieldDMWeiASepulvedaMSToxicological studies on silver nanoparticles: challenges and opportunities in assessment, monitoring and imagingNanomedicine (Lond)20116587989821793678
- BaikJMLeeSJMoskovitsMPolarized surface-enhanced raman spectroscopy from molecules adsorbed in nanogaps produced by electromigration in silver nanowiresNano Lett20099267267619159247
- ChristopherPLinicSEngineering selectivity in heterogeneous catalysis: Ag nanowires as selective ethylene epoxidation catalystsJ Am Chem Soc200813034112641126518665594
- YangEHEngineered low-dimensional nanomaterials for sensors, actuators, and electronicsJ Micro-Nanolith Mem201094041103
- LeeKSEl-SayedMAGold and silver nanoparticles in sensing and imaging: sensitivity of plasmon response to size, shape, and metal compositionJ Phys Chem B200611039192201922517004772
- SriramMIKanthSBKalishwaralalKGurunathanSAntitumor activity of silver nanoparticles in dalton’s iymphoma ascites tumor modelInt J Nanomedicine2010575376221042421
- AshaRaniPVLow Kah MunGHandeMPValiyaveettilSCytotoxicity and genotoxicity of silver nanoparticles in human cellsACS Nano20093227929019236062
- KalishwaralalKBarathManiKanthSPandianSRKDeepakVGurunathanSSilver nano – a trove for retinal therapiesJ Control Release20101452769020359511
- GurunathanSHanJWEppakayalaVJeyarajMKimJHCytotoxicity of biologically synthesized silver nanoparticles in MDA-MB-231 human breast cancer cellsBiomed Res Int2013201353579623936814
- YuLZhangYTZhangBLiuJDEnhanced antibacterial activity of silver nanoparticles/halloysite nanotubes/graphene nanocomposites with sandwich-like structureSci Rep201444551
- ZhangYBAliSFDervishiECytotoxicity effects of graphene and single-wall carbon nanotubes in neural phaeochromocytoma-derived PC12 cellsACS Nano2010463181318620481456
- WangKRuanJSongHBiocompatibility of graphene oxideNanoscale Res Lett2011618
- ChangYLYangSTLiuJHIn vitro toxicity evaluation of graphene oxide on A549 cellsToxicol Lett2011200320121021130147
- LiuLLiuJWangYYanXSunDDFacile synthesis of monodispersed silver nanoparticles on graphene oxide sheets with enhanced antibacterial activityNew J Chem201135714181423
- YouJMKimDJeonSElectrocatalytic Reduction of H2O2 on Thiolate graphene oxide covalently to bonded palladium nanoparticlesJ Nanosci Nanotechnol20121253943394922852329
- ZhuYGCaoGSSunCYDesign and synthesis of NiO nanoflakes/graphene nanocomposite as high performance electrodes of pseudocapacitorRSC Adv20133421940919415
- ChookSWChiaCHZakariaSAntibacterial performance of Ag nanoparticles and AgGO nanocomposites prepared via rapid microwave-assisted synthesis methodNanoscale Res Lett20127154123020815
- ShaoYLWangHZZhangQHLiYGHigh-performance flexible asymmetric supercapacitors based on 3D porous graphene/MnO2 nanorod and graphene/Ag hybrid thin-film electrodesJ Mater Chem C20131612451251
- PasrichaRGuptaSSrivastavaAKA facile and novel synthesis of Ag-graphene-based nanocompositesSmall20095202253225919582730
- ZhangZXuFGYangWSA facile one-pot method to high-quality Ag-graphene composite nanosheets for efficient surface-enhanced Raman scatteringChem Commun2011472264406442
- LightcapIVKoselTHKamatPVAnchoring semiconductor and metal nanoparticles on a two-dimensional catalyst mat. storing and shuttling electrons with reduced graphene oxideNano Lett201010257758320055433
- LiuSTianJQWangLLiHLZhangYWSunXPStable aqueous dispersion of graphene nanosheets: noncovalent functionalization by a polymeric reducing agent and their subsequent decoration with Ag nanoparticles for enzymeless hydrogen peroxide detectionMacromolecules201043231007810083
- ShenJFShiMYanBMaHWLiNYeMXOne-pot hydrothermal synthesis of Ag-reduced graphene oxide composite with ionic liquidJ Mater Chem2011212177957801
- DinhDAHuiKSHuiKNGreen synthesis of high conductivity silver nanoparticle-reduced graphene oxide composite filmsAppl Surf Sci20142986267
- BabaTConveryPAMatsumuraNEpigenetic regulation of CD133 and tumorigenicity of CD133+ovarian cancer cellsOncogene200928220921818836486
- Burgos-OjedaDRuedaBRBuckanovichRJOvarian cancer stem cell markers: Prognostic and therapeutic implicationsCancer Lett201232211722334034
- PasukonieneVMlynskaASteponkieneSAccumulation and biological effects of cobalt ferrite nanoparticles in human pancreatic and ovarian cancer cellsMedicina-Lithuania2014504237244
- DeepakVUmamaheshwaranPSGuhanKSynthesis of gold and silver nanoparticles using purified URAKColloids Surf B Biointerfaces201186235335821592748
- GurunathanSKalishwaralalKVaidyanathanRBiosynthesis, purification and characterization of silver nanoparticles using escherichia coliColloids Surf B Biointerfaces200974132833519716685
- GurunathanSHanJWKimEKwonDNParkJKKimJHEnhanced green fluorescent protein-mediated synthesis of biocompatible grapheneJ Nanobiotechnology2014124125273520
- HummersWSOffemanREPreparation of graphitic oxideJ Am Chem Soc1958801339
- GurunathanSHanJWEppakayalaVKimJHBiocompatibility of microbially reduced graphene oxide in primary mouse embryonic fibroblast cellsColloids Surf B Biointerfaces2013105586623352948
- WangFGLiuSRShenYQProtective effects of N-acetylcysteine on cisplatin-induced oxidative stress and DNA damage in HepG2 cellsExp Ther Med2014861939194525371760
- de FariaAFMartinezDSMeiraSMAnti-adhesion and antibacterial activity of silver nanoparticles supported on graphene oxide sheetsColloids Surf B Biointerfaces201411311512424060936
- LiJLiuCYAg/Graphene heterostructures: synthesis, characterization and optical propertiesEur J Inorg Chem2010812441248
- YuanXJChaiYQYuanRZhaoQYangCLFunctionalized graphene oxide-based carbon paste electrode for potentiometric detection of copper ion(II)Anal Methods201241033323337
- XuCWangXFabrication of flexible metal-nanoparticte film using graphene oxide sheets as substratesSmall20095;1922122217
- ShenJFShiMLiNFacile synthesis and application of Ag-chemically converted graphene nanocompositeNano Res201035339349
- Al-MarriAHKhanMKhanMPulicaria glutinosa extract: a toolbox to synthesize highly reduced graphene oxide-silver nanocompositesInt J Mol Sci20151611131114225569090
- HuCFLiuYLQinJLFabrication of reduced graphene oxide and sliver nanoparticle hybrids for raman detection of absorbed folic acid: a potential cancer diagnostic probeACS Appl Mater Interfaces20135114760476823629451
- ZhouZHeDLGuoYNFabrication of polyaniline-silver nanocomposites by chronopotentiometry in different ionic liquid microemulsion systemsThin Solid Films20095172467676771
- MarcanoDCKosynkinDVBerlinJMImproved synthesis of graphene oxideACS Nano2010484806481420731455
- ZuoPPFengHFXuZZFabrication of biocompatible and mechanically reinforced graphene oxidechitosan nanocomposite filmsChem Cent J201373923442350
- ZhuYWMuraliSCaiWWGraphene and graphene oxide: synthesis, properties, and applicationsAdv Mater201022353906392420706983
- NethravathiCRajamathiMChemically modified graphene sheets produced by the solvothermal reduction of colloidal dispersions of graphite oxideCarbon2008461419941998
- YuanWHGuYJLiLGreen synthesis of graphene/Ag nanocompositesAppl Surf Sci2012261753758
- JeongBWIhmJLeeGDStability of dislocation defect with two pentagon-heptagon pairs in graphenePhys Rev B20087816165403
- LianCXTahyKFangTLiGWXingHGJenaDQuantum transport in graphene nanoribbons patterned by metal masksAppl Phys Lett20109610103109
- YunHKimJDChoiHCLeeCWAntibacterial activity of CNT-Ag and GO-Ag nanocomposites against gram-negative and gram-positive bacteriaB Korean Chem Soc2013341132613264
- FariaAFMartinezDSTMoraesACMUnveiling the role of oxidation debris on the surface chemistry of graphene through the anchoring of Ag nanoparticlesChem Mater2012242140804087
- FerrariACMeyerJCScardaciVRaman spectrum of graphene and graphene layersPhys Rev Lett2006971818740117155573
- NiyogiSBekyarovaEItkisMESpectroscopy of Covalently Functionalized GrapheneNano Lett201010104061406620738114
- AkhavanOGhaderiEPhotocatalytic reduction of graphene oxide nanosheets on TiO2 thin film for photoinactivation of bacteria in solar light irradiationJ Phys Chem C2009113472021420220
- StankovichSDikinDAPinerRDSynthesis of graphene-based nanosheets via chemical reduction of exfoliated graphite oxideCarbon200745715581565
- WangPLiuZGChenXMengFLLiuJHHuangXJUV irradiation synthesis of an Au-graphene nanocomposite with enhanced electrochemical sensing propertiesJ Mater Chem A201313291899195
- LiaoKHLinYSMacoskoCWHaynesCLCytotoxicity of graphene oxide and graphene in human erythrocytes and skin fibroblastsACS Appl Mater Interfaces2011372607261521650218
- RuizONFernandoKASWangBJGraphene oxide: a nonspecific enhancer of cellular growthACS Nano20115108100810721932790
- JaworskiSSawoszEGrodzikMIn vitro evaluation of the effects of graphene platelets on glioblastoma multiforme cellsInt J Nanomed20138413420
- ChoMHNilesAHuangRLA bioluminescent cytotoxicity assay for assessment of membrane integrity using a proteolytic biomarkerToxicol In Vitro20082241099110618400464
- SasidharanAPanchakarlaLSChandranPDifferential nanobio interactions and toxicity effects of pristine versus functionalized grapheneNanoscale2011362461246421562671
- YueHWeiWYueZGThe role of the lateral dimension of graphene oxide in the regulation of cellular responsesBiomaterials201233164013402122381473
- ChowdhurySMLalwaniGZhangKVYangJYNevilleKSitharamanBCell specific cytotoxicity and uptake of graphene nanoribbonsBiomaterials201334128329323072942
- LammelTBoisseauxPFernandez-CruzMLNavasJMInternalization and cytotoxicity of graphene oxide and carboxyl graphene nanoplatelets in the human hepatocellular carcinoma cell line Hep G2Particle Fibre Toxicol20131027
- DinhNXQuyNVHuyTQLeATDecoration of silver nanoparticles on multiwalled carbon nanotubes: antibacterial mechanism and ultra-structural analysisJ Nanomater20152015814379
- ShvedovaAAPietroiustiAFadeelBKaganVEMechanisms of carbon nanotube-induced toxicity: focus on oxidative stressToxicol Appl Pharm20122612121133
- VecitisCDZodrowKRKangSElimelechMElectronic-structure-dependent bacterial cytotoxicity of single-walled carbon nanotubesACS Nano2010495471547920812689
- HiguchiMHondaTProskeRJYehETHRegulation of reactive oxygen species-induced apoptosis and necrosis by caspase 3-like proteasesOncogene19981721275327609840939
- SchlegelJPetersIOrreniusSCPP32/apopain is a key interleukin 1 beta converting enzyme-like protease involved in fas-mediated apoptosisJ Biol Chem19962714184118448567626
- NicholsonDWAliAThornberryNAIdentification and inhibition of the ICE/CED-3 protease necessary for mammalian apoptosisNature1995376653537437596430
- JacobsenMDWeilMRaffMCRole of Ced-3/ICE-family proteases in staurosporine-induced programmed cell deathJ Cell Biol19961335104110518655577
- AlarifiSAliDAlkahtaniSAlhaderMSIron oxide nanoparticles induce oxidative stress, DNA damage, and caspase activation in the human breast cancer cell lineBiol Trace Elem Res20141591–341642424748114
- AlarifiSAliDAlakhtaniSAl SuhaibaniESAl-QahtaniAAReactive oxygen species-mediated DNA damage and apoptosis in human skin epidermal cells after exposure to nickel nanoparticlesBiol Trace Elem Res20141571849324307203
- ParkEJParkKInduction of reactive oxygen species and apoptosis in BEAS-2B cells by mercuric chlorideToxicol In Vitro200721578979417363214
- McGowanAJRuiz-RuizMCGormanAMLopez-RivasACotterTGReactive oxygen intermediate(s) (ROI): common mediator(s) of poly(ADP-ribose)polymerase (PARP) cleavage and apoptosisFEBS Lett199639232993038774867
- XingYXiongWZhuLOsawaEHussinSDaiLDNA damage in embryonic stem cells caused by nanodiamondsACS Nano2011532376238421370893
- ZhuLChangDWDaiLHongYDNA damage induced by multi-walled carbon nanotubes in mouse embryonic stem cellsNano Lett20077123592359718044946