

Abstract
Background
In lung cancer, the efficacy of conventional chemotherapy is limited due to poor drug accumulation in tumors and nonspecific cytotoxicity. Resolving these issues will increase therapeutic efficacy.
Methods
GNR-Dox-Tf-NPs (gold nanorod-doxorubicin-transferrin-nanoparticles) were prepared by different chemical approaches. The efficacy of these nanoparticles was carried out by cell viability in lung cancer and primary coronary artery smooth muscle cells. The receptor-mediated endocytosis studies were done with human transferrin and desferrioxamine preincubation. The GNR-Dox-Tf nanoparticles induced apoptosis, and DNA damage studies were done by Western blot, H2AX foci, and comet assay.
Results
We developed and tested a gold nanorod-based multifunctional nanoparticle system (GNR-Dox-Tf-NP) that carries Dox conjugated to a pH-sensitive linker and is targeted to the transferrin receptor overexpressed in human lung cancer (A549, HCC827) cells. GNR-Dox-Tf-NP underwent physicochemical characterization, specificity assays, tumor uptake studies, and hyperspectral imaging. Biological studies demonstrated that transferrin receptor-mediated uptake of the GNR-Dox-Tf-NP by A549 and HCC827 cells produced increased DNA damage, apoptosis, and cell killing compared with nontargeted GNR-Dox-NP. GNR-Dox-Tf-NP-mediated cytotoxicity was greater (48% A549, 46% HCC827) than GNR-Dox-NP-mediated cytotoxicity (36% A549, 39% HCC827). Further, GNR-Dox-Tf-NP markedly reduced cytotoxicity in normal human coronary artery smooth muscle cells compared with free Dox.
Conclusion
Thus, GNR-Dox-Tf nanoparticles can selectively target and deliver Dox to lung tumor cells and alleviate free Dox-mediated toxicity to normal cells.
Supplementary materials
Materials
HS-PEG-OMe (6,000 Da), HS-PEG-SH (3,400 Da), doxorubicin (Dox), transferrin (Tf), iminothiolane, desferrioxamine, and ethylenediaminetetraacetic acid (EDTA) were all purchased from Sigma Chemicals. Gold nanorods (GNR) were procured from Nanopartz Inc. Maleimidocapric acid hydrazine (EMCH, Thermo Scientific), SephadexG-25 (PD10, GE, Erie, PA, USA), bovine serum albumin (BSA; KSE Scientific, Durham, NC, USA), CD71 mouse monoclonal primary antibody (Cell Signaling, Danvers, MA, USA), RPMI medium (Roswell Park Memorial Institute) (Cellgro, Manassas, VA, USA), trypan blue (Lonza, MD, USA), and polyvinylidene fluoride-membrane (Millipore, Billerica, MA, USA) were all purchased from commercial vendors.
Functionalization of gold nanorods
Presynthesized cetyltrimethylammonium bromide (CTAB) stabilized GNRs were purchased from Nanopartz Inc. and conjugated with HS-PEG-OMe (mPEG-SH, methoxy polyethylene glycol thiol) and HS-PEG-EMCH (HS-PEG-NH-NH2). Briefly, 10 mL of (1.3 nM) GNR was mixed with 500 µL of 1 mM mPEG-SH, and the mixture was stirred for 5 h at room temperature. Then, the unbound mPEG-SH and CTAB molecules were removed by centrifugation at 13,500 rpm for 15 min, and the pellet was dispersed in 5 mL of milliQ water and labeled as GNR-S-mPEG.
In another vial, 1 mL of 5 mM HS-PEG-SH solution was mixed with 1 mL of 5 mM maleimidocapric acid hydrazine in 2 mL of 0.1 M sodium phosphate containing EDTA (0.1 M; pH 7.15) solution. The mixture was stirred for 12 h at room temperature. The conjugated HS-PEG-EMCH (HS-PEG-NH-NH2) solution was purified by dialysis against milliQ water using a 3,500 Da dialysis bag.
From the purified HS-PEG-EMCH solution, 1.5 mL (1 mM) of the solution was added to GNR-S-mPEG solution and stirred for 6 h at room temperature. Then, the solution was centrifuged to remove unbound and nonspecific attached molecules, and was dispersed in 5 mL of phosphate-buffered saline (PBS) and labeled as GNR particles.
Conjugation of doxorubicin onto the functionalized GNRs
Doxorubicin (Dox; 600 µg) was added to the GNR particles (EMCH-PEG-S-GNR-S-mPEG) dispersed in 5 mL of PBS solution, and the mixture was stirred for 48 h at 37°C. The unbound Dox molecules were removed by centrifugation, and the resulting pellet was dispersed in 2 mL of PBS solution. The bound Dox concentration was estimated using absorbance spectroscopy by measuring optical density at 485 nm. Hereafter, this compound is referred to as GNR-Dox-NP.
Transferrin activation and conjugation onto the functionalized GNRs
Activation of Tf was achieved by mixing 13 mg of Tf (166 nmol) with 0.5 mg of iminothiolane (3.6 µmol) in 0.1 M sodium phosphate/EDTA (pH 8.0) solution, stirred for 4 h at 4°C to produce Tf-SH (iminothiolated Tf). Tf-SH was subsequently purified by size exclusion chromatography using a Sephadex G-25 (PD10) column. The purified Tf-SH was next incubated with GNR-Dox NP for 4 h at room temperature to produce GNR-Dox-Tf-NP. Conjugation of Tf to GNR-Dox-NP was determined by dot blot analysis.
Evaluation of the pH-controlled drug release studies
GNR-Dox-NP and GNR-Dox-Tf-NP were equally dispersed in two different buffer solutions, pH 5.5 acetate buffer (0.1 M) and 7.4 PBS (0.1 M). These two solutions were incubated at 37°C with mild stirring. At intervals of 1 h for 8 h, the solutions were centrifuged, and an aliquot of the supernatant was collected and an equal amount of buffers was added at each time point of sample collection. The collected samples were measured for fluorescence at 560/485 nm emission and excitation wavelengths, respectively. The percentage of Dox released in each buffer solution was calculated by cumulative fluorescence values and compared with free Dox.
Dot blot analysis
For determining efficient conjugation of Tf to GNR-Dox-NP, dot blot analysis was performed. Briefly, 3 µL of GNR-Dox-Tf-NP and Tf-SH were spotted onto a nitrocellulose membrane and allowed to dry for 20 min at room temperature. The membrane was then soaked in 5% BSA dissolved in TBS-T (10 mM Tris, pH 7.5, containing 0.15 M NaCl, 0.1% Tween 20) for 1 h at room temperature, followed by incubation with CD71 mouse monoclonal primary antibody (1:200 dilution with BSA) for 30 min at room temperature. Then, the membrane was washed three times with TBS-T for 5 min, followed by incubation with the appropriate secondary antimouse antibody (1:1,000) for 40 min at room temperature. The membrane was then washed with TBS-T three more times, incubated with a chemiluminescence reagent (Thermo Scientific) for 1 min, and blots developed by exposing the membrane to an autoradiographic film (Thermo Scientific).
Optimization of Dox and Tf concentration
A549 cells (0.2×10⁶/well) suspended in RPMI media containing 10% serum were seeded in six-well tissue culture plates and incubated at 37°C. After 24 h, the culture medium was aspirated and replaced with 1 mL of serum-free medium. Incubation continued for 1.30 h to activate the receptors. Then, the cells were treated with GNR-Dox-NP carrying different concentrations (0.5, 1, 2, 4, 6, and 8 µg/mL) of Dox. After 4 h of Dox treatment, the culture medium was replaced with media containing 5% serum. Incubation continued for an additional 20 h. After the incubation period, the cells were washed twice with PBS and harvested. The number of viable cells was determined by trypan blue assay as previously described. The number of viable cells was calculated and expressed as a percentage. Cells that were not treated with Dox served as controls. Based on these results, we chose 2 µg/mL of Dox for all of the studies described herein.
To optimize the Tf concentration, A549 cells were seeded in six-well plates as described above for Dox optimization. We added GNR-Dox-Tf-NP with fixed Dox concentration (1.25 µg/mL) and varying Tf concentrations (0.05, 0.1, 0.2, 0.5, 1, and 2 µg/mL) to the cells. At 24 h after treatment, the cells were washed, and trypsinized, and cell viability was determined. From the results, 2 µg/mL of Tf was identified as the optimal concentration for the studies described herein.
Hyperspectral imaging
Hyperspectral data was acquired using CytoViva’s hyperspectral imaging system (CytoViva Inc., Auburn, AL, USA). The system contains a high signal-to-noise dark-field illuminator and hyperspectral imaging components integrated on a research-grade microscope. Using a motorized stage, hyperspectral data were collected in the 400–1,000 nm range for every pixel in the image one row at a time, utilizing the “pushbroom” approach. These data were compiled and presented as a datacube containing spectral and spatial data.
To identify the GNRs conjugated with Dox and Tf and Dox alone, a particle filter was run on all images to gather spectra corresponding to each substance to create reference spectral libraries. Particle filter collected spectra based on a set intensity threshold. Once the spectra were collected, they were filtered against the negative control image to eliminate any false positives. The remaining spectra comprised the spectral libraries representing GNR-Dox-NP, GNR-Dox-Tf-NP, and Dox alone.
The spectral libraries were then used to spectrally identify and spatially map GNR-Dox-NP, GNR-Dox-Tf-NP, and Dox in the 2 hour images of the cells containing each compound. Using the spectral angle mapper algorithm, the reference library was compared to each spectrum in the respective 2 hour images. Any pixel in the image whose spectrum matched a spectrum in the library was false-colored red.
Figure S1 Schematic showing step-by-step synthesis of GNR-Dox-Tf-NP.
Abbreviations: Dox, Doxorubicin; PEG, polyethylene glycol; Tf-SH, transferrin + iminothiolane; GNR-Dox-Tf-NP, gold nanorod-doxorubicin-transferrin nanoparticle.
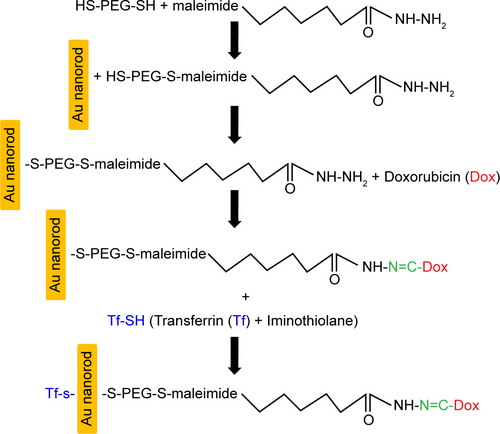
Figure S2 Histogram showing nanoparticle number and size distribution.

Acknowledgments
The authors appreciate the assistance received from the cancer functional genomics core and electron microscope core facility at the University of Oklahoma and Oklahoma Medical Research Foundation, respectively. The authors thank Kathy Kyler at the office of Vice President of Research, OUHSC, for editorial assistance. This study was supported in part by a grant received from the National Cancer Institute (R01 CA167516-03), an Institutional Development Award (IDeA) from the National Institute of General Medical Sciences (P20 GM103639) of the National Institutes of Health, and by the Jim and Christy Everest Endowed Chair in Cancer Developmental Therapeutics.
Author contributions
NA, RM, AB, MM, and EVJ conducted the studies and collected data; YDZ performed statistical analysis; NA, RM, AB, MM, EVJ, YDZ, AM, and RR conceived and designed the studies; NA, AB, AM, and RR wrote the manuscript. NA, RM, AB, MM, EVJ, YDZ, AM, and RR critically analyzed and interpreted the data; NA, RM, AB, MM, EVJ, YDZ, AM, and RR critically reviewed, provided suggestions, and edited the manuscript. RR supervised the project.
Disclosure
RR is an Oklahoma TSET research scholar and holds the Jim and Christy Everest Endowed Chair in Cancer Developmental Therapeutics. The authors report no other conflicts of interest in this work.