

Abstract
Background
Purinergic receptors control cell proliferation, apoptosis, migration, inflammation, and cytokine secretion. Increased expression of specific purinergic receptors is reported in asthma. The role of purinergic P2Y6 receptors (P2Y6R) in asthma is controversial.
Hypothesis
P2Y6R activation in asthma improves pulmonary function and reduces inflammation and smooth muscle amount.
Methods
Female mice (C57/BL6, age 30 days) were randomly assigned to receive intranasal house dust mite (HDM) antigen (40 or 80 µg) or saline, 5 days/week, for 6 weeks. Randomly selected subgroups received intraperitoneal P2Y6R agonist prodrug (GC021109; 10 or 100 µg/kg weight/dose) simultaneously with HDM. After 6 weeks, lung function was measured. Lung lavage fluid (LLF) was used to measure total cell count, total protein, and cytokines. Immunohistochemistry for alpha smooth muscle actin (α-SMA) was done. Airway wall thickness was measured on micro-computed tomography (micro-CT) images.
Results
Pulmonary function testing revealed a HDM dose-dependent airway hyperresponsiveness. Airway resistance was increased 2-fold while compliance was decreased by 50% at the higher HDM dose (P<0.05). GC021109 prevented these changes. HDM-exposed mice had elevated inflammatory cell and total protein levels in LLF which were prevented by GC021109 (P<0.05). HDM mice also had elevated LLF levels of interleukin (IL)-4, IL-5, IL-12, granulocyte colony stimulating factor, chemokine (C-X-C) motif ligand 1, and leukemia inhibitory factor that were reduced by GC021109 with a dose-dependent pattern. HDM mice had increased peribronchial and perivascular inflammatory cell infiltration and increased α-SMA; these changes were absent with GC021109. Airway wall thickness measured on micro-CT images was increased after HDM exposure and significantly reduced by GC021109 treatment.
Conclusion
The P2Y6R prodrug GC021109 inhibited allergen-induced changes in pulmonary function, inflammatory responses, and airway and vascular smooth muscle mass. P2Y6R activation may be an effective therapeutic maintenance strategy in asthma.
Supplementary materials
Figure S1 LLF fluid cell differential counts noted by a hemocytometer after Wright’s staining from mice treated with saline,
Notes: GC021109 (10 and 100 µg/kg weight/dose), HDM, or HDM + GC021109 (10 and 100 µg/kg weight/dose). Black bars: lymphocytes; green bars: macrophages; red bars: eosinophils. Data are expressed as % total white blood cells counted, and shown as mean ± SEM; N=5 mice.
Abbreviations: HDM, house dust mite; SEM, standard error of means; LLF, lung lavage fluid.
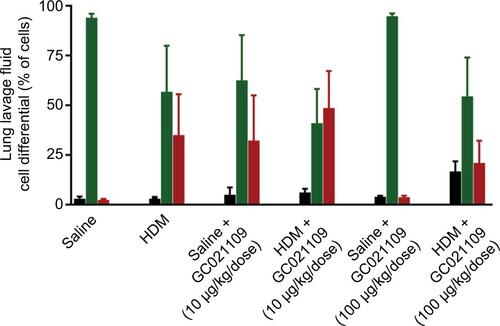
Figure S2 Additional selected cytokines significantly increased in LLF fluid by HDM and normalized by the addition of GC021109.
Notes: These results are from the same animals and were obtained in the multiplex assay explained in the legend of . They are shown as supplementary data as cytokines of interest in allergen-induced asthma that were markedly increased by HDM sensitization but the response to added GC021109 with HDM sensitization did not demonstrate a clear dose–response relationship. Nonetheless, these data do illustrate the tendency of added GC021109 to profoundly reduce the levels of specific cytokines in HDM mice. Specific treatment conditions are labeled along the X axis. The Y axis represents picograms/mL of IL-6, IL-17, LIF, and CXCL1, respectively. Data represent mean ± SEM; N=3–9; *P<0.05, compared to the saline controls; ▼P<0.01, compared to saline controls; ‡P<0.005, compared to saline controls; @P<0.10, compared to HDM: ^P<0.05, compared to HDM. The HDM + GC021109 condition in the IL-6 panel had very low identical measurements; thus, no standard error or statistical test results are shown.
Abbreviations: HDM, house dust mite; SEM, standard error of means; LLF, lung lavage fluid; IL, interleukin; LIF, leukemia inhibitory factor; CXCL1, chemokine (C-X-C) motif ligand 1.
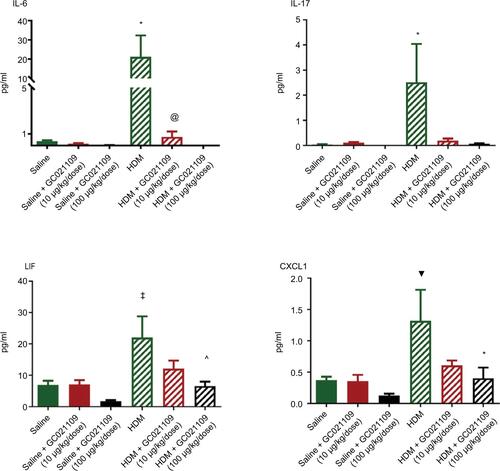
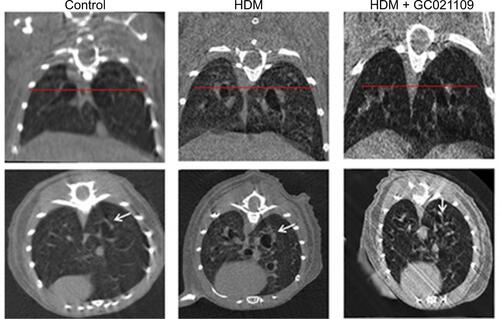
Figure S3 Representative micro-CT images of mice from the control, HDM, and HDM + GC021109 treatment groups.
Notes: Coronal (top) and transverse axis (bottom) images are shown for each condition. The horizontal line in the coronal images represents the level at which the corresponding transverse axis images were viewed and is the level of the third-generation bronchi. Arrows point to peribronchial airway thickness in third-generation airways.
Abbreviations: HDM, house dust mite; CT, computed tomography.
Acknowledgments
Department of Integrative Physiology and Pathobiology, Tufts University School of Medicine, Boston, MA, USA listed in the affiliations list is now known as Department of Immunology, Tufts University School of Medicine, Boston, MA, USA.
Disclosure
PGH is the founder and a director of GliaCure, Inc. The other authors report no conflicts of interest in this work.