
Abstract
Objective
Distinguishing the degree of differentiation, hepatocellular carcinoma (HCC) has important clinical significance in the therapeutic decision-making and patient prognosis evaluation.
Methods
We developed a deep-learning radiomics (DLR) model based on contrast-enhanced ultrasound (CEUS) to evaluate the differentiation of HCC noninvasive. We retrospectively analyzed HCC patients who had undergone resection and CEUS one week preoperatively between November 2015 and August 2022. Enrolled patients were randomly divided into training (n=190) and testing (n=82) cohorts in a 7:3 ratio. The depth of learning and radiological characteristics reflecting the differentiation degree of HCC were extracted, and the least absolute shrinkage and selection operator(LASSO) was used for feature selection to obtain the most valuable features and then build a DLR model based on the useful features.
Results
The deep-learning Radiomics model could accurately predict the degree of differentiation of HCC; the area under the curve of the DLR model in the training and testing cohorts was 0.969 and 0.932, respectively. The accuracy, sensitivity, and specificity of the CEUS-based DLR model for predicting the differentiation of HCC were 0.915, 0.938, and 0.900, respectively, in the testing cohort. The decision curve analysis confirmed that the combined model predicted good overall net income for differentiation.
Conclusion
The CEUS-based DLR model provides an easy-to-use, visual, and personalized tool for predicting the differentiation of HCC and can help doctors formulate more favorable treatment plans for patients.
Introduction
Hepatocellular carcinoma (HCC) is the most common primary liver cancer,Citation1 accounting for 80% of all cases.Citation2 Hepatectomy is a common choice for the treatment of HCC, but its 5-year recurrence rate is as high as 60%–80%.Citation1,Citation3–5 The histopathological grade is an independent predictor of postoperative HCC.Citation6 Concurrently, compared with well-differentiated and moderately differentiated tumors, poorly differentiated HCC has a higher recurrence rate and worse prognosis after surgical resection.Citation7,Citation8 Understanding the degree of HCC differentiation preoperatively can effectively guide treatment plans. Although tumor differentiation can be determined by preoperative ultrasound-guided puncture biopsy, it is an invasive procedure, and entails a risk of needle path metastasis.Citation9 Therefore, noninvasive imaging methods are urgently needed to obtain histological grading information for HCC.
Contrast-enhanced ultrasound (CEUS) has a unique advantage in showing the blood perfusion characteristics of HCC, reflecting the gene expression profile related to the proliferation of HCC cells, and is significantly related to the progression of HCC.Citation10 CEUS reflects the dynamic changes in the histopathological structure of blood flow perfusion in HCC and is highly related to the differentiation of HCC.Citation11–14 Radiomics is an artificial intelligence analysis technology for medical imaging, which has shown clinical potential for diagnosis and prognosis prediction in previous studies.Citation15,Citation16 It can decode digital medical imaging into high-throughput “semantic” features and has rapidly developed into a new tool for noninvasive tumor analysis.Citation17 Deep-learning (DL)-based Radiomics is a novel technology. Deep-learning Radiomics (DLR) analysis combined with DL features obtained by convolutional neural networks shows excellent prediction performance in medical image analysis.Citation15,Citation16 However, no studies have assessed the prediction of HCC differentiation using CEUS. In this study, we aimed to develop a CEUS-based DLR model to noninvasively evaluate HCC differentiation.
Materials and Methods
Study Population
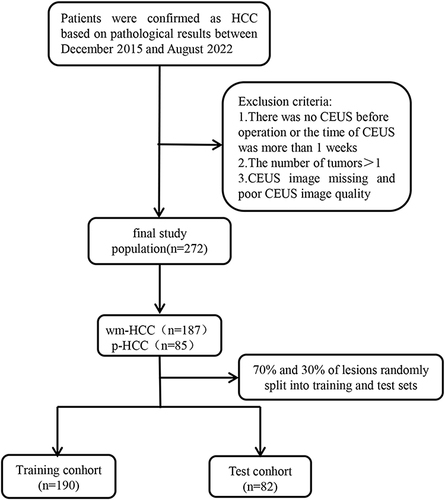
This study protocol conformed to the ethical guidelines of the Declaration of Helsinki and was approved by the institutional review committee of the First Affiliated Hospital of Anhui Medical University (PJ2021-15-41). Each patient signed a written informed consent form for CEUS before the examination. As patient consent to review their medical records was not required by the First Affiliated Hospital of Anhui Medical University, the personal information of patients was strictly protected.We conducted a retrospective, dual-center diagnostic study using CEUS images of HCC patients who had undergone resection between November 2015 and August 2022. We obtained 1088 CEUS images of 272 patients from the image databases of two hospitals and categorized them into a training group (age 49.3±12.2 years) and a test group (age 50.1±13 years). The inclusion standard package was as follows:Citation1 HCC was confirmed by pathology;Citation2 CEUS was performed within one week preoperatively;Citation3 solitary tumor; andCitation4 no liver surgery or other treatment performed for suspected HCC lesions in the past. The exclusion criteria were as follows:Citation1 preoperative anti-cancer treatment (such as radiotherapy, radiofrequency ablation, or transcatheter arterial chemoembolization) before CEUS examination;Citation2 recurrent HCC; andCitation3 non-ideal CEUS image quality evaluation or missing images. The enrolled patients were randomly divided into training (n=190) and test (n=82) queues in a ratio of 7:3. A research flowchart was shown in .
Figure 1 The flow chart is illustrated.
Pathological Analysis
The pathological materials of all patients were analyzed by a pathologist who had worked for 10 years without knowledge of the results of CEUS. Our hospital used a hematoxylin and eosin (HE) smear. Two pathologists evaluated the differentiation status of all HCC cases via HE-stained sections under a microscope. The tumor cell differentiation was classified according to the Edmondson-Steiner classification.Citation18 The patients were divided into two groups: the well-differentiated and moderately-differentiated HCC group (wm-HCC) and the poorly differentiated HCC group (p-HCC).
Contrast-Enhanced Ultrasound
CEUS was performed using the Philips IU22, EPIQ7 system and GE LOGIQ E9. A multi-frequency (5–2MHz) convex array probe (C5–2) was used. First, grayscale ultrasound was used to examine the upper abdomen and locate the tumor to be studied, and an ultrasound contrast agent (Sonovue, Boleco, Milan, Italy) was used to inject 1.5 mL of contrast agent through the elbow vein, and then washed with 5 mL of normal saline. A low mechanical index (MI<0.1) was used for CEUS examination. According to the guidelines, it was divided into the arterial phase (0–30 seconds), portal phase (31–120 seconds) and delay phase (121–300 seconds).Citation19 We selected the grayscale images, arterial phase, portal phase, and delayed phase images of the tumor for analysis. The principle of image selection in arterial phase was the image with the highest contrast intensity when the focus reaches the peak within 10–30s; The portal phase image of 60s-180s was selected for the portal phase, and the delayed phase image of more than 180s was selected for the delay phase.
Routine Radiomics Analysis
ITK software was used to manually segment the region of interest (ROI) of CEUS ultrasound (Version 3.8.0, http://www.itksnap.org/pmwiki/pmwiki.php?n=Downloads.SNAP3). The CEUS images of 50 patients were randomly selected. ROI segmentation was performed by reader 1 (with 16 years of experience in abdominal ultrasound and 8 years of CEUS) and reader 2 (with 26 years of experience in abdominal ultrasound and 6 years of CEUS), and the consistency between groups of features was reevaluated. Two weeks later, reader 1 repeated the same steps to evaluate the intra-group consistency of feature extraction. When the intragroup correlation coefficient (ICC) value was > 0.75, the extracted features showed good consistency. The remaining image segmentation was then performed by reader 1.
Radiomics feature extraction was performed using Pyronics in Python (version 2.2.0, http://www.radiomics.io/pyradiomics.htm), which could extract features from ultrasonic images by using a large number of engineering hard-coded feature algorithms. The steps to select CEUS Radiomics characteristics and construct the Radiomics score were as follows: first, the characteristics of ICC >0.75 in the training queue were retained; second, the Mann–Whitney U-test was used to screen out the characteristics with statistically significant differences between the wm-HCC and p-HCC groups in the training queue; and third, Spearman correlation coefficient was used to evaluate the correlation coefficient between features. If the correlation coefficient between two features was greater than 0.9, only one of the features was retained; Fourth, the least absolute shrinkage and selection operator (LASSO) algorithm was used to select the most valuable features; Fifth, a variety of supervised machine-learning classification algorithms were used to build the model, and support vector machine (SVM) was finally selected to build the CEUS Radiomics model according to the performance of area under the curve (AUC).
Deep-Learning Analysis
Before the image was introduced into the DL network, a doctor experienced in ultrasound diagnostics segmented and masked all images. Since CEUS was usually a dual image mode, we only retained the lesions in contrast mode. First, the size of the square segmentation mask was adjusted to maintain sufficient edges (edges are defined as the distance between the lesion boundary and the boundary of the segmentation mask itself) and, simultaneously, not exceed the boundary of the sampling frame. Subsequently, the effective area of the CEUS image was cut, and the tumor area was selected. Subsequently, an experienced radiologist further changed the image range of each segmentation mask to ensure the proportion of similar lesions and masks in each imaging mode. With all tumor information included as much as possible, the smallest region of interest was selected. Finally, all the captured ultrasound images were adjusted to a width-to-height ratio of 300×300 for quality control and to ensure the objectivity and consistency of the image data. These images were used as the input of the depth neural network. After the image was imported into the model, it was automatically scaled to a 256×256 8-bit image.
ResNet101 was a feature extraction structure with good stability and performance. Owing to the small dataset provided, it was difficult to collect images from specific fields and train classifiers from beginning to end. The migration learning model in ImageNet was trained using millions of image classifications. The core of this study was an image classification task. For better classification, the transfer learning strategy was adopted, and the pre-training model ResNet-101 was fine-tuned.All networks were implemented using the PyTorch DL framework. An Adam optimizer was used in the training process. The batch size of the network model was set to 20 and the initial learning rate was set to 0.001. The maximum number of iterations was set to 1000. With an increase in training times, the DL model was easy to overfit, resulting in poor performance on the new dataset. Separate verification was conducted at any time to ensure that training was stopped at the appropriate point and overfitting was prevented. In the process of model development, to match the data volume of the DL model and enrich the training set of images, we used data enhancement to improve the diversity and generalization of the DL data, which could effectively imitate the data diversity observed in the real world and avoid overfitting the model. The methods for training set data enhancement included random cutting, horizontal rotation, vertical rotation, center rotation, and size change. The methods of test set data enhancement included resampling and increasing noise.
Deep Learning-Based Radiomics Analysis
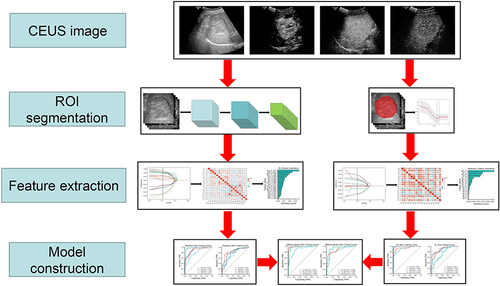
The ICC method, U-test, LASSO, and 10 times cross test method were used to select the characteristic parameters. We used the previously extracted Radiomics features and DL features to perform this process to build a Radiomics model and DL model, respectively. An SVM was used to construct the radiologic model, and a multilayer perceptron (MLP) was used to construct the DL model. Next, we used the ensemble fusion strategy of the post-fusion algorithm, including SVM, random forest (RF), logistic regression (LR), and other classifiers, to further model post-fusion processing, so that a combined prediction model can be jointly built. A schematic of the in-depth learning radiology assembly line was shown in .
Figure 2 The flow chart of CEUS-base DLR analysis for predicting differentiation of HCC is shown.
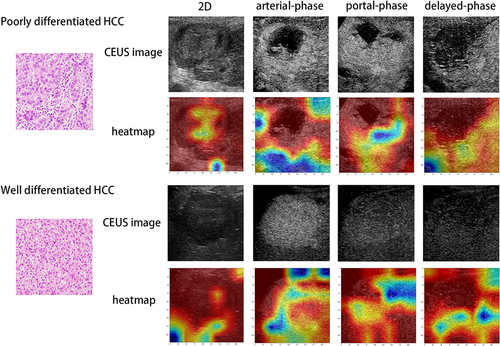
To better explain the network prediction, we used a gradient-weighted class activation map (Grade-CAM).Citation20 The key areas or features of the input image that contributed to or influence the model prediction were generated into heat maps to intuitively present the HCC differentiation pattern of the DLR model. The heat map built by Grad-CAM marked the key areas concerned by the model in red. A deeper red color indicated a lower degree of differentiation between HCC and HCC.
Statistical Analysis
All statistical analyses were performed by SPSS software 25.0 (IBM Corp., Armonk, NY, USA) and Python 2.7 (Python Software Foundation, Beaverton, OR, USA). Quantitative data with normal distribution were expressed as means ± standard deviations, whereas quantitative data with non-normal distribution were expressed as medians± interquartile intervals. Simultaneously, classification variables were expressed as numbers and percentages. Chi-square test, two independent sample Student’s t-test, and Mann–Whitney U-test were used for univariate analysis. The DeLong test was conducted to compare the AUC of the three models in the training and test groups. A value <0.05 on both sides was considered statistically significant.
Result
Clinicopathological Features of the Patients
Patient and baseline characteristics were shown in . Of the 272 patients, 187/272 (68.8%) and 85/272 (31.2%) were pathologically diagnosed with wm-HCC and p-HCC, respectively. After randomization, the patients were divided into a training cohort (n=190) and a testing cohort (n=80). In the training cohort, 53/190 (27.9%) and 137/190 (72.1%) patients were pathologically diagnosed with p-HCC and wm-HCC, respectively. In the testing cohort, 32/82 (39.0%) and 50/82 (61.0%) patients were pathologically diagnosed with p-HCC and wm-HCC, respectively.
Table 1 Patients and Baseline Characteristics
Performance of Radiomics Models
We extracted 5462 CEUS radiological features from the ultrasound images. Through inter- and intra-observer analysis and univariate correlation analysis, 1728 CEUS radiological characteristics were significantly different between the two groups. These features were imported into LASSO to obtain the most valuable features and generate 17 useful features ().The character classification weights of the features were shown in . Finally, the 17 features were used to establish CEUS Radiomics features, the ROC curve for predicting the differentiation of HCC by CEUS Radiomics was drawn, and the AUC of the training and testing samples was 0.887 and 0.848 ( and ), respectively. The accuracy, sensitivity, and specificity of the CEUS-based Radiomics score for predicting differentiation of HCC were 0.774, 0.943, and 0.708, respectively, in the training cohort and 0.793, 0.906, and 0.720, respectively, in the testing cohort ().
Table 2 Performance of the Three Models
Figure 3 Selection of significant parameters in features in the training set. (A) Spearman correlation coefficients were calculated for the 17 selected features in Radiomics model. (B) Spearman correlation coefficients were calculated for the 19 selected features in DL model.
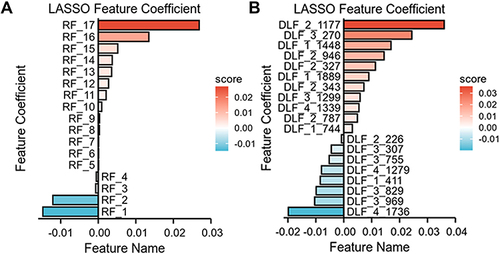
Figure 4 The definition of the linear predictor in the training set. (A) Characters classification weight of the features in Radiomics model. (B) Characters classification weight of the features in DL model.
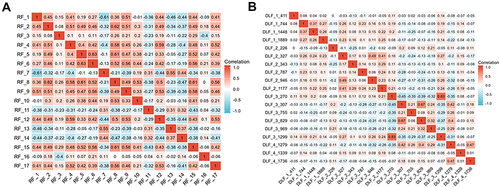
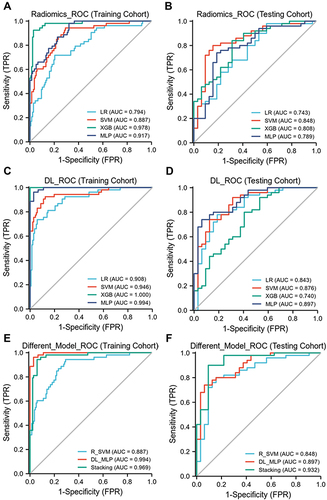
Figure 5 The AUC of radiomics model, DL model and DLR model in training cohort and testing cohort. (A and B) the AUC of Radiomics models in training and testing cohorts are 0.887 and 0.848. (C and D) the AUC of DL models in training and testing cohorts are 0.994 and 0.897. (E and F) the AUC of DLR models in training and testing cohorts are 0.969 and 0.932.
Performance of Deep Learning Model
We extracted 8096 DL features from each patient’s CEUS images (from the four types of ultrasound images) using the ResNet-101 network. The same feature-selection steps were performed to select the most significant features. Finally, 19 deep features were retained to construct a further model (), and the character classification weights of the features were seen in . In the CEUS-based DL model, the AUC in the training and testing cohorts was 0.994 and 0.897 ( and ), respectively.
The accuracy, sensitivity, and specificity of the CEUS-based DL for predicting HCC differentiation were 0.942, 0.943, and 0.942 in the training samples, respectively.In the testing sample, the accuracy, sensitivity, and specificity were 0.878, 0.906, and 0.860, respectively ().
Deep Learning Radiomics Model Performance
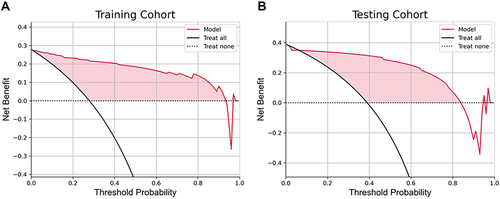
The combined model was constructed based on 17 Radiomics features and 19 DL features, and the AUC of the DLR model in the training and testing cohorts was 0.969 and 0.932 ( and ), respectively. The accuracy, sensitivity, and specificity of the CEUS-based DLR model for predicting differentiation of HCC were 0.968, 0.962, and 0.971, respectively, in the training cohort and 0.915, 0.938, and 0.900, respectively, in the testing cohort (). A decision curve analysis revealed that the combined model predicted a good overall net income of differentiation in the training cohort and the combined model ( and ).
Figure 6 The decision curve analysis for the DLR model. (A) The decision curve analysis in the training cohort. (B) The decision curve analysis in the testing cohort.
Explainability of the Deep Learning Radiomics Model
Class activation thermodynamic diagram could visualize the original image area (characteristic diagram) that the model pays attention to in the decision-making process, and this area (characteristic diagram) was closely related to the final decision-making result of the model. showed the sample CAM output of prediction probability of poorly differentiated and well-differentiated HCC. From the output, the model focused on the key areas of the image to classify lesions.
Figure 7 Visualization of two patient examples. CEUS and heatmap of poor-differentiation patients in the first and second rows, while CEUS and heatmap of well - differentiation patients in the third and fourth rows. The first to fourth columns are two-dimensional ultrasound, arterial-phase, portal-phase and delayed-phase. Red highlights the active regions associated with poorly differentiated differentiation.
Discussion
Histological grading of HCC is a recognized predictor of recurrence and survival rates in HCC patients.Citation7,Citation21 Compared to well-differentiated and moderately differentiated tumors, p-HCC has a high malignant potential and a high recurrence rate after radiofrequency ablation or resection.Citation7,Citation22 In our research, we extracted 17 Radiomics features and 19 DL features and introduced a DLR-based analysis to establish a combined model to predict the differentiation process of HCC; the AUC values in the training and testing cohorts were 0.969 and 0.932, respectively. To our knowledge, this is also the first study to use CEUS to evaluate HCC differentiation in a noninvasive manner using DLR.
Ren successfully distinguished well-differentiated HCC from p-HCC through the ultrasonic features extracted from the grayscale ultrasound images of 193 patients. He established a prediction model between the ultrasound Radiomics score and clinical parameters and obtained an AUC of 0.849. He hypothesized that Radiomics can mine tumor heterogeneity formed in grayscale ultrasound images that cannot be recognized by the naked eye.Citation23 Mao extracted enhanced CT radiation features; when the machine-learning model was trained with radiation features and clinical factors, the performance of the model significantly improved, with an AUC of 0.8014.Citation24 ResNet101 can detect and classify lesions by setting an anchor and bounding box, without separating the foreground from the background. It can directly extract features from a focus area and then combine multiple features to classify the focus.Citation25 Gu extracted the features of CT image blocks of different scales via a multi-scale patch convolutional neural network to predict the differentiation of HCC, reaching an AUC of 0.798.Citation26 Zhou used a three-dimensional SE-DenseNet DL model to predict the degree of differentiation in MR images of 75 HCC patients and obtained 83% accuracy.Citation27 DLR automatically extracts high-throughput quantitative features from medical images, and when combined with DL and Radiomics features, it shows better prediction ability than those of traditional methods.Citation28,Citation29 Recently, Ding et al developed a CT-based DLR model for the preoperative evaluation of HCC differentiation. The AUC of the training and test groups of the fusion model were 0.83 and 0.80, respectively.Citation15 Liu et al showed that a DLR model of CEUS in HCC can not only predict the progression-free survival period of radiofrequency ablation and surgical resection but also help optimize the treatment options for patients with very early or early HCC.Citation30 Compared with enhanced CT, CEUS has the advantages of high repeatability, noninvasive, radiation-free, extremely low incidence of adverse reactions, and no hepatorenal toxicity, and can reflect the continuous dynamic perfusion of tumors in real-time and evaluate angiogenesis in HCC.Citation31 We used simple and easy CEUS in combination with Radiomics and DL techniques to evaluate the differentiation of HCC before surgery. The combined model obtained satisfactory results and could be used as an effective tool for predicting HCC differentiation.
If the machine cannot explain how it knows, it will bring serious difficulties to doctors and their patients. An unexplained neural network system and its application in medical imaging are typically called “black boxes”.Citation32 We attempted to solve this problem by displaying the prediction part of the image as a heat map. A heat map was developed using Grad-CAM to perform a visual assessment based on the salient parts of the tumor regions to quickly assess the degree of differentiation in HCC. This functional visualization method provides greater confidence in the prediction ability of the DLR model.
Our study had some limitations. First, the sample size was relatively small. In the future, a large number of patients will be needed to conduct further external validation to prove the robustness and accuracy of this DLR model. Second, this was a retrospective study. We retrospectively extracted images of tumors from three periods for analyses, and potential selection bias was inevitable.
Conclusion
In summary, we proposed a diagnostic model for CEUS-based DLR. This model extracts the features of Radiomics and DL from CEUS and uses these features to distinguish the degree of HCC differentiation. Our results show that the CEUS-based DLR model can accurately assess the degree of HCC differentiation. This model provides an easy-to-use, visual, and personalized tool for predicting the differentiation of HCC and can help doctors formulate more favorable treatment plans.
Abbreviations
HCC, hepatocellular carcinoma; DLR, deep-learning radiomics; DL, deep-learning; CEUS, contrast-enhanced ultrasound; LASSO, least absolute shrinkage and selection operator; wm-HCC, the well-differentiated and moderately-differentiated HCC; p-HCC, the poorly-differentiated HCC group; ICC, intragroup correlation coefficient; SVM, support vector machine; RF, random forest; LR, logistic regression; AUC, area under the curve; MLP, multilayer perceptron; Grade-CAM, gradient-weighted class activation map.
Data Sharing Statement
The study data may be provided by contacting the corresponding author.
Ethics Approval and Informed Consent
Institutional Review Board (IRB) of the First Affiliated Hospital of Anhui Medical University approved the study and patient consent was waived for this retrospective study, in compliance with the Helsinki Declaration.
Disclosure
The authors have no conflicts of interest to declare in this work.
Additional information
Funding
References
- Forner A, Reig M, Bruix J. Hepatocellular carcinoma. Lancet. 2018;391:1301–1314. doi:10.1016/S0140-6736(18)30010-2
- Yang JD, Hainaut P, Gores GJ, Amadou A, Plymoth A, Roberts LR. A global view of hepatocellular carcinoma: trends, risk, prevention and management. Nat Rev Gastroenterol Hepatol. 2019;16:589–604. doi:10.1038/s41575-019-0186-y
- Tabrizian P, Jibara G, Shrager B, Schwartz M, Roayaie S. Recurrence of hepatocellular cancer after resection: patterns, treatments, and prognosis. Ann Surg. 2015;261:947–955. doi:10.1097/SLA.0000000000000710
- Chen W, Zheng R, Baade PD, et al. Cancer statistics in China, 2015. CA Cancer J Clin. 2016;66:115–132. doi:10.3322/caac.21338
- Zhou J, Sun HC, Wang Z, et al. 原发性肝癌诊疗规范(2019年版)[Guidelines for diagnosis and treatment of primary liver cancer in China (2019 edition)]. Zhonghua Gan Zang Bing Za Zhi. 2020;28:112–128. Chinese. doi:10.3760/cma.j.issn.1007-3418.2020.02.004
- Jonas S, Bechstein WO, Steinmüller T, et al. Vascular invasion and histopathologic grading determine outcome after liver transplantation for hepatocellular carcinoma in cirrhosis. Hepatology. 2001;33:1080–1086. doi:10.1053/jhep.2001.23561
- Zhou L, Rui JA, Zhou WX, Wang SB, Chen SG, Qu Q. Edmondson-Steiner grade: a crucial predictor of recurrence and survival in hepatocellular carcinoma without microvascular invasion. Pathol Res Pract. 2017;213:824–830. doi:10.1016/j.prp.2017.03.002
- Sasaki K, Matsuda M, Ohkura Y, et al. In hepatocellular carcinomas, any proportion of poorly differentiated components is associated with poor prognosis after hepatectomy. World J Surg. 2014;38:1147–1153. doi:10.1007/s00268-013-2374-1
- Vernuccio F, Rosenberg MD, Meyer M, Choudhury KR, Nelson RC, Marin D. Negative biopsy of focal hepatic lesions: decision tree model for patient management. AJR Am J Roentgenol. 2019;212:677–685. doi:10.2214/AJR.18.20268
- Sato K, Tanaka S, Mitsunori Y, et al. Contrast-enhanced intraoperative ultrasonography for vascular imaging of hepatocellular carcinoma: clinical and biological significance. Hepatology. 2013;57:1436–1447. doi:10.1002/hep.26122
- Nicolau C, Catalá V, Vilana R, et al. Evaluation of hepatocellular carcinoma using SonoVue, a second generation ultrasound contrast agent: correlation with cellular differentiation. Eur Radiol. 2004;14:1092–1099. doi:10.1007/s00330-004-2298-0
- Kondo T, Maruyama H, Kiyono S, et al. Intensity-based assessment of microbubble-enhanced ultrasonography: phase-related diagnostic ability for cellular differentiation of hepatocellular carcinoma. Ultrasound Med Biol. 2015;41:3079–3087. doi:10.1016/j.ultrasmedbio.2015.07.033
- Fan PL, Ding H, Mao F, Chen LL, Dong Y, Wang WP. Enhancement patterns of small hepatocellular carcinoma (≤ 30 mm) on contrast-enhanced ultrasound: correlation with clinicopathologic characteristics. Eur J Radiol. 2020;132:109341. doi:10.1016/j.ejrad.2020.109341
- von Herbay A, Vogt C, Westendorff J, Häussinger D, Gregor M. Correlation between SonoVue enhancement in CEUS, HCC differentiation and HCC diameter: analysis of 130 patients with hepatocellular carcinoma (HCC). Ultraschall Med. 2009;30:544–550. doi:10.1055/s-0028-1109745
- Ding Y, Ruan S, Wang Y, et al. Novel deep learning radiomics model for preoperative evaluation of hepatocellular carcinoma differentiation based on computed tomography data. Clin Transl Med. 2021;11:e570. doi:10.1002/ctm2.570
- Sun K, Zhang J, Liu Z, et al. A deep learning radiomics analysis for identifying sinus invasion in patients with meningioma before operation using tumor and peritumoral regions. Eur J Radiol. 2022;149:110187. doi:10.1016/j.ejrad.2022.110187
- Bi WL, Hosny A, Schabath MB, et al. Artificial intelligence in cancer imaging: clinical challenges and applications. CA Cancer J Clin. 2019;69:127–157. doi:10.3322/caac.21552
- Edmondson HA, Steiner PE. Primary carcinoma of the liver: a study of 100 cases among 48,900 necropsies. Cancer. 1954;7:462–503. doi:10.1002/1097-0142(195405)7:3<462::AID-CNCR2820070308>3.0.CO;2-E
- Radiology ACo. CE US LI-RADS®2017 CORE. Available from: https://www.acr.org/-/media/ACR/Files/RADS/LI-RADS/CEUS-LI-RADS-2017-Core.pdf. Accessed January 31, 2023.
- Ramprasaath R, Selvaraju MC, Abhishek D, et al. Grad-CAM: visual explanations from deep networks via gradient-based localization. Proc IEEE Int Conf Computer Vision. 2017;2017 618–626.
- Nishie A, Tajima T, Asayama Y, et al. Diagnostic performance of apparent diffusion coefficient for predicting histological grade of hepatocellular carcinoma. Eur J Radiol. 2011;80:e29–33. doi:10.1016/j.ejrad.2010.06.019
- Iida H, Aihara T, Ikuta S, Yamanaka N. Comparative study of percutaneous radiofrequency ablation and hepatic resection for small, poorly differentiated hepatocellular carcinomas. Hepatol Res. 2014;44:E156–162. doi:10.1111/hepr.12264
- Ren S, Qi Q, Liu S, et al. Preoperative prediction of pathological grading of hepatocellular carcinoma using machine learning-based ultrasomics: a multicenter study. Eur J Radiol. 2021;143:109891. doi:10.1016/j.ejrad.2021.109891
- Mao B, Zhang L, Ning P, et al. Preoperative prediction for pathological grade of hepatocellular carcinoma via machine learning-based radiomics. Eur Radiol. 2020;30:6924–6932. doi:10.1007/s00330-020-07056-5
- He K, Ren XZ, Sun J. Deep residual learning for image recognition. Proc IEEE Confe Computer Vision Pattern Recog. 2016;2016:770–778.
- Gu D, Guo D, Yuan C, et al. Multi-scale patches convolutional neural network predicting the histological grade of hepatocellular carcinoma. Annu Int Conf IEEE Eng Med Biol Soc. 2021;2021:2584–2587. doi:10.1109/EMBC46164.2021.9630413
- Zhou Q, Zhou Z, Chen C, et al. Grading of hepatocellular carcinoma using 3D SE-DenseNet in dynamic enhanced MR images. Comput Biol Med. 2019;107:47–57. doi:10.1016/j.compbiomed.2019.01.026
- Gu J, Tong T, He C, et al. Deep learning radiomics of ultrasonography can predict response to neoadjuvant chemotherapy in breast cancer at an early stage of treatment: a prospective study. Eur Radiol. 2022;32:2099–2109. doi:10.1007/s00330-021-08293-y
- Jiang M, Li CL, Luo XM, et al. Ultrasound-based deep learning radiomics in the assessment of pathological complete response to neoadjuvant chemotherapy in locally advanced breast cancer. Eur J Cancer. 2021;147:95–105. doi:10.1016/j.ejca.2021.01.028
- Liu F, Liu D, Wang K, et al. Deep learning radiomics based on contrast-enhanced ultrasound might optimize curative treatments for very-early or early-stage hepatocellular carcinoma patients. Liver Cancer. 2020;9:397–413. doi:10.1159/000505694
- Schaible J, Stroszczynski C, Beyer LP, Jung EM. Quantitative perfusion analysis of hepatocellular carcinoma using dynamic contrast enhanced ultrasound (CEUS) to determine tumor microvascularization. Clin Hemorheol Microcirc. 2019;73:95–104. doi:10.3233/CH-199221
- Castelvecchi D. Can we open the black box of AI? Nature. 2016;538:20–23. doi:10.1038/538020a