
Abstract
Purpose
Hepatocellular carcinoma (HCC) represents one of the most common tumors in the world. Our study aims to explore new markers and therapeutic targets for HCC. Heterogeneous Nuclear ribonucleoprotein A1 (hnRNPA1) has recently been found to be involved in the progression of several types of cancer, but its role in HCC remains uncovered.
Methods
We performed bioinformatic analysis to preliminarily show the relationship between hnRNPA1 and liver cancer. Then the correlation of the hnRNPA1 gene expression with clinicopathological characteristics of HCC patients was verified by human liver cancer tissue microarrays. The functional role of this gene was evaluated by in vivo and vitro experiments.
Results
Results showed that the expression of hnRNPA1 was upregulated in HCC tissues and was associated with pathological stage of HCC patients. Knockdown of hnRNPA1 gene markedly inhibited tumor growth in vivo, and reversed the effects on proliferation, migration and invasion and promoted apoptosis in vitro. Furthermore, down-regulation of hnRNPA1 gene expression can inhibit the activity of the MEK/ERK pathway.
Conclusion
In our work, we combined bioinformatic analysis with in vivo and in vitro experiments to initially elucidate the function of hnRNPA1 in liver cancer, which may help to explore biomarkers and therapeutic targets for HCC patients.
Introduction
Liver cancer remains a major global health challenge, even though considerable progress has been made in understanding its epidemiology, risk factors and molecular mechanisms during the past decades. It is estimated that the incidence of liver cancer will exceed 1 million by 2025.Citation1 Hepatocellular carcinoma (HCC) represents approximately 90% of all cases of primary liver cancer.Citation1–3 With a 5-year survival rate of 18%, liver cancer is the second most lethal tumor worldwide.Citation3,Citation4 The outlook is even grimmer for patients from Asian countries such as China, where the 5-year survival rate is reported to be as low as 12%.Citation4 Under this circumstance, it is necessary to continue to explore the underlying mechanisms leading to HCC tumorigenesis in order to achieve new breakthroughs in HCC treatment.
In recent years, microarray transcriptomics has been widely used in tumor research, and is more comprehensive and precise. Applying bioinformatics analysis to microarray expression patterns helps identify potential therapeutic targets. In this regard, weighted gene coexpression network analysis (WGCNA), is a powerful tool for constructing correlation networks and finding hub genes and is widely used in identifying biomarkers for cancers.Citation5–8 In our research, we obtained the clinical data and RNA-seq data (HT-seq FPKM) of patients with HCC from The Cancer Genome Atlas (TCGA) database, which contains 374 liver hepatocellular carcinoma (LIHC) tumor tissues and 50 normal tissues. WGCNA was subsequently used to process the data to discern hub genes. HnRNPA1, which was highly expressed in tumor tissues and correlated with tumor stage according to the analysis results, was ultimately selected as crucial gene of interest.
HnRNPA1 belongs to the hnRNP family. HnRNPs are a large class of RNA-binding proteins, that mainly play a role in the transformation of hnRNA/pre-mRNAs into mature mRNAs, mRNA stabilization, transcription and posttranscriptional translation.Citation9,Citation10 As the most critical alternative splicing (AS) regulator, hnRNPs are associated with a variety of tumor diseases, since cancer cells can hijack and alter the AS process to facilitate their proliferation and metastasis, according to recent studies,Citation11–13 and hnRNP expression levels are detected to be altered in various tumors.Citation14–16 HnRNPA1, as the most ubiquitously expressed member of the hnRNP family, has a well-established role in regulating RNA splicing, but other functions in mediating cellular signaling are only now being appreciated.Citation17 Emerging evidence suggests that hnRNPA1 is closely related to tumor progression.Citation17–19 For example, hnRNPA1 promotes cancer cell proliferation in endometrial cancer.Citation20 HnRNPA1 interacts with G-quadruplex in the TRA2B promoter and stimulates its transcription in human colon cancer cells.Citation21 ESCO2 promotes lung adenocarcinoma progression by regulating hnRNPA1 acetylation.Citation22 Although the role of hnRNPA1 in other cancers has been reported, its function in liver cancer has rarely been verified.
In our study, we aimed to determine whether hnRNPA1 is involved in HCC progression, and its relevant molecular mechanisms. First, we confirmed that hnRNPA1 was highly expressed in liver cancer tissues through the human liver cancer tissue microarray staining. Then the facilitation effect of hnRNPA1 was verified in vivo and in vitro experiments. Furthermore, we found that hnRNPA1 regulated activity of the MEK/ERK pathway in hepatocellular carcinoma. Overall, these results showed that hnRNPA1 functions as an oncogene in HCC.
Materials and Methods
WGCNA
Characteristics and RNA-seq data (HT-seq FPKM) were downloaded from TCGA (https://cancergenome.nih.gov/), including 374 cases of LIHC tissues and 50 cases of adjacent noncancerous liver tissues. Data from tumor samples were used for co-expression network analysis, and the top 5000 genes were used to form an expression matrix according to the median value (MD) of the downloaded expression data. The WGCNA package in R was used to construct the weighted gene co-expression network and to perform subsequent analysis. The soft threshold power β was selected on the basis of the standard scale-free distribution. We performed gene clustering analysis, formed different gene modules using the dynamic tree cutting method, related modules to clinical features and identified the module of interest. The module membership (MM) and gene significance (GS) were also calculated. The network of the hub module was exported to Cytoscape 3.7.0 and the threshold of topological overlap was set to 0.02. According to the degree, the top 30 hub genes were screened out from the module of interest and were displayed in Cytoscape 3.7.0 software. The ClusterProfiler and org.Hs.eg.db packages were used for GO and KEGG analyses. The visualization of the results was implemented by the ggplot2 package. The survival and survminer packages were used for survival analysis.
In vivo Tumor Formation
Female Balb/c-nude mice were obtained from Jiangsu GemPharmatech Biotech Co., Ltd., with a total of 10 mice and 5 mice per group. Huh7 cells stably transfected with sh-hnRNPA1 or sh-NC were subcutaneously injected in the right axillary of the female Balb/C-nude mice randomly selected (n = 5). Afterward the tumor formation and tumor volume were measured every 4 days. Four weeks after injection the mice were sacrificed and the xenograft tumors were harvested, weighed, and analyzed. The studies were approved by the School of Life Science of Fudan University (Code JS009). All experiments conformed with the Helsinki Declaration of 1975, as revised in 2008 (5) concerning Human and Animal Rights.
Liver Cancer Tissues Microarray
The liver cancer tissue microarray (HlivH150CS05) was obtained from Shanghai Outdo Biotech Company. It contains 75 liver cancer tissues and 75 adjacent noncancerous tissues along with each patient’s gender, age, clinical stage, and metastasis status information. The use of tissue microarray for research purposes was approved by the Ethics Committee of Shanghai Outdo Biotech Company (approval number: SHYJS-CP-1904006).
Immunohistochemistry (IHC) and Histological Analysis
Animal liver tissue samples were fixed in 4% paraformaldehyde, embedded in paraffin, and sliced into 5 μm sections. Animal tissues and human liver cancer tissue microarray were subjected to the following immunohistochemical staining process. First, paraffin sections were dewaxed in water. Then tissue sections were placed in a retrieval box filled with EDTA antigen retrieval buffer (pH8.0) for antigen retrieval in a microwave oven. Next, the sections were placed in 3% hydrogen peroxide solution, incubated at room temperature for 25 min in the dark to block endogenous peroxidase and subsequently blocked with 3% BSA for 30 min at room temperature. After blocking, the sections were incubated with the corresponding antibodies. Finally, DAB working solution was used for color development. Quantitative analysis was conducted by ImageJ software. We converted the grayscale value of the image to the optical density value (OD value) through the imageJ software. The more the amount of the measured substance, the higher the OD value. So the deeper the immunohistochemical DAB staining, the greater the OD value and the more hnRNPA1 protein expression. Animal tissue sections were also stained with hematoxylin and eosin (HE) for histological analysis.
Cell Culture
HCC cell lines (HepG2 and Huh7) were obtained from the FuHeng Biology (Shanghai, China). All of the cells were cultured in DMEM (Gibco, USA) supplemented with 10% fetal bovine serum (FBS, Gibco) and 1% penicillin-streptomycin liquid (Thermo Fisher Scientific) in a humid incubator at 37°C with 5% CO2.
Cell Transfection
Lipo8000TM Transfection Reagent (Beyotime Biotechnology, Shanghai, China) was used for cell transfection following the instructions. Liver cancer cells (HepG2 and Huh7) were transfected with scrambled siRNA (si-NC) or a specific hnRNPA1 siRNA (si-hnRNPA1), respectively, and harvested after 48 h of transfection. Lentiviral vectors and hnRNPA1-targeting lentiviral short hairpin RNAs (shRNAs) were obtained from OBiO Technology (Shanghai, China), and both were transfected into the HCC cell lines. HnRNPA1 overexpression plasmids and control plasmids were purchased from RiboBio (Guangzhou, China).
Cell Proliferation Assay
Cell viability was tested by a CCK-8 kit (Beyotime Biotechnology, Shanghai, China). The cells (3000 cells/well) were seeded in 96-well plates and were cultured for 0 h, 24 h, 48 h and 72 h, followed by incubation with 10 μL of CCK-8 assay solution in each well for 2 h. Cell proliferation was also detected via an EDU assay, using an EDU cell proliferation detection kit (Beyotime Biotechnology, Shanghai, China).
Transwell Assay
For the cell migration assay, 5 × 10⁴ Huh7 cells and 8 × 10⁴ HepG2 cells were resus pended in 200 μL of serum-free DMEM medium and seeded into the 24-well transwell upper chambers (LABSELECT, Anhui, China). Then, 600 μL of DMEM medium with 10% FBS was added to the bottom chambers. Following 24 h of incubation, the cells were fixed in 4% paraformaldehyde and stained with 0.1% crystal violet. For the cell invasion assay, the inner chamber was coated with 60 μL of Matrigel (Becton-Dickinson, USA) before the cells were seeded and incubated for 48h.The remaining operations were identical to those in the cell migration assay.
Cell Apoptosis Assay
Flow cytometry apoptosis detection kit was obtained from BioLegend (USA). Cells were washed twice with cold BioLegend’s Cell Staining Buffer, and were resuspend cells in Annexin V Binding Buffer at a concentration of 0.25–1.0×10⁷ cells/mL. Then 100 µL of cell suspension was transferred into a 5 mL test and 5 µL of FITC Annexin V was added into it. Later 10 µL of Propidium Iodide Solution was added. Cells were gently vortexed and incubated for 15 min at room temperature (25°C) in the dark. After that 400 µL of Annexin V Binding Buffer was added to each tube. The stained cells were analyzed using a FACScalibur flow cytometer (FACS Calibur, BD Biosciences, San Jose, CA, USA) with proper machine settings.
RNA Extraction and Quantitative Real-Time PCR (qRT-PCR)
Total RNA of cells was isolated using TRIzol (Invitrogen, Carlsbad, CA, USA) and reverse transcription was performed using the PrimeScript TM RT reagent Kit (Takara, Japan) on a thermal cycler apparatus (Applied B PE4500, USA). The One Step SYBR® PrimeScript™ RT-PCR Kit II (TaKaRa, China) was used for subsequent quantitative real-time RT-PCR (qRT-PCR). The results were calculated by applying the 2-ΔΔCt method. The primers for hnRNPA1 and gapdh were as follows: hnRNPA1, F: 5ʹ-TCAGAGTCTCCTAAAGAGCCC-3ʹ, R: 5ʹ-ACCTTGTGTGGCCTTGCAT-3ʹ; gapdh, F: 5ʹ-GGAGCGAGATCCCTCCAAAAT-3ʹ, R: 5ʹ-GGCTGTTGTCATACTTCTCATGG-3ʹ.
Western Blotting Analysis
Cell lysates were freshly prepared in RIPA lysis buffer (Beyotime, P0013B) with 1 mM PMSF and 1 mM phosphatase inhibitors (Abcam, ab201112) on ice before total protein extraction. Extracted protein was mixed with SDS loading buffer and denatured at 100°C for 15 min. After centrifugation, protein supernatants were subjected to SDS-polyacrylamide gel electrophoresis for separation and transferred to nitrocellulose membranes. The primary antibodies were applied for overnight at 4°C and secondary antibodies were applied for 60 min at room temperature. The immunoreactive band signal was detected by the ECL system and visualized using the BioRad imager system. See Table S1 for antibody information and the dilution ratio of each antibody.
Statistical Analysis
Statistical analyses were carried out by using SPSS 20.0 (IBM, SPSS, Chicago, IL, USA) and GraphPad Prism 7 (GraphPad Prism, Inc., La Jolla, CA, USA). The data are presented as the mean ± standard deviation (SD) of three independent experiments. The relationship between the clinical variables and hnRNPA1 expression was determined using the chi-square test. Student’s t-test or one-way analysis of variance (ANOVA) was used to assess the statistical significance of two or three group comparisons. P < 0.05 was considered statistically significant.
Results
TCGA Data Analysis to Identify the Hub Gene hnRNPA1
The gene expression matrix containing 374 HCC samples and 50 normal samples was obtained from TCGA. Then we selected the top 5000 genes by the median value for further analysis. The cluster analysis of the selected samples is shown in and the soft-thresholding power was set to 9 to construct a scale-free network (). Next, we built the adjacency matrix and constructed the topological overlap matrix (TOM). A hierarchical clustering tree (dendrogram) of genes was produced using TOM (). In addition, we calculated module eigengenes (MEs), performed clustering analysis of entire modules based on the correlations of MEs and identified ten modules (). Finally, we found that the turquoise module was highly related to the progression of liver cancer according to Pearson correlation (); thus this module was selected as the hub module for further analysis. The correlation between MM and GS of tumor stage were shown in . We visualized the network by Cytoscape 3.7.0 based on the degree of connectivity and displayed the top 30 genes in . GO and KEGG analyses were performed on the genes in the turquoise module (Figures S1 and S2) and the results suggested that these genes were associated with the mRNA surveillance pathway, regulation of mRNA processing, cell cycle, apoptosis and so on. The above bioinformatics results were combined with a literature search to find the hub gene of interested, hnRNPA1. We used the TCGA expression matrix to analyze the expression of hnRNPA1 in tumor tissue (n = 374) and nontumor tissue (n = 50) and performed a Kaplan-Meier survival analysis. As shown in and , hnRNPA1 was highly expressed in tumor tissues and the higher the expression was, the worse the prognosis of the patient.
Figure 1 Co-expression network construction. (A). Clustering dendrogram of samples. (B). The scale-free fit index for soft-thresholding powers of 1–20 and the mean connectivity for 1–20 soft-thresholding powers. (C). Gene clustering dendrogram generated based on topological overlap matrix. (D). Modules clustering dendrogram based on correlations of module eigengenes.
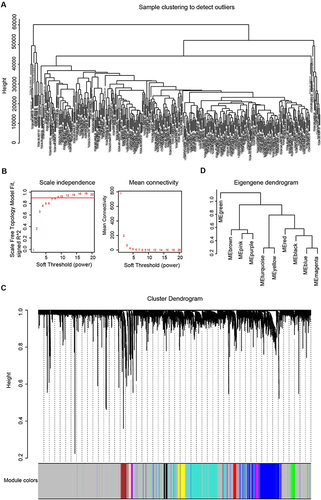
Figure 2 Identification of the hub gene. (A). Heatmap of correlations of module eigengenes with clinical traits. Each row represented a gene module and each column represented a clinical trait, and each cell showed the correlation and P value. The table was color-coded by correlation according to the color legend. (B). Scatterplots of absolute gene significance (GS) for tumor stage vs absolute module membership (MM) in the turquoise module. (C). Top 30 gene networks of the turquoise module. The genes were selected according to the degree. The redder the color, the higher the degree. (D). The expression level of hnRNPA1 in tumor (n = 374) and non-tumor tissues (n = 50). Data are expressed as the means ± SD, ****P < 0.0001. (E). Kaplan-Meier survival analysis of hnRNPA1 gene.
HnRNPA1 Overexpression in HCC Tissues
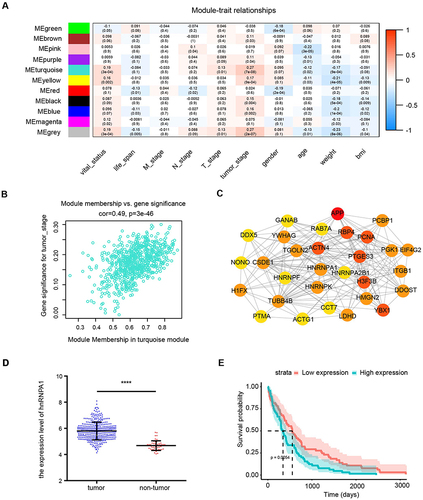
To explore the expression of the hnRNPA1 gene in liver cancer, we obtained a liver cancer tissue microarray containing 75 pairs of tumor tissues and paratumor tissues and analyzed them by IHC. As shown by the results, hnRNPA1 was highly expressed in HCC tissues ( and , P < 0.01), which was consistent with the above bioinformatics analysis results. As shown in , high expression of hnRNPA1 was related to tumor differentiation (P = 0.009) and TNM stage (P = 0.002) and was not related to age, sex, HBV infection, tumor size, and vascular invasion. We further showed that the higher the T stage was, the higher the expression of hnRNPA1 ( and , P < 0.05). Overall, these results indicated that hnRNPA1 may be associated with the proliferation and metastasis of liver cancer.
Table 1 Correlation Between Clinicopathological Features and hnRNPA1 Expression Levels of HCC Patients
Figure 3 Expression of hnRNPA1 in human hepatocellular carcinoma. (A). Representative IHC staining results of hnRNPA1 in liver cancer tissues and non-tumor tissues (scale bar = 50 μm). (B). Statistical analysis of the mean density (IOD/area) of hnRNPA1 in the corresponding tissues. Results are presented as mean ± SD from 75 pairs of samples. ****P < 0.0001. (C). Representative IHC staining results of hnRNPA1 in T1-T3 stage (scale bar = 50 μm). (D). Statistical analysis of the mean density (IOD/area) of hnRNPA1 in the corresponding T stage. Data are expressed as the means ± SD, *P < 0.05, **P < 0.01 and ****P < 0.0001.
Regulation of the HCC Cell Proliferation by hnRNPA1 in vivo
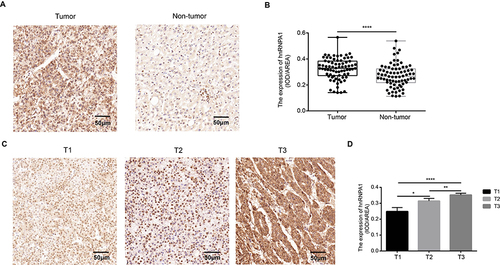
To further verify the oncogenic role of hnRNPA1 in vivo, we established xenograft mouse models (n = 5 per group). Huh7 cells stably transfected with sh-HNRNPA1 or sh-NC were subcutaneously injected into the female nude mice as two individual groups (). The xenograft tumors were smaller and lighter in the sh-hnRNPA1 group as compared to the sh-NC group (). As shown in and , tumor volume and tumor weight of the sh-hnRNPA1 group decreased significantly, compared with the sh-NC group. Moreover, we found a lower level of Ki-67 in the tumor tissues of sh-hnRNPA1 mice group (). Thus, in vivo experiment results suggested that hnRNPA1 was positively correlated with tumor proliferation.
Figure 4 Knockdown hnRNPA1 leads to a significant inhibition effect on tumorigenesis in vivo. (A and B). Gross appearance of xenograft tumors after subcutaneous injections with sh-NC and sh-hnRNPA1 group (n = 5). (C and D). Tumor volumes (C) and weights (D) of the sh-NC groups and sh-hnRNPA1 group (n = 5). (E and F) Representative images of HE (E) and IHC for Ki-67 (F), scale bar = 50 μm. (G) Histogram analysis revealed that hnRNPA1 was associated with Ki-67 expression (n = 5). Data are expressed as the means ± SD. *P < 0.05 and ***P < 0.001.
HnRNPA1 Expression Regulates HCC Cell Proliferation, Invasion, Migration and Apoptosis in vitro
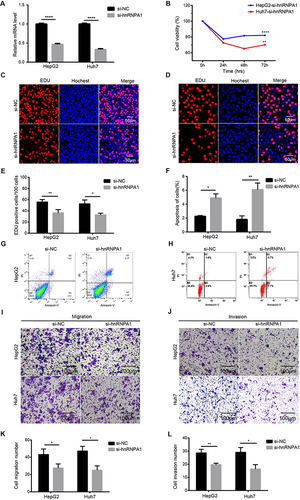
The results of si-RNA knockdown effect screening were shown in Figure S3. HnRNPA1 was significantly knocked down in HepG2 and Huh7 cells after transfection with si-hnRNPA1 (, P < 0.05), which inhibited HepG2 and Huh7 cells proliferation and promoted apoptosis. (, P < 0.05). And down-regulation of hnRNPA1 expression also inhibited the migration and invasion ability of HCC cells (, P < 0.05). In addition, this gene was also successfully upregulated in HCC cells after transfection with the hnRNPA1-overexpressing vector (Figure S4A, P < 0.05), as a result of which the proliferation of HepG2 and Huh7 cells was significantly promoted (Figure S4B–E, P < 0.05), and migration and invasion were also induced to some extent (Figure S4I–L, P < 0.05). However, no change in the apoptosis of HCC cells was observed when hnRNPA1 was overexpressed in this study (Figure S4F–H, P > 0.05). These results suggested that hnRNPA1 facilitated HCC cell proliferation, migration and invasion, and may inhibit cell apoptosis.
Figure 5 Reduced expression of hnRNPA1 decreases the proliferation, migration, and invasion, and promoted apoptosis in HCC cells. (A). Relative hnRNPA1 expression level in HepG2 and Huh7 cells transfected with si-RNAs targeting hnRNPA1 by qRT-PCR. (B–E) Proliferation of HepG2 and Huh7 cells after knockdown of hnRNPA1 by CCK-8 (B) and EDU assay (C–E), scale bar = 50 μm. (F–H) Representative results and statistical analysis of apoptosis in HepG2 (G) and Huh7 cells (H). (I–L). Representative results and statistical analysis of transwell assay (scale bar = 100 μm) in HCC cells after knockdown of hnRNPA1. Data are expressed as the means ± SD from three independent experiments. *P < 0.05, **P < 0.01, and ****P < 0.0001.
HnRNPA1 Regulates the MEK/ERK Pathway in HCC
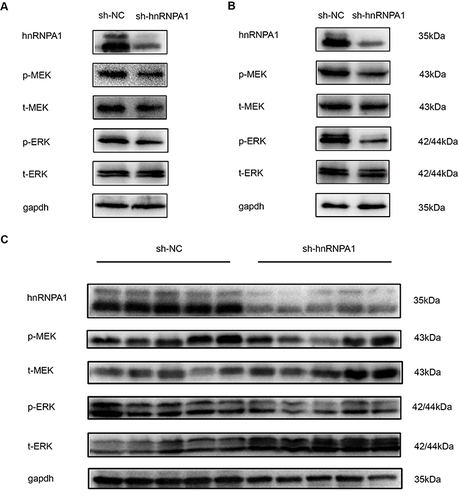
The MEK/ERK pathway plays an important role in tumor progression, and in other tumors, some members of the hnRNP family are related to this signaling pathway, so we examined the relationship between hnRNPA1 and the MEK/ERK pathway in liver cancer. When hnRNPA1 was significantly knocked down in HepG2 and Huh7 cells by transfection with sh-hnRNPA1, we found that the phosphorylation levels of MEK and ERK decreased ( and ). In animal HCC tissues, when the expression level of hnRNPA1 gene was down regulated, a decrease in the phosphorylation level of MEK/ERK signal pathway was also detected (). Therefore, through the above results, we considered that hnRNPA1 regulated the activity of the MEK/ERK pathway in HCC.
Figure 6 HnRNPA1 regulates the activity of MEK/ERK pathway in HCC. (A and B). Down regulation of hnRNPA1 reduces phosphorylation level of MEK/ERK pathway in HepG2 (A) and Huh7 (B). (C). Down regulation of hnRNPA1 reduces phosphorylation level of MEK/ERK pathway in vivo experiment (n = 5).
Discussion
Although many molecular markers have been discovered, the death and recurrence rates of liver cancer are still high, and there is still an urgent need to explore new biomarkers. In this research, we downloaded the data from the TCGA database, and used the WGCNA package in R to analyze the data of 374 liver cancer patients and 50 normal individuals to explore the hub genes. According to bioinformatics analysis, the hnRNPA1 gene was highly expressed in HCC tissue, and was closely associated to tumor stage, and the higher the expression level of hnRNPA1 was, the worse the patient’s survival. Therefore, we speculated that the hnRNPA1 gene may be related to the progression of liver cancer.
HnRNPA1, as a member of the A/B subfamily of hnRNPs, has a wide variety of functions.Citation17,Citation18,Citation23 HnRNPA1 actives nuclear factor κ B (NF-κB) by using its N-terminal RNA-binding domain to interact with IκBα.Citation24 This hnRNP also participates in the process of telomere synthesis, thus extending the cells lifespan.Citation25–27 In addition, hnRNPA1 functions in metabolic reprogramming and abnormal acetylation modification.Citation18,Citation22,Citation28 Furthermore, hnRNPA1 represses key apoptosis regulatory moleculesCitation29 and alters the cell cycle.Citation30–32 In recent years, studies have verified that hnRNPA1 facilitates tumorigenesis and metastasis in various types of cancers,Citation17,Citation33–35 among which there are also some literatures indicating that hnRNPA1 is highly expressed in liver cancer and may be related to the progression of liver cancer.Citation36–38 For example, Zhou’ research suggested that hnRNPA1 was highly expressed in liver cancer and might relate to the poor prognosis.Citation39 And another research showed that lncRNA ANCR could interacted with hnRNPA1 in liver cancer.Citation40 However, for the first time, we combined bioinformatics analysis and in vitro and in vivo experiments to completely verify the specific role of hnRNPA1 in liver cancer. In our research, we confirmed that hnRNPA1 was expressed significantly highly in hepatocellular carcinoma tissues ( and ) and was associated with T stage ( and ). Combined with clinical data, the expression level of hnRNPA1 was positively correlated with tumor stage and tumor differentiation level (). The results from clinical samples indicated a close relationship between hnRNPA1 and liver cancer. In a mouse subcutaneous tumorigenesis assay, when the gene was knocked down, tumors grew more slowly, with a low level of Ki-67 (). In vitro, hnRNPA1 promoted HCC cell lines proliferation ( and S4B–E), inhibited apoptosis () and induced cells migration and invasion ( and S4I–L). The above experimental results had demonstrated that hnRNPA1 promoted tumor cell proliferation, which was consistent with the clinical results. Due to a lack of patient survival data, we failed to confirm the relationship between this gene and the survival of liver cancer patients. At the same time, because the corresponding clinical information of the tissue microarray we obtained did not contain the corresponding liver function indicators such as the patient’s bilirubin level, creatinine level, hepatic encephalopathy and other information, so we failed to obtain more valuable indicators for liver cancer, such as BCLC staging, MELD scores and so on. We also did not correlate hnRNPA1 with these indicators. This was also the deficiency of this study. In the follow-up study, we should pay attention to the collection and analysis of these clinical information. In addition, although we reported that hnRNPA1 facilitated HCC cell migration and invasion, we did not confirm this finding with metastasis experiments in vivo level.
Among the MAPK cascades, the MEK/ERK pathway is the most well-studied and is critical for cell growth,Citation41 apoptosis,Citation42 motility,Citation43 cell metabolismCitation44 and differentiation.Citation45 The dysregulation of protein kinases in this pathway can lead to tumorigenesis.Citation46–48 Other hnRNPs have been found to regulate cancer progression through the ERK signaling pathway. HnRNPA2B1 interacts with Raf-1 to activate Raf-ERK signaling in colorectal cancer (CRC).Citation49–52 HnRNPK mediated phosphorylation of MEK/ERK affects the progression of nasopharyngeal carcinoma.Citation53 Ras/Raf/ERK1/2 signaling and hnRNPH1 are involved in exosome biogenesis and secretion in castration-resistant prostate cancer cells.Citation54–56 Therefore we examined the correlation between hnRNPA1 and MEK / ERK signaling pathway in hepatocellular carcinoma. As shown in , the phosphorylation levels of MEK and ERK were decreased in the sh-hnRNPA1 group. To a certain extent, the results in proved that the MEK/ERK pathway was associated with the hnRNPA1 in HCC cells. However this study only found that hnRNPA1 was related to the MEK / ERK pathway, but the way hnRNPA1 regulated the pathway had not been verified. This is also a limitation of this study.
In some studies, hnRNPA1 exerts its role in relation to its nuclear translocation,Citation57,Citation58 while our research did not confirm this. HnRNPA1 binds to nucleic acids by RNA recognition motifs (RRMs).Citation59 In addition to binding to nucleic acids, hnRNPA1 is involved in protein–protein interactions.Citation17 More research is needed regarding whether hnRNPA1 promotes liver cancer progression through RNA or protein binding interactions, our research did not go further. Moreover, the effect of hnRNPA1 on the metabolism of liver cancer cells had neither been investigated in this study. Hence future studies will hopefully elucidate a more specific mechanism of hnRNPA1 in liver cancer, and may contribute to a novel diagnostic or therapeutic possibilities for HCC.
Conclusions
In conclusion, the current experimental results demonstrate that hnRNPA1 regulates hepatocellular carcinoma development. High expression of hnRNPA1 in liver cancer strongly correlates with tumor aggressiveness. Collectively, our study suggests that hnRNPA1 may be a potential therapeutic target for the management of liver cancer patients in the future.
Data Sharing Statement
The datasets used and/or analyzed during the current study are available from the corresponding author on reasonable request.
Ethics Approval and Informed Consent
All research studies on humans and animals have been performed in accordance with the principles stated in the Declaration of Helsinki. Prior to starting the study, ethical approval has been obtained for all protocols from the School of Life Science of Fudan University (Code JS009) to confirm the study meets national and international guidelines for research on humans and the Guide for the Care and Use of Laboratory Animals.
Author Contributions
All authors made a significant contribution to the work reported, whether that is in the conception, study design, execution, acquisition of data, analysis and interpretation, or in all these areas; took part in drafting, revising or critically reviewing the article; gave final approval of the version to be published; have agreed on the journal to which the article has been submitted; and agree to be accountable for all aspects of the work.
Disclosure
The authors declare that the research was conducted in the absence of any commercial or financial relationships that could be construed as a potential conflict of interest.
Acknowledgments
Authors would like to acknowledge Qing Zheng for guidance with bioinformatics analyses and Bing Wang for guidance with molecular biology experiments.
Additional information
Funding
References
- Llovet JM, Kelley RK, Villanueva A, et al. Hepatocellular carcinoma. Nat Rev Dis Primers. 2021;7(1):6. doi:10.1038/s41572-020-00240-3
- Yang JD, Hainaut P, Gores GJ, Amadou A, Plymoth A, Roberts LR. A global view of hepatocellular carcinoma: trends, risk, prevention and management. Nat Rev Gastroenterol Hepatol. 2019;16(10):589–604. doi:10.1038/s41575-019-0186-y
- Qiu Z, Li H, Zhang Z, et al. A pharmacogenomic landscape in human liver cancers. Cancer Cell. 2019;36(2):179–193.e11. doi:10.1016/j.ccell.2019.07.001
- Craig AJ, von Felden J, Garcia-Lezana T, Sarcognato S, Villanueva A. Tumour evolution in hepatocellular carcinoma. Nat Rev Gastroenterol Hepatol. 2020;17(3):139–152. doi:10.1038/s41575-019-0229-4
- Langfelder P, Horvath S. WGCNA: an R package for weighted correlation network analysis. BMC Bioinform. 2008;9:559. doi:10.1186/1471-2105-9-559
- Li S, Han F, Qi N, et al. Determination of a six-gene prognostic model for cervical cancer based on WGCNA combined with LASSO and Cox-PH analysis. World J Surg Oncol. 2021;19(1):277. doi:10.1186/s12957-021-02384-2
- Giulietti M, Occhipinti G, Principato G, Piva F. Weighted gene co-expression network analysis reveals key genes involved in pancreatic ductal adenocarcinoma development. Cell Oncol. 2016;39(4):379–388. doi:10.1007/s13402-016-0283-7
- Ling B, Liao X, Huang Y, et al. Identification of prognostic markers of lung cancer through bioinformatics analysis and in vitro experiments. Int J Oncol. 2020;56(1):193–205. doi:10.3892/ijo.2019.4926
- Dreyfuss G, Matunis MJ, Piñol-Roma S, Burd CG. hnRNP proteins and the biogenesis of mRNA. Annu Rev Biochem. 1993;62:289–321. doi:10.1146/annurev.bi.62.070193.001445
- Dreyfuss G, Kim VN, Kataoka N. Messenger-RNA-binding proteins and the messages they carry. Nat Rev Mol Cell Biol. 2002;3(3):195–205. doi:10.1038/nrm760
- Le KQ, Prabhakar BS, Hong WJ, Li LC. Alternative splicing as a biomarker and potential target for drug discovery. Acta Pharmacol Sin. 2015;36(10):1212–1218. doi:10.1038/aps.2015.43
- Ule J, Blencowe BJ. Alternative splicing regulatory networks: functions, mechanisms, and evolution. Mol Cell. 2019;76(2):329–345. doi:10.1016/j.molcel.2019.09.017
- Bonnal SC, López-Oreja I, Valcárcel J. Roles and mechanisms of alternative splicing in cancer - implications for care. Nat Rev Clin Oncol. 2020;17(8):457–474. doi:10.1038/s41571-020-0350-x
- Geuens T, Bouhy D, Timmerman V. The hnRNP family: insights into their role in health and disease. Hum Genet. 2016;135(8):851–867. doi:10.1007/s00439-016-1683-5
- Liu Y, Shi SL. The roles of hnRNP A2/B1 in RNA biology and disease. Wiley Interdiscip Rev RNA. 2021;12(2):e1612. doi:10.1002/wrna.1612
- Han N, Li W, Zhang M. The function of the RNA-binding protein hnRNP in cancer metastasis. J Cancer Res Ther. 2013;9(Suppl):S129–S134. doi:10.4103/0973-1482.122506
- Roy R, Huang Y, Seckl MJ, Pardo OE. Emerging roles of hnRNPA1 in modulating malignant transformation. Wiley Interdiscip Rev RNA. 2017;8:6. doi:10.1002/wrna.1431
- Chen M, Zhang J, Manley JL. Turning on a fuel switch of cancer: hnRNP proteins regulate alternative splicing of pyruvate kinase mRNA. Cancer Res. 2010;70(22):8977–8980. doi:10.1158/0008-5472.CAN-10-2513
- Jia Q, Nie H, Yu P, et al. HNRNPA1-mediated 3’ UTR length changes of HN1 contributes to cancer- and senescence-associated phenotypes. Aging. 2019;11(13):4407–4437. doi:10.18632/aging.102060
- Jiang R, Su G, Chen X, et al. Esculetin inhibits endometrial cancer proliferation and promotes apoptosis via hnRNPA1 to downregulate BCLXL and XIAP. Cancer Lett. 2021;521:308–321. doi:10.1016/j.canlet.2021.08.039
- Nishikawa T, Kuwano Y, Takahara Y, Nishida K, Rokutan K. HnRNPA1 interacts with G-quadruplex in the TRA2B promoter and stimulates its transcription in human colon cancer cells. Sci Rep. 2019;9(1):10276. doi:10.1038/s41598-019-46659-x
- Zhu HE, Li T, Shi S, Chen DX, Chen W, Chen H. ESCO2 promotes lung adenocarcinoma progression by regulating hnRNPA1 acetylation. J Exp Clin Cancer Res. 2021;40(1):64. doi:10.1186/s13046-021-01858-1
- Levengood JD, Tolbert BS. Idiosyncrasies of hnRNP A1-RNA recognition: can binding mode influence function. Semin Cell Dev Biol. 2019;86:150–161. doi:10.1016/j.semcdb.2018.04.001
- Hay DC, Kemp GD, Dargemont C, Hay RT. Interaction between hnRNPA1 and IkappaBalpha is required for maximal activation of NF-kappaB-dependent transcription. Mol Cell Biol. 2001;21(10):3482–3490. doi:10.1128/MCB.21.10.3482-3490.2001
- Fiset S, Chabot B. hnRNP A1 may interact simultaneously with telomeric DNA and the human telomerase RNA in vitro. Nucleic Acids Res. 2001;29(11):2268–2275. doi:10.1093/nar/29.11.2268
- LaBranche H, Dupuis S, Ben-David Y, Bani MR, Wellinger RJ, Chabot B. Telomere elongation by hnRNP A1 and a derivative that interacts with telomeric repeats and telomerase. Nat Genet. 1998;19(2):199–202. doi:10.1038/575
- Redon S, Zemp I, Lingner J. A three-state model for the regulation of telomerase by TERRA and hnRNPA1. Nucleic Acids Res. 2013;41(19):9117–9128. doi:10.1093/nar/gkt695
- Lan Z, Yao X, Sun K, Li A, Liu S, Wang X. The interaction between lncRNA SNHG6 and hnRNPA1 contributes to the growth of colorectal cancer by enhancing aerobic glycolysis through the regulation of alternative splicing of PKM. Front Oncol. 2020;10:363. doi:10.3389/fonc.2020.00363
- Durie D, Lewis SM, Liwak U, Kisilewicz M, Gorospe M, Holcik M. RNA-binding protein HuR mediates cytoprotection through stimulation of XIAP translation. Oncogene. 2011;30(12):1460–1469. doi:10.1038/onc.2010.527
- Zheng J, Yue R, Yang R, et al. Visualization of zika virus infection via a light-initiated bio-orthogonal cycloaddition labeling strategy. Front Bioeng Biotech. 2022;10:940511. doi:10.3389/fbioe.2022.940511
- Sun S, Deng P, Peng C, Ji H, Mao L, Peng L. Selenium-modified chitosan induces HepG2 cell apoptosis and differential protein analysis. Cancer Manag Res. 2022;28(14):3335–3345. doi:10.2147/CMAR.S382546
- Liu X, Zhou Y, Lou Y, Zhong H. Knockdown of HNRNPA1 inhibits lung adenocarcinoma cell proliferation through cell cycle arrest at G0/G1 phase. Gene. 2016;576(2 Pt 2):791–797. doi:10.1016/j.gene.2015.11.009
- Park WC, Kim HR, Kang DB, et al. Comparative expression patterns and diagnostic efficacies of SR splicing factors and HNRNPA1 in gastric and colorectal cancer. BMC Cancer. 2016;16:358. doi:10.1186/s12885-016-2387-x
- Zheng H, Chen C, Luo Y, et al. Tumor-derived exosomal BCYRN1 activates WNT5A/VEGF-C/VEGFR3 feedforward loop to drive lymphatic metastasis of bladder cancer. Clin Transl Med. 2021;11(7):e497. doi:10.1002/ctm2.497
- Kim YJ, Kim BR, Ryu JS, et al. HNRNPA1, a splicing regulator, is an effective target protein for cervical cancer detection: comparison with conventional tumor markers. Int J Gynecol Cancer. 2017;27(2):326–331. doi:10.1097/IGC.0000000000000868
- Ke R, Lv L, Li J, et al. Prognostic value of heterogeneous ribonucleoprotein A1 expression and inflammatory indicators for patients with surgically resected hepatocellular carcinoma: perspectives from a high occurrence area of hepatocellular carcinoma in China. Oncol Lett. 2018;16(3):3746–3756. doi:10.3892/ol.2018.9079
- Ke RS, Zhang K, Lv LZ, et al. Prognostic value and oncogene function of heterogeneous nuclear ribonucleoprotein A1 overexpression in HBV-related hepatocellular carcinoma. Int J Biol Macromol. 2019;129:140–151. doi:10.1016/j.ijbiomac.2019.02.012
- Li S, Wang W, Ding H, et al. Aptamer BC15 against heterogeneous nuclear ribonucleoprotein A1 has potential value in diagnosis and therapy of hepatocarcinoma. Nucleic Acid Ther. 2012;22(6):391–398. doi:10.1089/nat.2012.0363
- Zhou ZJ, Dai Z, Zhou SL, et al., Overexpression of HnRNP A1 promotes tumor invasion through regulating CD44v6 and indicates poor prognosis for hepatocellular carcinoma. Int J Cancer. 2013;5:1080–1089. doi:10.1002/ijc.27742
- Wen Z, Lian L, Ding H, et al. LncRNA ANCR promotes hepatocellular carcinoma metastasis through upregulating HNRNPA1 expression. RNA Biology. 2020;17(3):381–394. doi:10.1080/15476286.2019.1708547
- Squires MS, Nixon PM, Cook SJ. Cell-cycle arrest by PD184352 requires inhibition of extracellular signal-regulated kinases (ERK) 1/2 but not ERK5/BMK1. Biochem J. 2002;366(Pt 2):673–680. doi:10.1042/bj20020372
- Berra E, Diaz-Meco MT, Moscat J. The activation of p38 and apoptosis by the inhibition of Erk is antagonized by the phosphoinositide 3-kinase/Akt pathway. J Biol Chem. 1998;273(17):10792–10797. doi:10.1074/jbc.273.17.10792
- Tanimura S, Takeda K. ERK signalling as a regulator of cell motility. J Biochem. 2017;162(3):145–154. doi:10.1093/jb/mvx048
- Kerr EM, Gaude E, Turrell FK, Frezza C, Martins CP. Mutant Kras copy number defines metabolic reprogramming and therapeutic susceptibilities. Nature. 2016;531(7592):110–113. doi:10.1038/nature16967
- Saba-El-Leil MK, Frémin C, Meloche S. Redundancy in the world of MAP kinases: all for one. Front Cell Dev Biol. 2016;4:67. doi:10.3389/fcell.2016.00067
- Maik-Rachline G, Hacohen-Lev-Ran A, Seger R. Nuclear ERK: mechanism of translocation, substrates, and role in cancer. Int J Mol Sci. 2019;20:5. doi:10.3390/ijms20051194
- Barbosa R, Acevedo LA, Marmorstein R. The MEK/ERK network as a therapeutic target in human cancer. Mol Cancer Res. 2021;19(3):361–374. doi:10.1158/1541-7786.MCR-20-0687
- Fey D, Matallanas D, Rauch J, Rukhlenko OS, Kholodenko BN. The complexities and versatility of the RAS-to-ERK signalling system in normal and cancer cells. Semin Cell Dev Biol. 2016;58:96–107. doi:10.1016/j.semcdb.2016.06.011
- Zhang Z, Cui F, Cao C, Wang Q, Zou Q. Single-cell RNA analysis reveals the potential risk of organ-specific cell types vulnerable to SARS-CoV-2 infections. Comput Biol Med. 2022;140:105092. doi:10.1016/j.compbiomed.2021.105092
- Tang W, Wan S, Yang Z, Teschendorff AE, Zou Q. Tumor origin detection with tissue-specific miRNA and DNA methylation markers. Bioinformatics. 2018;34(3):398–406. doi:10.1093/bioinformatics/btx622
- Zou Y, Wu H, Guo X, et al. MK-FSVM-SVDD: a multiple kernel-based fuzzy SVM model for predicting DNA-binding proteins via support vector data description. Curr Bioinform. 2021;16(2):274–283. doi:10.2174/2212392XMTA3bMTYiy
- Zhang Y, Huang W, Yuan Y, et al. Long non-coding RNA H19 promotes colorectal cancer metastasis via binding to hnRNPA2B1. J Exp Clin Cancer Res. 2020;39(1):141. doi:10.1186/s13046-020-01619-6
- Chen LC, Liu HP, Li HP, et al. Thymidine phosphorylase mRNA stability and protein levels are increased through ERK-mediated cytoplasmic accumulation of hnRNPK in nasopharyngeal carcinoma cells. Oncogene. 2009;28(17):1904–1915. doi:10.1038/onc.2009.55
- Sui X, Zhang R, Liu S, et al. RSL3 drives ferroptosis through GPX4 inactivation and ROS production in colorectal cancer. Front Pharmacol. 2018;9:1371. doi:10.3389/fphar.2018.01371
- Zhao H, Ming T, Tang S, et al. Wnt signaling in colorectal cancer: pathogenic role and therapeutic target. Mol Cancer. 2022;21(1):144. doi:10.1186/s12943-022-01616-7
- Datta A, Kim H, Lal M, et al. Manumycin A suppresses exosome biogenesis and secretion via targeted inhibition of Ras/Raf/ERK1/2 signaling and hnRNPH1 in castration-resistant prostate cancer cells. Cancer Lett. 2017;408:73–81. doi:10.1016/j.canlet.2017.08.020
- Roth S, Khalaila I. The effect of O-GlcNAcylation on hnRNPA1 translocation and interaction with transportin1. Exp Cell Res. 2017;350(1):210–217. doi:10.1016/j.yexcr.2016.11.023
- Abdrabou A, Wang Z. Regulation of the nuclear speckle localization and function of Rac1. FASEB J. 2021;35(2):e21235. doi:10.1096/fj.202001694R
- Zhang H, Deng T, Liu R, et al. CAF secreted miR-522 suppresses ferroptosis and promotes acquired chemo-resistance in gastric cancer. Mol Cancer. 2020;19(1):43. doi:10.1186/s12943-020-01168-8