
Abstract
Cross-sectional imaging with computed tomography or magnetic resonance imaging is routinely used to detect and diagnose liver lesions; however, these examinations can provide additional important information. The improvement of equipment and techniques has allowed outstanding evaluation of the vascular and biliary anatomy, which is practicable in most routine examinations. Anatomical variants may exclude patients from certain therapeutic options and may be the cause of morbidity or mortality after surgery or interventional procedures. Diffuse liver disease, such as steatosis, hemochromatosis, or fibrosis, must be diagnosed and quantified. Usually these conditions are silent until the late stages, and imaging plays an important role in detecting them early. Additionally, a background of diffuse disease may interfere in a focal lesion systematic reasoning. The diagnostic probability of a particular nodule varies according to the background liver disease. Nowadays, most diffuse liver diseases can be easily and accurately quantified by imaging, which has allowed better understanding of these diseases and improved patient management. Finally, cross-sectional imaging can calculate total and partial liver volumes and estimate the future liver remnant after hepatectomy. This information helps to select patients for portal vein embolization and reduces postoperative complications. Use of a specific hepatic contrast agent on magnetic resonance imaging, in addition to improving detection and characterization of focal lesions, provides functional global and segmental information about the liver parenchyma.
Introduction
Cross-sectional imaging with computed tomography (CT) or magnetic resonance imaging (MRI) is routinely used to detect and diagnose liver lesions. In addition to having this important role, CT and MRI provide a wealth of information that is valuable in the treatment of patients with liver disease. The goal of this review is to describe state-of-the-art advances, or the highest level of development, in CT and MRI, with special attention to recent technical innovations for evaluation of the liver beyond detection and characterization of liver lesions.
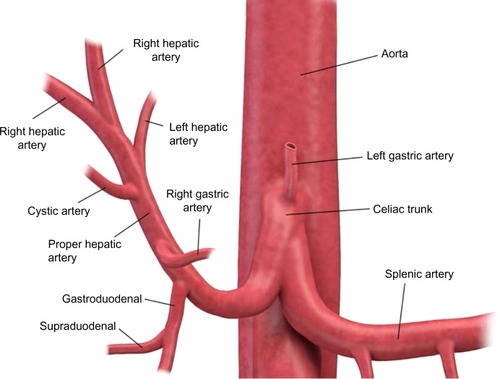
Hepatic vascular and biliary anatomical variants are very common. Classic arterial, portal venous, and hepatic venous anatomy is seen in only 35% of patients. The most common hepatic artery, portal venous, and hepatic vein patterns are seen in 55%–61%, 65%–80%, and 50%–60% of people, respectively ( and ).Citation1–Citation6 Arterial and hepatic venous variants are more frequent, and each one is present in approximately 40%–50% of people. The most common variant of the hepatic veins is the accessory right inferior hepatic vein, which is seen in 47% of people.Citation1,Citation2,Citation6 Portal venous variants are seen in 20%–35% of cases.Citation1–Citation4 Similar to the vascular anatomy, the biliary system has anatomical variants. Normal biliary anatomy is present in approximately 56%–72% of patients. Common biliary variants of intrahepatic biliary ducts include draining of the right posterior duct to the left hepatic duct (12%–19%) or to the common hepatic duct (5%–10%), and trifurcation patterns (9%–11%).Citation2,Citation4,Citation7
Figure 1 Diagram of the portal venous anatomy to the liver.
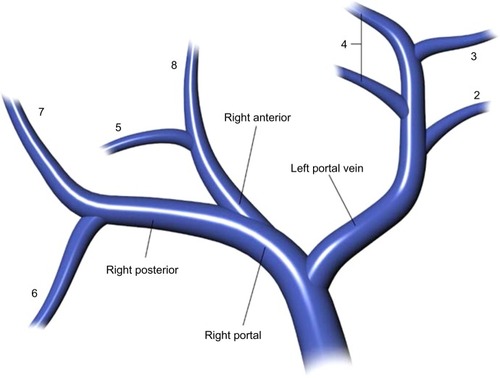
Figure 2 Diagram of the arterial anatomy to the liver.
Presurgical understanding of the vascular and biliary anatomy is essential. For example, when planning a partial hepatectomy, understanding the vascular supply of the remnant liver is required to preserve liver function. In the setting of vascular and biliary reconstruction, knowledge of this anatomy is critical.Citation2,Citation8 Finally, variations in vascular anatomy may result in denial of a life-saving liver transplant. Tsang et al evaluated the reasons for patient exclusion from adult living donor liver transplantation and found that anatomical variations were responsible for exclusion of 10% of potential donors (5% due to biliary system anatomy, 4% due to hepatic artery variations, and 1% due to portal vein alterations).Citation9 Anatomical variants may also affect the delivery of chemotherapy (transarterial chemoembolization), portal vein embolization, and radioembolization (Y-90 transarterial embolization).Citation4
Cross-sectional imaging with CT or MRI can provide information about a patient’s vascular and biliary system at the same time as evaluation of liver lesions; however, it requires appropriate techniques. Some anatomical variants need intravenous contrast agents to be depicted with CT or MRI. Most commonly, iodinated contrast agents are used on CT and gadolinium-based agents on MRI, both working in different ways; the former increases the density where it is present, resulting in a higher attenuation of the X-ray and a brighter point on CT image, and the latter causes a slight increase of the magnetic field adjacent to where it is present and changes the behavior of the closest water molecules, resulting in a brighter point on T1-weighted MRI sequences and a black point in some T2-weighted images. The several contrast agents available for CT and MRI contain different molecules with distinct characteristics, resulting in different behavior. For example, nonionic contrast agents are less allergenic than their ionic counterparts. Intravenous contrast agents have an intravascular, interstitial, and excretory phase. Most contrast agents used for CT and MRI are eliminated only or mainly by the kidneys, but some can also be eliminated via the biliary system, allowing enhancement of the biliary ducts.Citation2,Citation4,Citation6,Citation7
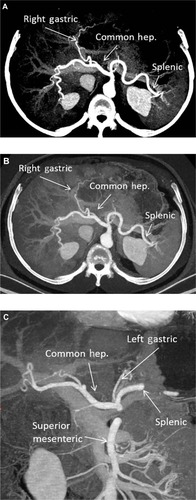
For many years, CT angiography with intravenous contrast has provided excellent images of the arterial and portal vascular system of the liver ().Citation4,Citation6 Recent technical developments in CT include application of dual energy CT (DECT).Citation10 The energy spectra of different materials can be used to obtain specific material images. In the evaluation of vessels, DECT with technical parameters set to iodine material can increase the contrast between the vessel and the background liver (). These CT images, known as iodine-water images, are obtained with low keV (closer to 80 keV) imaging parameters. The lower keV results in increased intensity of iodine relative to other material.
Figure 3 (A) Axial maximum intensity projection image at the level of the celiac artery. The common hepatic (hep.), splenic, and right gastric arteries are identified. (B) Axial “iodine-material” image at the level of the celiac artery. The common hepatic, splenic, and right gastric arteries are identified. (C) Coronal “iodine-material” image at the level of the celiac and superior mesenteric arteries. The common hepatic, left gastric, splenic, and superior mesenteric arteries are identified.
Magnetic resonance (MR) angiography has also played an important role in evaluation of the liver vasculature.Citation4,Citation6 Post-processing techniques, such as subtraction images, provide improved contrast between the vessel and the background liver (). A technique that is seldom used in MRI for evaluation of the liver is phase-contrast imaging (). However, phase-contrast images provide information on the direction of flow and can be very useful for diagnosis of portal hypertension and detection of hepatofugal flow.
Figure 4 (A) Post-gadolinium magnetic resonance axial images of the abdomen below the level of the celiac artery. The common hepatic (hep.), splenic, and right gastric arteries are identified. (B) Post-gadolinium magnetic resonance coronal maximum intensity projection of the abdomen. The common hepatic and splenic arteries are identified. (C) Post-gadolinium magnetic resonance axial maximum intensity projection of the abdomen. The common hepatic and splenic arteries are identified.
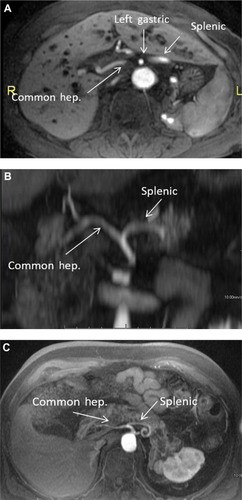
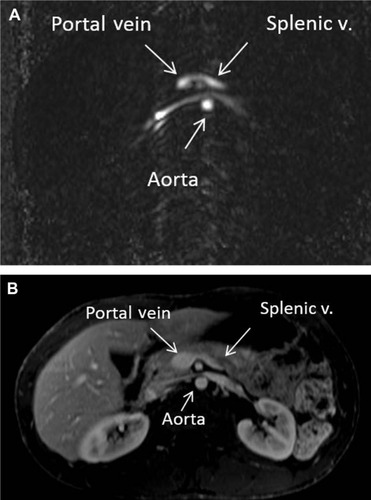
Figure 5 (A) Phase contrast (nongadolinium) magnetic resonance axial images of the abdomen below the level of the celiac artery. The splenic vein (v.) and portal confluence are identified. The bright signal shows normal directional flow of the splenic vein. (B) Post-gadolinium magnetic resonance axial images of the abdomen below the level of the celiac artery. The splenic vein and portal confluence are identified. This corresponds to the anatomy seen in (A).
CT angiography is faster than MR angiography and has higher special resolution; therefore, it is less motion-sensitive and allows better identification of small vessels. MR angiography does not require ionizing radiation and uses a gadolinium-based contrast agent, while CT angiography is performed with ionizing radiation and uses an iodine-based contrast agent, which is more allergenic and is reported to have a transient effect on the kidneys. CT angiography is better for claustrophobic patients and is more cost-effective than MR angiography. Contraindications of MR angiography include pacemakers and some metallic implants.Citation4,Citation6
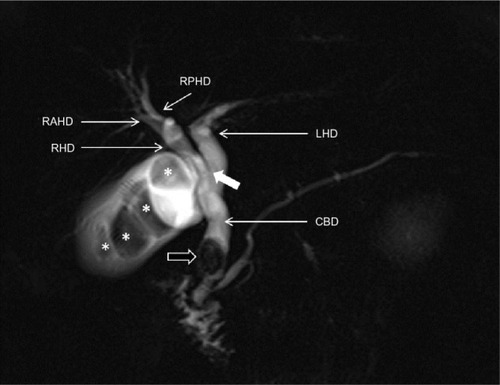
Noninvasive assessment of the biliary tree is possible by CT cholangiography or MR cholangiography (MRCP). CT cholangiography can be performed with or without a biliary-specific contrast agent; however, CT cholangiography with a biliary-specific agent is seldom performed due to technical challenges and the need for ionizing radiation.Citation2,Citation4,Citation7 In CT cholangiography performed using only intravenous iodine contrast agent (ie, without biliary-specific contrast agent), minimum intensity projection reconstruction provides images that accentuate the voxels with the lowest attenuation (ie, water attenuation from bile), which are measured in Hounsfield units (HU, ). These images can be reconstructed using a 10 mm slab thickness, resulting in visualization of the anatomy similar to that of endoscopic retrograde cholangiopancreatography. MRCP yields fluid-sensitive (T2-weighted) images (), and has been used for more than a decade to depict variants in the biliary tree.Citation2,Citation4 For differentiating benign from malignant biliary obstructions, MRCP has a sensitivity of 70%–87%, specificity of 90%–94%, and accuracy of 85%–91%.Citation11 The addition of standard MRI sequences to MRCP increases accuracy and also improves the radiologist’s confidence.Citation12 Recent studies showed similar diagnostic performance for CT cholangiography with minimum intensity projection (sensitivity of 72%–97%, specificity of 85%–95%, and accuracy of 82%–96%).Citation13,Citation14 For detecting choledocholithiasis, MRCP has a sensitivity of 89%–100% and specificity of 83%–100%, CT cholangiography with biliary-specific contrast has a sensitivity of 87%–89% and a sensitivity of 96%–98%, and CT cholangiography with minimum intensity projection has a sensitivity of 70% and specificity of 100%.Citation13–Citation16 MRCP can better detect gallstones than CT cholangiography with biliary-specific contrast (with sensitivity of 94% and 78% and specificity of 88% and 100%, respectively).Citation15
Figure 6 CTCP with minimum intensity projection.
Abbreviation: CTCP, computed tomographic cholangiopancreatography.
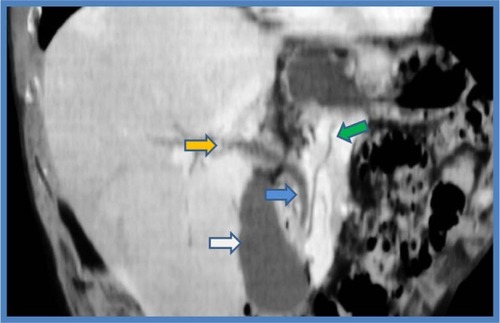
Figure 7 MRCP.
Abbreviations: MRCP, magnetic resonance cholangiopancreatography; MRI, magnetic resonance imaging; CBD, common bile duct; LHD, left hepatic duct; RHD, right hepatic duct; RAHD, right anterior hepatic duct; RPHD, right posterior hepatic duct.
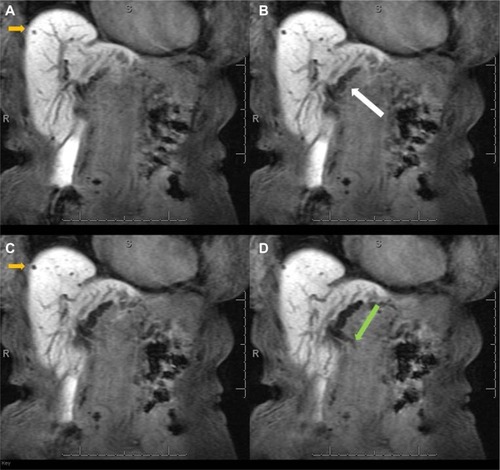
The most recent advances in MRI include novel applications of hepatobiliary agents to visualize the biliary tree.Citation17–Citation19 The use of these agents, ie, gadobenate dimeglumine or gadoxetate dimeglumine, can provide anatomical and functional information about the biliary tree (). An obstruction of the bile ducts will result in nonexcretion of contrast through the bile ducts, and this obstruction may be segmental, subsegmental, or lobar (). Excretion of biliary contrast is dependent on bile duct flow, functional hepatocytes, and renal function.Citation17–Citation19
Figure 8 MRCP with Gd-EOB-DTPA.
Abbreviations: Gd-EOB-DTPA, gadolinium ethoxybenzyl diethylenetriamine pentaacetic acid; MRCP, magnetic resonance cholangiopancreatography.
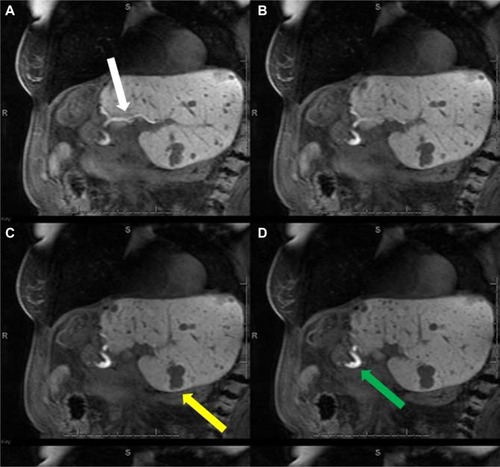
Figure 9 MRCP with Gd-EOB-DTPA.
Abbreviations: Gd-EOB-DTPA, gadolinium ethoxybenzyl diethylenetriamine pentaacetic acid; MRCP, magnetic resonance cholangiopancreatography.
Diffuse liver diseases
Diffuse liver diseases are common and, in most cases, can be identified by cross-sectional imaging. Diffuse liver diseases include a broad spectrum of pathologies, including steatosis, hemochromatosis, fibrosis, and cirrhosis. Imaging can detect some of these diseases before they become clinically apparent. Detection of these diseases has implications with regard to the morbidity and mortality of various treatments for liver disease.Citation20–Citation22 Nowadays, liver biopsy is considered the gold standard for diagnosis and quantification of most diffuse liver diseases, however, it has limitations that will be discussed below. These limitations of biopsy probably compromised the actual known accuracy data of cross-sectional imaging and should be considered when we compare imaging techniques to biopsy.
Fatty liver disease
Fatty liver disease or steatosis is the most common chronic liver disease in the USA, and is characterized by accumulation of triglycerides within the hepatocytes. Its common causes include obesity, alcohol consumption, and drugs.Citation22,Citation23 Fatty liver disease occurs in approximately 30% of the general population, but is more prevalent in obese individuals and in patients with diabetes or metabolic syndrome. There had been a recent unfortunate increase in the incidence of obesity and fatty liver disease in children.Citation23–Citation26 Fatty liver disease can range in severity from simple steatosis to steatohepatitis and cirrhosis, which confers a higher risk of liver failure and hepatocellular carcinoma (HCC).Citation27–Citation29 Adams et al have shown liver disease to be the third cause of death in patients with fatty liver disease, after malignancy and ischemic heart disease, and the increasing prevalence of fatty liver disease underscores the importance of this finding.Citation24 Fatty liver disease has also been associated with 5-fluorouracil, irinotecan, platinum drugs, and taxanes. Other chemotherapeutic agents linked to fatty liver disease are L-asparaginase, dactinomycin, mitomycin C, bleomycin sulfate, and methotrexate.Citation30–Citation32
Liver biopsy is considered in many centers as the reference standard for diagnosis and quantification of fatty liver disease. However, this technique is invasive, may have sampling errors, and requires subjective visual grading, which can result in interobserver variation.Citation22,Citation24,Citation33–Citation36 Thus, liver biopsy is not appropriate for screening, longitudinal monitoring, or evaluation of the treatment response. El-Badry et al showed that quantification of fat on biopsy was strongly observer-dependent, was not reproducible, and did not correlate with computed estimations.Citation33
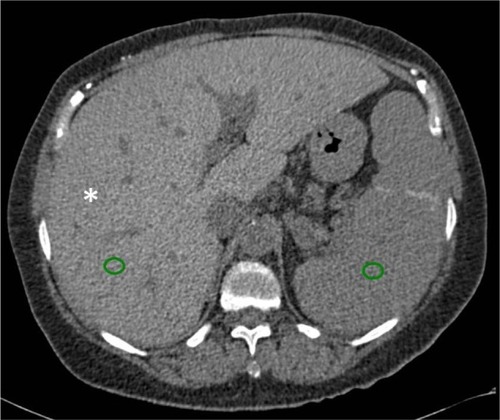
Cross-sectional imaging has an important role in detection and quantification of fatty liver disease and also improves understanding of this condition. On CT, the diagnosis of fatty liver disease can be suggested by evaluating the liver attenuation on nonenhanced images, and this evaluation can be subjective or objective. Non-quantitative subjective analysis of the CT images is done by comparing the visual attenuation of the liver with that of the spleen (attenuation of the liver will be lower than that of the spleen) or comparing the visual attenuation of the liver with that of the hepatic vessels (the vessels will be brighter than the liver, ). This subjective technique has a sensitivity of 88%–95% and a specificity of 90%–99%.Citation35,Citation37–Citation41
Figure 10 CT image of fatty liver disease.
Abbreviations: CT, computed tomography; HU, Hounsfield units.
A quantitative objective analysis of CT images can be performed to assess for steatosis by measuring the hepatic attenuation in HU. Hepatic attenuation below 48 HU is suggestive of liver steatosis.Citation35,Citation41 Kodama et al found associations between hepatic attenuation and fatty liver disease of 64.4 HU ± 3.1 for 0% steatosis, 59.1 HU ± 7.3 for 1%–25% steatosis, 41.9 HU ± 6.7 for 26%–50% steatosis, and 25.0±15.5 for more than 50% steatosis.Citation37 The hepatic attenuation may be compared objectively with the spleen, where a liver-to-spleen attenuation ratio of less than 0.8 represents more than 30% steatosis, with a sensitivity of 73%–82% and specificity of 100%. A coexisting disease that increases liver density, like hemochromatosis, can hinder the effects of fat inside the liver parenchyma and limit the accuracy of CT.Citation38–Citation40 DECT has been used to evaluate steatosis in animal research, in which DECT indexes, especially fat (water) concentration, correlated with histological findings.Citation42
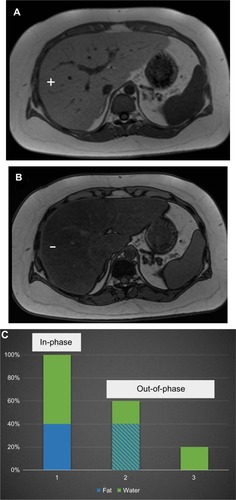
MRI is one of the most sensitive imaging techniques for detecting fatty liver disease. Fat accumulation can be evaluated qualitatively or quantitatively, and the most common technique used is chemical shift imaging. The chemical shift technique provides images of the liver in which the signal intensity of the water and fat are added (in-phase) or subtracted (out-of-phase) from each other. There is a loss of signal intensity on out-of-phase images when fat and water are present in the same voxel ().Citation35,Citation43–Citation45 For example, in a voxel with 40% fat and 60% water, the signal will decrease from 100% (in-phase) to 20% (out-of-phase, ). This technique is limited to 50% fat. In a voxel with 60% fat and 40% water, the signal loss will also be to 20%, because the chemical shift technique does not differentiate which compound (fat or water) is predominating. This quantitative calculation is known as the fat signal fraction (FSF): FSF = (SIP − SOP)/2(SIP), where SIP is the hepatic signal intensity on in-phase images and SOP is the hepatic signal intensity on out-of-phase images.Citation35,Citation43 In a study of 2,349 patients, none had an FSF greater than 50%.Citation26 It is important to mention that MRI evaluates the percentage of fat related to water, while biopsy estimates visually the percentage of hepatocytes with fat, regardless of the amount of fat or its relationship to water.Citation33
Figure 11 MRI of fatty liver disease.
Abbreviations: T1W, T1-weighted; MRI, magnetic resonance image.
An MRI technique that expands on the chemical shift technique is the Dixon method. This technique results in development of in-phase and out-of-phase images in addition to water-only and fat-only images ().Citation46 More recently, modified Dixon methods applied to fast gradient echo techniques have been used for evaluation of fatty liver disease.Citation24,Citation47–Citation52 These new techniques allow correction of the iron overload (see the Iron in the liver section), which is a partial limitation of chemical shift imaging for detection and quantification of fatty liver disease.Citation52
Figure 12 MRI of the abdomen with the Dixon technique.
Abbreviations: T1W, T1-weighted; MRI, magnetic resonance image.
The accuracy of MRI for detection and quantification of fatty liver disease depends on the technique used and also on the reference standard (usually biopsy), which has intrinsic problems as already mentioned. In-phase and out-of-phase MRI techniques have demonstrated high accuracy for detection of fatty liver disease, with a positive correlation coefficient of 0.84 with biopsy grade.Citation43,Citation53,Citation54 However, these techniques have limitations, especially in patients with iron overload and those with cirrhosis (r=0.25).43,55,56 More recent MRI techniques show fat values that are extremely close to the actual fat concentration in phantom models, despite the presence of iron. These techniques have shown a potential minimum error of less than 1% in comparison with the real concentration of fat; this potential for error is smaller than that of the subjective visual pathological scale.Citation24,Citation49–Citation52
MR spectroscopy is the most accurate method for noninvasive evaluation of fatty liver disease. MR spectroscopy quantifies the chemical composition of the hepatic parenchyma, detecting fat quantities as low as 0.5%. However, the acquisition is limited to a localized single voxel, susceptible to field inhomogeneity, time-consuming, and very vulnerable to motion artifacts. This technique is not recommended in routine practice, and is reserved for quantification of small amounts of fat in selected patients.Citation26,Citation35,Citation43
Iron in the liver
There are many causes of iron overload in the liver, which can be classified as primary (hereditary hemochromatosis) or secondary (other causes, especially repeated transfusions). Primary hemochromatosis is characterized by parenchymal iron storage, while secondary causes of iron overload are characterized by reticuloendothelial iron deposits first, and only later, parenchymal iron storage. An excess of iron in the parenchymal cells can lead to cellular toxicity and is a risk factor for cirrhosis and HCC, mainly in primary hemochromatosis. This risk is increased when there are additional hepatic risk factors. The signs and symptoms of iron overload might appear late and be nonspecific, delaying its diagnosis.Citation20,Citation57–Citation62
Hepatic iron magnitude is considered to be the best measure of total body iron burden. There is a close relationship between the level of body iron overload and the presence and severity of organ damage. Patients with iron overload have a reduced life expectancy if not diagnosed and treated before organ damage, which is usually present during the clinical phase of the disease. Life expectancy can be brought back to normal if an early diagnosis is made and treatment is given, so early detection and quantification of liver iron overload is critical, especially before the disease is clinically evident.Citation58,Citation63
Liver biopsy remains the reference standard for the diagnosis and staging of liver iron overload; however, the procedure is invasive, evaluates small samples, and has variable results. This variability ranges from 19% in the healthy liver to 40% in cirrhosis. Further, distribution of iron in the liver may be irregular because of fibrosis.Citation57–Citation59,Citation62–Citation64
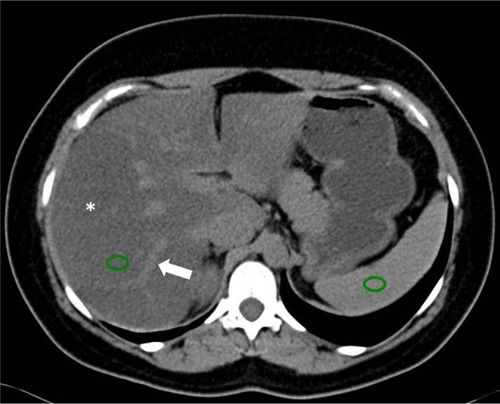
On nonenhanced CT examination, iron overload in the liver may increase the hepatic attenuation (in contrast with steatosis, in which it is reduced, ). With a threshold of 71 HU or more, nonenhanced CT has a sensitivity of 63% and a specificity of 96%. A limitation of nonenhanced CT is that other diffuse liver diseases (eg, Wilson’s disease) may also increase hepatic attenuation, as can long-term administration of amiodarone.Citation60,Citation62 Use of iodine-based contrast does not help in detection of iron in the liver. Finally, there are promising but limited reports on the use of DECT for evaluation of iron in the liver.Citation65
Figure 13 CT image showing liver iron overload.
Abbreviations: CT, computed tomography; HU, Hounsfield units.
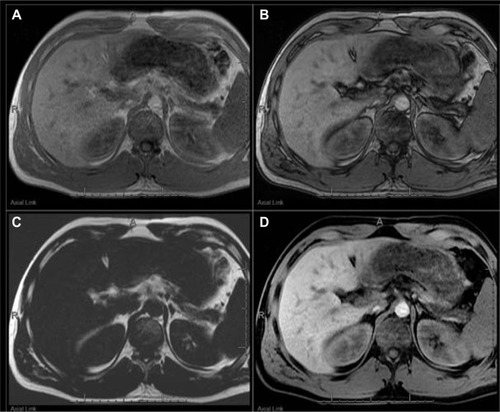
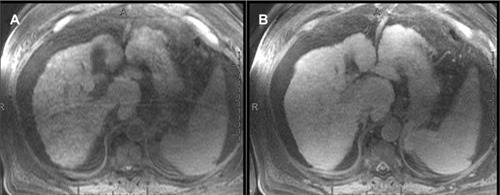
MRI is the best noninvasive method for detecting and quantifying liver iron overload. This may be due to the ferromagnetic properties of iron. The MRI technique is based on loss of signal in the liver on T2* sequences due to susceptibility effects from the iron. A higher iron overload results in greater signal loss. This can be evaluated by visual analysis or may be quantified by different MRI techniques ().Citation52,Citation60–Citation63,Citation66–Citation68 MRI with in-phase and out-of-phase sequences can provide a suggestion of iron overload in the liver. In most systems, the in-phase sequences will have a longer time of echo. This longer time to echo results in signal loss due to iron overload on in-phase images (). This characteristic is in contrast to steatosis, where the out-of-phase image shows the signal loss, although it is due to a different mechanism. It is evident that a combination of steatosis and iron overload can be problematic using in-phase and out-of-phase series.Citation56,Citation62 However, there are more recent and better MRI techniques for iron detection and quantification.Citation52,Citation58,Citation61,Citation63,Citation67–Citation70 Alústiza el al compared two MRI techniques, with an area under the receiver operating characteristic (ROC) curve of 0.887 and 0.958, respectively.Citation66 The results demonstrated different accuracy according to the level of iron overload with a sensitivity and specificity of 86% and 100%, respectively, for iron concentrations ≥85 μmol/g, and of 100% and 81%, respectively, for iron concentrations ≤40 μmol/g.Citation66 MRI can also evaluate iron overload in other organs and confirm the diagnosis of primary hemochromatosis (). The presence of iron overload in the liver and pancreas raises suspicion for primary hemochromatosis. The spleen is not involved in primary hemochromatosis unless the patient has received repeated transfusions.Citation62
Figure 14 MRI showing iron overload.
Abbreviations: MRI, magnetic resonance image; T1W, T1-weighted; TE, time of echo.
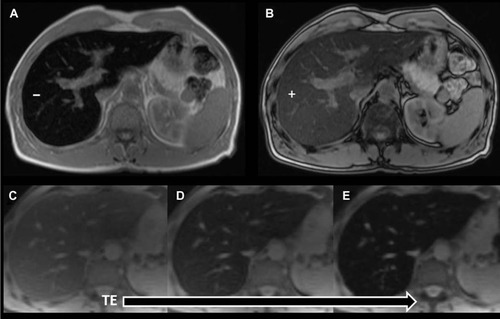
Figure 15 MRI showing iron overload in the liver and pancreas.
Abbreviations: MRI, magnetic resonance image; T1W, T1-weighted.
Fibrosis and cirrhosis
Liver fibrosis is characterized by excess deposits of extracellular matrix, especially collagen, in response to repetitive liver injury from various causes. The main causes of liver fibrosis in the USA are viral infection, nonalcoholic fatty liver disease, and alcohol consumption. There is an increasing incidence of chronic liver disease and of liver fibrosis in the USA. Liver fibrosis tends to progress, leading to hepatic dysfunction, portal hypertension, and ultimately cirrhosis; and cirrhosis is a risk factor for HCC. This progression was once considered to be irreversible; however, it has been shown that liver fibrosis is a dynamic process that can regress or disappear, especially in early cases. Like the other diffuse liver diseases previously discussed, liver fibrosis remains asymptomatic or has mild and nonspecific symptoms over a long period of time, becoming evident later when there is cirrhosis and its complications.Citation21,Citation71–Citation73
Biopsy is the current standard reference for diagnosing and staging liver fibrosis. However, liver biopsy is invasive and expensive, has poor patient acceptance, may have complications, evaluates small samples, and has sampling errors. A difference of at least one stage of fibrosis between the right and left lobe biopsies may be found in 33% of patients with chronic hepatitis C. The staging system for liver fibrosis is subjective and does not precisely measure the amount of fibrosis. Both fibrosis and inflammation have inhomogeneous distributions in the liver. These aspects make biopsy not ideal for screening, monitoring, evaluation of treatment response, or epidemiological research.Citation21,Citation71–Citation74
Use of CT for detection of liver fibrosis is limited to visualization of morphological changes in the liver parenchyma. For example, nodularity of the liver capsule or segmental or lobar atrophy suggests fibrosis ().Citation21,Citation71 Conversely, MRI with hepatobiliary contrast agents can estimate the degree of fibrosis, reflecting loss of hepatocyte function. Liver fibrosis will result in a relative decrease in enhancement of the liver during the hepatobiliary phase (), which is proportional to the degree of fibrosis; however, there is overlap between the stages of fibrosis (area under the ROC curve 0.85, sensitivity 73%, and specificity 87% for F3 and F4 fibrosis).Citation75 Progressive reduction of contrast hepatocyte uptake according to the Child-Pugh classification has also been noted.Citation76 Although the fibrosis-related decrease in contrast enhancement gives information about liver function and fibrosis, it may reduce the diagnostic efficacy of hepatocellular contrast agents.Citation75,Citation77 A recent meta-analysis evaluating the accuracy of MRI with gadoxetate dimeglumine for detection of HCC showed an area under the ROC curve of 0.98 for overall HCC, 0.98 for HCC in patients with cirrhosis, and 0.99 for HCC 2.0 cm or smaller in diameter.Citation78
Figure 16 Axial post-contrast CT image in a patient with cirrhosis.
Abbreviation: CT, computed tomography.
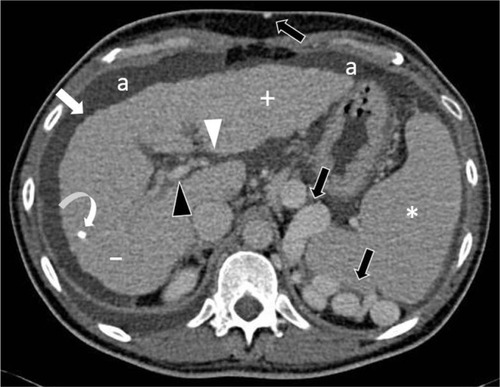
Figure 17 MRIs showing cirrhosis.
Abbreviations: Gd-EOB-DTPA, gadolinium ethoxybenzyl diethylenetriamine pentaacetic acid; MRIs, magnetic resonance images.
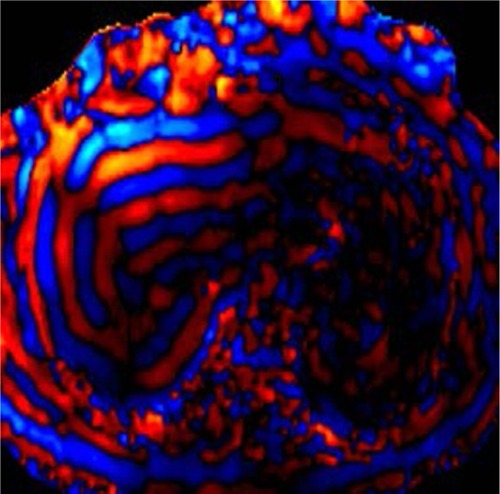
Elastography quantifies the stiffness of a tissue by analyzing the propagation of mechanical waves through it. There are two main imaging methods for measuring stiffness, ie, MR and ultrasound. In MR elastography, a driver device is placed on the abdominal wall adjacent to the liver. This driver device produces mechanical waves that propagate through the hepatic tissue, while images are acquired using gradient echo sequences. The velocity and wavelength of the propagating waves depend on the stiffness of the tissue. Stiffness in the liver increases according to the degree of fibrosis, so liver fibrosis can be quantified (). Liver stiffness is measured in kilopascals (kPa), and normal liver stiffness usually is lower than 2.5 kPa.Citation21,Citation71–Citation73,Citation79–Citation81
Figure 18 MR elastography.
Abbreviation: MR, magnetic resonance.
MR elastography has a high accuracy for differentiating normal or F0 stage livers from those with other fibrous stages (≥F1) and also for differentiating between the stages of fibrosis. Clinically significant fibrosis (≥F2) can be diagnosed with accuracy exceeding 95%, and the differentiation of cirrhosis (F4) from lesser degrees of fibrosis has an accuracy exceeding 98%.Citation74,Citation81–Citation85 Yin et al demonstrated a highly significant correlation (r2=0.94) between MR elastography and the stage of fibrosis, with a sensitivity of 98% and sensitivity of more than 99% for differentiating any stage of liver fibrosis from normal liver tissue, with an area under the ROC curve of 0.99.Citation85 Venkatesh et al reported that MR elastography had a sensitivity of 96%–100%, a specificity of 92–100%, and an area under the ROC curve of 0.98–0.99 for differentiating between the stages of fibrosis.Citation74
Cutoff stiffness values for differentiating normal from fibrotic livers and the stages of fibrosis vary in the literature, possibly due to inclusion of patients with different etiologies of fibrosis in most studies.Citation72,Citation73 In patients with chronic hepatitis B, using a cutoff value of 2.74 kPa for ≥F1, 3.2 kPa for ≥F2, 3.7 kPa for ≥F3, and 4.33 kPa for ≥F4, an area under the ROC curve of 0.98–0.99 was achieved.Citation74 In patients with nonalcoholic fatty liver disease, both steatohepatitis and fibrosis cause an increase in liver stiffness. Patients with isolated fatty liver disease can be differentiated from those with steatohepatitis ± fibrosis with an accuracy of 93% using a cutoff value of 2.74 kPa.Citation86 MR elastography can detect advanced fibrosis (F3–F4) in nonalcoholic fatty liver disease with an accuracy of 95% using a cutoff value of 4.15 kPa, and this information is very important for disease management.Citation87
Focal liver disease, liver volumetry, and liver function
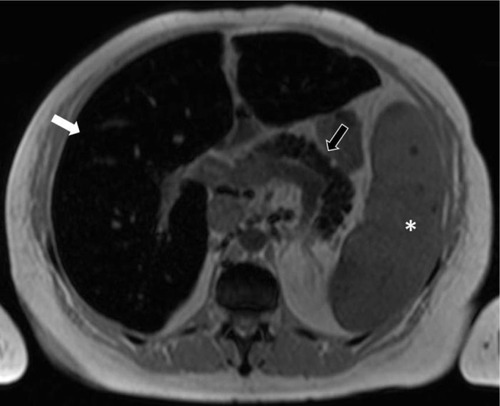
There are multiple focal pathological processes in the liver, besides liver lesions, that will result in decreased uptake of a hepatobiliary contrast agent. These include fat deposition (), iron deposition (), liver fibrosis, chemotherapy-induced fibrosis, and external radiation changes (). These pathologies can be distinguished from an underlying liver lesion by combining the image features of the hepatobiliary images with the other MRI sequences.Citation88–Citation90
Figure 19 MRIs showing focal fat.
Abbreviations: MRIs, magnetic resonance images; T1W, T1-weighted.
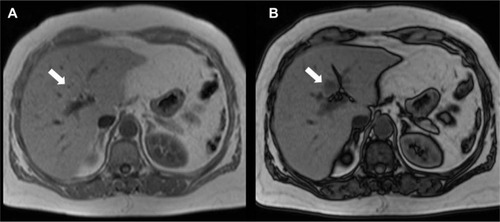
Figure 20 MRI showing focal iron.
Abbreviation: MRI, magnetic resonance image.
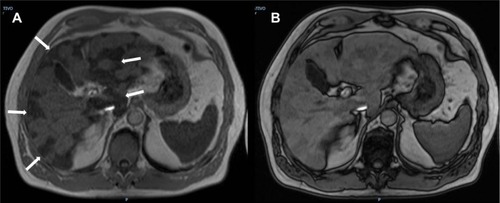
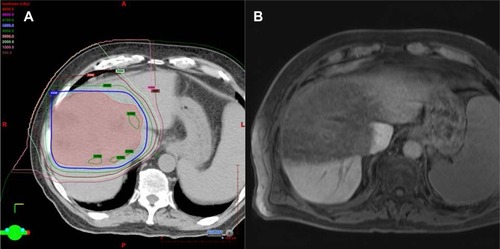
Figure 21 Radiation changes in the liver.
Abbreviation: Gd-EOB-DTPA, gadolinium ethoxybenzyl diethylenetriamine pentaacetic acid.
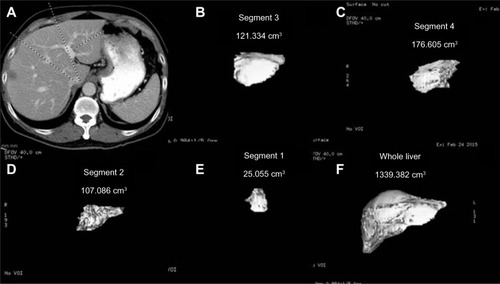
The presence and degree of liver disease has major implications in the setting of surgical management. Estimation of the future liver remnant requires measurement of liver segmental volumes prior to resection. A suboptimal future liver remnant may necessitate portal vein embolization before surgery. Routine post-contrast imaging can be used with the assistance of post-processing software to estimate the segmental liver volumes (). A future liver remnant of less than 20% in a normal liver or less than 40% in a cirrhotic liver increases postsurgical morbidity.Citation8,Citation91,Citation92 Many studies have shown high correlations between cross-sectional volumetry and actual liver volume. For example, in orthotopic liver transplantation, a high correlation was found between manual CT volumetry and liver volume (r=0.96).Citation93 In living donor transplantation, a correlation coefficient of 0.92 was shown using manual CT volumetry.Citation94 For partial hepatectomy, a correlation coefficient of 0.92 was found for MRI and 0.88 for CT using semiautomated software.Citation95
Figure 22 Liver volumetry.
Wibmer et al compared relative liver enhancement during the hepatobiliary phase of preoperative MRI examinations with the risk of liver failure after major liver resection.Citation96 When using the 50-50 criteria for liver failure, the researchers found a lower median relative liver enhancement in patients with postoperative liver failure (54.5%) than in patients without liver failure (125.6%). When the International Study Group of Liver Surgery criteria for liver failure were used, the median relative liver enhancement was 136% in patients without liver failure, 112.5% in those with grade A liver failure, 88.4% in those with grade B liver failure, and 41.7% in those with grade C liver failure. These results suggest a relationship between the degree of enhancement during the hepatobiliary phase of preoperative MRI and the severity of postoperative liver failure.Citation96
Conclusion
CT and MRI are routinely used for detection and characterization of liver lesions. In addition to routine examination, novel techniques such as hepatobiliary contrast agents, DECT, and elastography can provide a wealth of clinically relevant information that will affect disease management and potentially the morbidity and mortality of the therapeutic options used. CT and MRI also have an important role in the evaluation of vascular and biliary variant anatomy, steatosis, iron overload, fibrosis, and liver volumetry. The major challenges of these advanced examinations are standardization of technique, simplification of execution, and widespread dissemination. The combination of novel techniques with current examination techniques can provide a “one-stop shop” that can be completed within the time allotted for the MRI and CT examination.
Disclosure
The authors report no conflicts of interest in this work.
References
- ErbayNRaptopoulosVPomfretEAKamelIRKruskalJBLiving donor liver transplantation in adults: vascular variants important in surgical planning for donors and recipientsAJR Am J Roentgenol2003181110911412818839
- CatalanoOASinghAHUppotRNHahnPFFerroneCRSahaniDVVascular and biliary variants in the liver: implications for liver surgeryRadiographics200828235937818349445
- CoveyAMBrodyLAGetrajdmanGISofocleousCTBrownKTIncidence, patterns, and clinical relevance of variant portal vein anatomyAJR Am J Roentgenol200418341055106415385304
- SinghAKCroninCGVermaHAImaging of preoperative liver transplantation in adults: what radiologists should knowRadiographics20113141017103021768236
- CoveyAMBrodyLAMaluccioMAGetrajdmanGIBrownKTVariant hepatic arterial anatomy revisited: digital subtraction angiography performed in 600 patientsRadiology2002224254254712147854
- SahaniDMehtaABlakeMPrasadSHarrisGSainiSPreoperative hepatic vascular evaluation with CT and MR angiography: implications for surgeryRadiographics20042451367138015371614
- HyodoTKumanoSKushihataFCT and MR cholangiography: advantages and pitfalls in perioperative evaluation of biliary treeBr J Radiol201285101588789622422383
- ShinDSIngrahamCRDigheMKSurgical resection of a malignant liver lesion: what the surgeon wants the radiologist to knowAJR Am J Roentgenol20142031W21W3324951226
- TsangLLChenCLHuangTLPreoperative imaging evaluation of potential living liver donors: reasons for exclusion from donation in adult living donor liver transplantationTransplant Proc20084082460246218929768
- SilvaACMorseBGHaraAKPadenRGHongoNPavlicekWDual-energy (spectral) CT: applications in abdominal imagingRadiographics20113141031104621768237
- ChoiJYKimMJLeeJMMagnetic resonance cholangiography: comparison of two- and three-dimensional sequences for assessment of malignant biliary obstructionEur Radiol2008181788618236046
- KimMJMitchellDGItoKOutwaterEKBiliary dilatation: differentiation of benign from malignant causes – value of adding conventional MR imaging to MR cholangiopancreatographyRadiology2000214117318110644119
- LiBZhangLZhangZYDifferentiation of noncalculous periampullary obstruction: comparison of CT with negative-contrast CT cholangiopancreatography versus MRI with MR cholangiopancreatographyEur Radiol201525239140125249314
- ZhangZYWangDNiJMComparison of three-dimensional negative-contrast CT cholangiopancreatography with three-dimensional MR cholangiopancreatography for the diagnosis of obstructive biliary diseasesEur J Radiol201281583083721377820
- OkadaMFukadaJToyaKItoROhashiTYorozuAThe value of drip infusion cholangiography using multidetector-row helical CT in patients with choledocholithiasisEur Radiol200515102140214515968515
- TakahashiMSaidaYItaiYGunjiNOriiKWatanabeYReevaluation of spiral CT cholangiography: basic considerations and reliability for detecting choledocholithiasis in 80 patientsJ Comput Assist Tomogr200024685986511105701
- BoraschiPDonatiFBiliary-enteric anastomoses: spectrum of findings on Gd-EOB-DTPA-enhanced MR cholangiographyAbdom Imaging20133861351135923820693
- GuptaRTEvaluation of the biliary tree and gallbladder with hepatocellular MR contrast agentsCurr Probl Diagn Radiol2013422677623332139
- LeeNKKimSLeeJWBiliary MR imaging with Gd-EOB-DTPA and its clinical applicationsRadiographics20092961707172419959517
- BaconBRAdamsPCKowdleyKVPowellLWTavillASDiagnosis and management of hemochromatosis: 2011 practice guideline by the American Association for the Study of Liver DiseasesHepatology201154132834321452290
- FariaSCGanesanKMwangiIMR imaging of liver fibrosis: current state of the artRadiographics20092961615163519959511
- VilgrainVRonotMAbdel-RehimMHepatic steatosis: a major trap in liver imagingDiagn Interv Imaging2013947–871372723751229
- AnguloPNonalcoholic fatty liver diseaseN Engl J Med2002346161221123111961152
- AdamsLALympJFSt SauverJThe natural history of nonalcoholic fatty liver disease: a population-based cohort studyGastroenterology2005129111312116012941
- BrowningJDSzczepaniakLSDobbinsRPrevalence of hepatic steatosis in an urban population in the United States: impact of ethnicityHepatology20044061387139515565570
- SzczepaniakLSNurenbergPLeonardDMagnetic resonance spectroscopy to measure hepatic triglyceride content: prevalence of hepatic steatosis in the general populationAm J Physiol Endocrinol Metab20052882E462E46815339742
- HossainNAfendyAStepanovaMIndependent predictors of fibrosis in patients with nonalcoholic fatty liver diseaseClin Gastroenterol Hepatol20097111224122919559819
- YehMMBruntEMPathological features of fatty liver diseaseGastroenterology2014147475476425109884
- El-SeragHBHepatocellular carcinomaN Engl J Med2011365121118112721992124
- ReddySKReillyCZhanMLong-term influence of chemotherapy on steatosis-associated advanced hepatic fibrosisMed Oncol201431697124798875
- SharmaAHoushyarRBhosalePChoiJIGulatiRLallCChemotherapy induced liver abnormalities: an imaging perspectiveClin Mol Hepatol201420331732625320738
- TorrisiJMSchwartzLHGollubMJGinsbergMSBoslGJHricakHCT findings of chemotherapy-induced toxicity: what radiologists need to know about the clinical and radiologic manifestations of chemotherapy toxicityRadiology20112581415621183492
- El-BadryAMBreitensteinSJochumWAssessment of hepatic steatosis by expert pathologists: the end of a gold standardAnn Surg2009250569169719806055
- KleinerDEBruntEMVan NattaMDesign and validation of a histological scoring system for nonalcoholic fatty liver diseaseHepatology20054161313132115915461
- MaXHolalkereNSKambadakoneRAMino-KenudsonMHahnPFSahaniDVImaging-based quantification of hepatic fat: methods and clinical applicationsRadiographics20092951253127719755595
- RatziuVCharlotteFHeurtierASampling variability of liver biopsy in nonalcoholic fatty liver diseaseGastroenterology200512871898190615940625
- KodamaYNgCSWuTTComparison of CT methods for determining the fat content of the liverAJR Am J Roentgenol200718851307131217449775
- LeeSWParkSHKimKWUnenhanced CT for assessment of macrovesicular hepatic steatosis in living liver donors: comparison of visual grading with liver attenuation indexRadiology2007244247948517641368
- LimanondPRamanSSLassmanCMacrovesicular hepatic steatosis in living related liver donors: correlation between CT and histologic findingsRadiology2004230127628014695401
- ParkSHKimPNKimKWMacrovesicular hepatic steatosis in living liver donors: use of CT for quantitative and qualitative assessmentRadiology2006239110511216484355
- YajimaYNaruiTIshiiMComputed tomography in the diagnosis of fatty liver: total lipid content and computed tomography numberTohoku J Exp Med198213633373427071850
- SunTLinXChenKEvaluation of hepatic steatosis using dual-energy CT with MR comparisonFront Biosci (Landmark Ed)2014191377138524896357
- CassidyFHYokooTAganovicLFatty liver disease: MR imaging techniques for the detection and quantification of liver steatosisRadiographics200929123126019168847
- FishbeinMCastroFCherukuSHepatic MRI for fat quantitation: its relationship to fat morphology, diagnosis, and ultrasoundJ Clin Gastroenterol200539761962516000931
- SchuchmannSWeigelCAlbrechtLNon-invasive quantification of hepatic fat fraction by fast 1.0, 1.5 and 3.0 T MR imagingEur J Radiol200762341642217267159
- DixonWTSimple proton spectroscopic imagingRadiology198415311891946089263
- BernardCPLineyGPMantonDJTurnbullLWLangtonCMComparison of fat quantification methods: a phantom study at 3.0TJ Magn Reson Imaging200827119219718064714
- KimHTaksaliSEDufourSComparative MR study of hepatic fat quantification using single-voxel proton spectroscopy, two-point dixon and three-point IDEALMagn Reson Med200859352152718306404
- LiuCYMcKenzieCAYuHBrittainJHReederSBFat quantification with IDEAL gradient echo imaging: correction of bias from T(1) and noiseMagn Reson Med200758235436417654578
- ReederSBMcKenzieCAPinedaARWater-fat separation with IDEAL gradient-echo imagingJ Magn Reson Imaging200725364465217326087
- ReederSBPinedaARWenZIterative decomposition of water and fat with echo asymmetry and least-squares estimation (IDEAL): application with fast spin-echo imagingMagn Reson Med200554363664416092103
- YuHMcKenzieCAShimakawaAMultiecho reconstruction for simultaneous water-fat decomposition and T2* estimationJ Magn Reson Imaging20072641153116117896369
- MitchellDGKimIChangTSFatty liver. Chemical shift phase-difference and suppression magnetic resonance imaging techniques in animals, phantoms, and humansInvest Radiol19912612104110521765436
- RinellaMEMcCarthyRThakrarKDual-echo, chemical shift gradient-echo magnetic resonance imaging to quantify hepatic steatosis: implications for living liver donationLiver Transpl20039885185612884199
- QayyumAGohJSKakarSYehBMMerrimanRBCoakleyFVAccuracy of liver fat quantification at MR imaging: comparison of out-of-phase gradient-echo and fat-saturated fast spin-echo techniques – initial experienceRadiology2005237250751116244259
- WestphalenACQayyumAYehBMLiver fat: effect of hepatic iron deposition on evaluation with opposed-phase MR imagingRadiology2007242245045517255416
- AdamsPBrissotPPowellLWEASL International Consensus Conference on HaemochromatosisJ Hepatol200033348550411020008
- AlustizaJMCastiellaADe JuanMDEmparanzaJIArtetxeJUrangaMIron overload in the liver diagnostic and quantificationEur J Radiol200761349950617166681
- AndrewsNCDisorders of iron metabolismN Engl J Med1999341261986199510607817
- GandonYOlivieDGuyaderDNon-invasive assessment of hepatic iron stores by MRILancet2004363940635736215070565
- KuhnJPHernandoDMunoz del RioAEffect of multipeak spectral modeling of fat for liver iron and fat quantification: correlation of biopsy with MR imaging resultsRadiology2012265113314222923718
- Queiroz-AndradeMBlasbalgROrtegaCDMR imaging findings of iron overloadRadiographics20092961575158919959509
- St PierreTGClarkPRChua-anusornWNoninvasive measurement and imaging of liver iron concentrations using proton magnetic resonanceBlood2005105285586115256427
- VilleneuveJPBilodeauMLepageRCoteJLefebvreMVariability in hepatic iron concentration measurement from needle-biopsy specimensJ Hepatol19962521721778878778
- JoeEKimSHLeeKBFeasibility and accuracy of dual-source dual-energy CT for noninvasive determination of hepatic iron accumulationRadiology2012262112613522106352
- AlustizaJMArtetxeJCastiellaAMR quantification of hepatic iron concentrationRadiology2004230247948414668426
- HankinsJSMcCarvilleMBLoefflerRBR2* magnetic resonance imaging of the liver in patients with iron overloadBlood2009113204853485519264677
- WoodJCEnriquezCGhugreNMRI R2 and R2* mapping accurately estimates hepatic iron concentration in transfusion-dependent thalassemia and sickle cell disease patientsBlood200510641460146515860670
- AndersonLJHoldenSDavisBCardiovascular T2-star (T2*) magnetic resonance for the early diagnosis of myocardial iron overloadEur Heart J200122232171217911913479
- St PierreTGEl-BeshlawyAElalfyMMulticenter validation of spin-density projection-assisted R2-MRI for the noninvasive measurement of liver iron concentrationMagn Reson Med20147162215222323821350
- VenkateshSKEhmanRLMagnetic resonance elastography of liverMagn Reson Imaging Clin N Am201422343344625086938
- VenkateshSKYinMEhmanRLMagnetic resonance elastography of liver: technique, analysis, and clinical applicationsJ Magn Reson Imaging201337354455523423795
- VenkateshSKYinMEhmanRLMagnetic resonance elastography of liver: clinical applicationsJ Comput Assist Tomogr201337688789624270110
- VenkateshSKWangGLimSGWeeAMagnetic resonance elastography for the detection and staging of liver fibrosis in chronic hepatitis BEur Radiol2014241707823928932
- FeierDBalassyCBastatiNStiftJBadeaRBa-SsalamahALiver fibrosis: histopathologic and biochemical influences on diagnostic efficacy of hepatobiliary contrast-enhanced MR imaging in stagingRadiology2013269246046823878281
- HaimerlMVerlohNZemanFAssessment of clinical signs of liver cirrhosis using T1 mapping on Gd-EOB-DTPA-enhanced 3T MRIPLoS One2013812e8565824392025
- VerlohNHaimerlMRennertJImpact of liver cirrhosis on liver enhancement at Gd-EOB-DTPA enhanced MRI at 3 TeslaEur J Radiol201382101710171523806531
- LiuXZouLLiuFZhouYSongBGadoxetic acid disodium-enhanced magnetic resonance imaging for the detection of hepatocellular carcinoma: a meta-analysisPLoS One201388e7089623967130
- BensamounSFWangLRobertLCharleuxFLatriveJPHo Ba ThoMCMeasurement of liver stiffness with two imaging techniques: magnetic resonance elastography and ultrasound elastometryJ Magn Reson Imaging20082851287129218972339
- HuwartLSempouxCVicautEMagnetic resonance elastography for the noninvasive staging of liver fibrosisGastroenterology20081351324018471441
- KimBHLeeJMLeeYJMR elastography for noninvasive assessment of hepatic fibrosis: experience from a tertiary center in AsiaJ Magn Reson Imaging20113451110111621932355
- HuwartLSalamehNter BeekLMR elastography of liver fibrosis: preliminary results comparing spin-echo and echo-planar imagingEur Radiol200818112535254118504591
- HuwartLSempouxCSalamehNLiver fibrosis: noninvasive assessment with MR elastography versus aspartate aminotransferase-to-platelet ratio indexRadiology2007245245846617940304
- IchikawaSMotosugiUIchikawaTMagnetic resonance elastography for staging liver fibrosis in chronic hepatitis CMagn Reson Med2012114291297
- YinMTalwalkarJAGlaserKJAssessment of hepatic fibrosis with magnetic resonance elastographyClin Gastroenterol Hepatol20075101207121317916548
- ChenJTalwalkarJAYinMGlaserKJSandersonSOEhmanRLEarly detection of nonalcoholic steatohepatitis in patients with nonalcoholic fatty liver disease by using MR elastographyRadiology2011259374975621460032
- KimDKimWRTalwalkarJAKimHJEhmanRLAdvanced fibrosis in nonalcoholic fatty liver disease: noninvasive assessment with MR elastographyRadiology2013268241141923564711
- GoodwinMDDobsonJESirlinCBLimBGStellaDLDiagnostic challenges and pitfalls in MR imaging with hepatocyte-specific contrast agentsRadiographics20113161547156821997981
- SanukiNTakedaAOkuYThreshold doses for focal liver reaction after stereotactic ablative body radiation therapy for small hepatocellular carcinoma depend on liver function: evaluation on magnetic resonance imaging with Gd-EOB-DTPAInt J Radiat Oncol Biol Phys201488230631124411601
- YeomSKByunJHKimHJFocal fat deposition at liver MRI with gadobenate dimeglumine and gadoxetic acid: quantitative and qualitative analysisJ Magn Reson Imaging2013316911917
- D’OnofrioMDe RobertisRDemozziECrosaraSCanestriniSPozzi MucelliRLiver volumetry: is imaging reliable? Personal experience and review of the literatureWorld J Radiol201464627124778768
- GuglielmiARuzzenenteAConciSValdegamberiAIaconoCHow much remnant is enough in liver resection?Dig Surg201229161722441614
- LucianiARuskoLBaranesLAutomated liver volumetry in orthotopic liver transplantation using multiphase acquisitions on MDCTAJR Am J Roentgenol20121986W568W57422623572
- WeiLZhuZJLuYApplication of computer-assisted three-dimensional quantitative assessment and a surgical planning tool for living donor liver transplantationChin Med J201312671288129123557560
- KarloCReinerCSStolzmannPCT- and MRI-based volumetry of resected liver specimen: comparison to intraoperative volume and weight measurements and calculation of conversion factorsEur J Radiol2010751e107e11119782490
- WibmerAPrusaAMNolzRGruenbergerTSchindlMBa-SsalamahALiver failure after major liver resection: risk assessment by using preoperative gadoxetic acid-enhanced 3-T MR imagingRadiology2013269377778623942606