
Abstract
Purpose
Chronic inflammation contributes to tumor initiation, progression, and immune escape. Neutrophils are the major component of inflammatory response and participate in the tumorigenesis process. However, compared to other immune cells in the tumor microenvironment of laryngeal squamous cell carcinoma (LSCC), neutrophils, especially the tumor-associated neutrophils (TANs), have not yet been comprehensively explored. The mechanism for regulating the crosstalk between TANs and tumor cells still remains unclear.
Materials and Methods
The distribution profiles and phenotypic features of neutrophils and other inflammatory immune cell populations from a large LSCC patient cohort were systemically analyzed. Co-culturing of peripheral blood associated neutrophils (PANs) and TANs with PBMCs was performed, and the immunosuppression effect on T-cells was examined.
Results
LSCC microenvironment is highly inflammatory with remarkable TANs infiltration, which is often associated with unfavorable prognosis and advanced clinical stage. We find that TANs in LSCC display morphologically immature and lower apoptosis, exhibit distinctively immunosuppressive phenotype of high PD-L1, and suppress CD8+ T lymphocytes proliferation and activation. We subsequently discover that PD-L1+TANs induced by LSCC-derived GM-CSF potently impair CD8+ T-cells proliferation and cytokines production function, which are partially blocked by a PD-L1-neutralizing antibody. Clinical data further support GM-CSF as an unfavorable prognostic biomarker and reveal a potential association with inflammatory immune cell infiltration, in particular neutrophils.
Conclusion
Tumor-infiltrating PD-L1+ neutrophils induced by LSCC-derived GM-CSF suppress T cell proliferation and activation in the inflammatory microenvironment of LSCC and predict unfavorable prognosis. These TANs cripple antitumor T cell immunity and promote tumor progression. Our findings provide a basis for targeting PD-L1+TANs or GM-CSF as a new immunotherapeutic strategy for LSCC.
Introduction
Laryngeal squamous cell carcinoma (LSCC) represents one of the most common head and neck malignant tumors. According to the latest published global cancer statistics in 2018 by the International Agency for Research on Cancer, the morbidity and mortality of laryngeal cancer approximately accounted for 1.0% of all cancers.Citation1 In China, it was estimated that there were 26,400 new cases of laryngeal cancers and 14,500 cancer-related deaths in 2015.Citation2 Despite continuous improvements in surgery, radiotherapy, chemotherapy and other multimodality treatments, the 5-year survival rate of laryngeal cancer remains unsatisfactory low from 1975 to 2015 (National Cancer Institute. SEER Stat Fact Sheets: Larynx Cancer. Available from: https://seer.cancer.gov/statfacts/html/laryn.html).
The immune-checkpoint inhibitors (ICIs) exempted by anti-PD-1/PD-L1 mAbs are being used for the treatment of head and neck squamous cell carcinoma (HNSC), kidney carcinoma, melanoma, lung cancer, gastric cancer and hepatocellular carcinoma.Citation3 However, the objective response rates to anti-PD-1 and anti-PD-L1 immunotherapies remain largely refractory. The complete response and partial response rates of PD-1 blocking agents for patients with recurrent or metastatic HNSC progressing after platinum-based chemotherapy are 5% and 11%, respectively.Citation4 The curative effect of ICIs differs greatly in various tumors and patients partly due to tumor mutation burdens and other individual patient variations, such as tumor microenvironment (TME). TME can be stratified into different types based on tumor-infiltrating lymphocytes and the expression of PD-L1.Citation5 Accurate evaluation and effective modulation of TME can be key to reverse the tumor immune escape and to improve the immunotherapeutic effect of solid tumors such as laryngeal cancer.
As the most abundant inflammatory immune cell population, neutrophils are vital first-line defenders of pathogen and microbial infection in the innate immune response. Recent evidence indicates that neutrophils are also participated in the adaptive immune response and are involved in the tumor initiation and progression.Citation6 Tumor-associated neutrophils (TANs), infiltrating in the TME, are manipulated into N1 (anti-tumor) and N2 (pro-tumor) subtypes in tumor progression and clinical course. In non-small cell lung cancer,Citation7 gastric cancer,Citation8 hepatocellular carcinoma,Citation9 pancreatic ductal adenocarcinoma,Citation10 head and neck cancerCitation11 and other solid tumors, elevated peripheral blood associated neutrophils (PANs) and TANs are correlated with poor prognostic survival. In squamous cell carcinoma of the larynx and oropharynx, enhanced density of LOX-1+ TANs in the intratumoral hotspots were significantly associated with poor survival of patients.Citation12 However, the detailed infiltration pattern, phenotypic characteristic and clinical relevance of TANs in LSCC require further investigation.
We recently reported that neutrophil infiltration mediated by chemokine CXCL5 accumulation in the inflammatory TME of LSCC significantly inhibited T cell proliferation and lowered IFN-γ and TNF-α secretion.Citation13 In this study, we firstly reveal the infiltration pattern, the potential prognostic value, the phenotype characteristics and function roles of TANs from a large LSCC patient cohort. We discover that inflammatory LSCC microenvironment is highly infiltrated with neutrophils (TANs). Higher TANs within the peritumor stroma region predict unfavorable prognosis. TANs exhibit morphologically heterogeneous, prolonged lifespan and high expression of PD-L1. They display high anti-apoptosis activities and suppress T lymphocyte proliferation and activation. We furthermore demonstrate that inflammatory cytokine GM-CSF mainly derived from LSCC tumor cells plays an important role in up-regulating PD-L1 on TANs, which subsequently more potently impair CD8+ T-cells proliferation and cytokines production function. Our findings provide evidence that new LSCC immunotherapeutic strategies could be developed targeting PD-L1+TANs or GM-CSF.
Materials and Methods
Study Participants and Specimens
The study enrolled two independent cohorts of LSCC patients with histologically confirmed diagnosis in the Department of Otolaryngology at Eye, Ear, Nose and Throat Hospital, Fudan University. The first cohort comprised 80 LSCC patients undergoing open laryngectomy between September 2013 and August 2015. These tumor tissues and matched normal mucosa tissues were analyzed for the following tissue microarray immunohistochemistry. The detailed clinicopathological features of 45 LSCC cases with effective follow-up were demonstrated in Table S1. In the second cohort, peripheral blood (n = 76), tumor tissue (n = 65) and normal mucosa tissue (n = 61) from LSCC patients were collected between September 2017 and November 2018. Blood samples from gender- and age-matched healthy donors (n = 50) were enrolled as controls. These blood and tissue specimens were performed for flow cytometric analysis and additional functional studies. The clinical characteristics of LSCC patients and healthy controls were shown in Table S2. This study was approved by the Ethics Boards of Eye, Ear, Nose and Throat Hospital, Fudan University, Shanghai, China (NO. KJ2008-01), and conducted in line with the principles of the Declaration of Helsinki. All subjects participated in the study with informed consents and complete clinical data.
Immunohistochemistry (IHC) Staining of Tissue Microarray
Formalin-fixed and paraffin-embedded tumor tissues and matched normal mucosa tissues from the first LSCC patient cohort mentioned above were prepared for tissue microarray (TMA) construction as previously described.Citation14 The TMA slides were incubated overnight at 4°C in wet box, with primary mouse anti-human CD45 antibody (60,287, Clone 4E9B2, Proteintech, Rosemont, USA), mouse anti-human CD66b antibody (392,902, Clone 6/40c, Biolegend, San Diego, USA) or rabbit polyclonal anti-human GM-CSF antibody (ab9741, Abcam, Cambridge, USA), followed with the incubation of biotin-conjugated secondary goat anti-mouse/rabbit IgG antibody at room temperature for one hour. Three high-power fields (HPF, 400×) of intratumoral, peritumoral, epithelium and sub-epithelium regions per sample were randomly chosen to measure the yellow- or brown-membranous stained positive cells.
Flow Cytometric Analysis of Peripheral Blood and Tissues
Whole peripheral blood samples were centrifuged at 3000 rpm for 10 mins to collect plasma, and the remaining blood cells were lysed with RBC lysis buffer (004300, eBioscience, San Diego, USA) at room temperature for 5 mins. Freshly resected LSCC tumor tissues and normal mucosa tissues were firstly washed with normal saline solution containing lincomycin (10%) and gentamicin (10%). The tissues were then physically dissociated into small fragments and subsequently enzymatically digested in RPMI-1640 comprising type I collagenase (C0130, Sigma, St. Louis, USA) and DNase I (D4527, Sigma, St. Louis, USA) at 37°C for 30 mins according to previously reported tissue digestion methods.Citation15 To obtain single-cell suspension, the digested tissue homogenates were passed through 70μm cell strainers and mechanically lapping with the plunger of a 1-mL syringe. After RBC lysis described above, cells from tissue samples as well as the leukocytes were washed with PBS buffer, and subsequently resuspended in 1 mL diluted Zombie UVTM solution (423,108, Biolegend, San Diego, USA) at room temperature for 30 mins. After dark incubation, cells were washed with cell staining buffer (420,201, Biolegend, San Diego, USA), and then incubated with Fc receptor blocking solution (422,302, Biolegend, San Diego, USA) in dark, room temperature for 10 mins. For flow cytometry, cell suspensions from human peripheral blood and tissue samples were stained with following antibodies cocktail at 4°C for 40 mins: Percp-CyTM5.5 mouse anti-human CD45 (564,105, Clone HI30, BD PharmingenTM, San Diego, USA), BV510 mouse anti-human CD3 (564,713, Clone HIT3α, BD PharmingenTM, San Diego, USA), APC-R700 mouse anti-human CD4 (564,975, Clone RPA-T4, BD PharmingenTM, San Diego, USA), APC-CyTM7 mouse anti-human CD8 (557,834, Clone SK1, BD PharmingenTM, San Diego, USA), PE mouse anti-human TCR γδ (555,717, Clone B1, BD PharmingenTM, San Diego, USA), Alexa Fluor® 647 mouse anti-human CD66b (561,645, Clone G10F5, BD PharmingenTM, San Diego, USA), BV421 mouse anti-human PD-1 (564,323, Clone MIH4, BD HorizonTM, San Diego, USA), PE-CyTM7 mouse anti-human CD274 (558,017, Clone MIH1, BD PharmingenTM, San Diego, USA). Stained cells were acquired by BD LSRFortessaTMX-20 (BD Biosciences, San Jose, USA) and analyzed with FlowJo X software (TreeStar, Ashland, USA).
Neutrophil Isolation, Cell Morphology and Survival
PANs and TANs were isolated with EasySepTM human whole blood CD66b positive selection kit (18,682, StemCell Technologies, Vancouver, Canada) according to the manufacturer’s instructions. Further isolation of PD-L1+ neutrophils was performed by incubating cells with PE-conjugated anti-human PD-L1 (329,706, Clone 29E.2A3, Biolegend, San Diego, USA) followed by incubation with EasySepTM release human PE positive selection kit (17,654, StemCell Technologies, Vancouver, Canada). PANs and TANs were smeared on glass slides, and then fixed and Giemsa stained to observe cell morphologic characterization. Apoptosis of TANs or PANs with different treatment subgroups was determined by Annexin V/PI kit (556,547, BD Biosciences, San Jose, USA). Neutrophils were stained with FITC Annexin V at room temperature for 15 min in the dark. PI was subsequently added. Cells were analyzed by flow cytometry BD Bioscience CantoII (BD Biosciences, San Jose, USA).
Neutrophil Polarization
Freshly resected LSCC tumor tissues and normal mucosa tissues were washed with antibiotics as above, cut into the same size of 1 cm × 1 cm × 0.2 cm and then physically dissociated into small fragments and subsequently cultured in 1 mL RPMI-1640 medium per well in 24-well plate at 37°C. LSCC cell line AMC-HN-8 (5 × 10⁶ per well) were cultured in 2 mL RPMI-1640 medium per well in 6-well plate at 37°C. After 24-hour culture, tissue suspension or cellular supernatant was collected to generate tumor tissue conditional culture supernatant (TCCS), non-tumor tissue conditional culture supernatant (NTCCS) and AMC-HN-8 conditional medium (AMC-HN-8 CM) following centrifugation at 3000 rpm for 10 mins. Following isolation by positive selection of marker CD66b as above, PANs from LSCC patients were plated in 96-well plates at a final concentration of 106/mL per well. TCCS, NTCCS, AMC-HN-8 CM, GM-CSF (500ng/mL, 300–03, PeproTech, Rocky Hill, USA), G-CSF (500ng/mL, 300–23, PeproTech, Rocky Hill, USA) and TGF-β1 (500ng/mL, 100–21, PeproTech, Rocky Hill, USA) were then added, respectively, as 50% of the total volume. Polarized PANs harvested after 16-hour culture at 37°C were then stained with PE-CyTM7 mouse anti-human PD-L1 (558,017, Clone MIH1, BD PharmingenTM, San Diego, USA) and used in functional assays.
Lymphocytes Proliferation Assay
Peripheral blood mononuclear cells (PBMCs) were isolated by density gradient centrifugation with LymphorepTM (7851, StemCell Technologies, Vancouver, Canada). PBMCs were labeled with CFSE (1: 1000 in PBS, CellTraceTM Violet Cell Proliferation Kit, C34571, Invitrogen™, Carlsbad, USA) and co-cultured with isolated neutrophils from different groups at the ratio of 1:0, 1:0.5, and 1:1 in complete media containing LEAF™ purified anti-human CD3/CD28 antibody (300,314, 302,914, Biolegend, San Diego, USA) at 37°C. CFSE intensity was measured via flow cytometry after 3-day coculture to assess T-cell proliferation.
Enzyme-Linked Immunosorbent Assay (ELISA)
Commercial ELISA kits GM-CSF (70-EK1632, MultiSciences, Hangzhou, China), G-CSF (70-EK1692, MultiSciences, Hangzhou, China) and TGF-β1 (70-EK1812, MultiSciences, Hangzhou, China) were performed to assess the cytokines concentrations in the plasma of healthy controls and LSCC patients, and tissue supernatant of TCCS and NTCCS according to the manufacturers’ instructions. TNF-α and INF-γ release in culture supernatants of lymphocytes proliferation assay were detected by ELISA kits (70-EK1821, 70-EK1801, MultiSciences, Hangzhou, China).
Bioinformatic Analysis and Publicly Available Database Analysis
The bioinformatic analyses were mainly performed using R software (Version 3.6.3). We compared the differential mRNA expression of GM-CSF (CSF2) between tumor tissues and adjacent normal tissues for different tumor types in TCGA database using web server TIMER (Tumor immune estimation resource, http://timer.comp-genomics.org/). Violin plots and scatter plots were displayed to compare the CSF2 expression level between unpaired (tumor: 502 cases, normal: 44 cases) and paired (tumor: 43 cases, normal: 43 cases) tumor and normal tissues in HNSC patients from TCGA cohort using ggplot2 package. The prognostic value of CSF2 mRNA level in HNSC patients from TCGA database was analyzed with Kaplan–Meier method and Log rank test using survminer package. Stat package was performed to obtain all genes positively and negatively correlated with high- and low-CSF2 expression groups. Heatmap plot was created to show an overview of the top 50 genes positively associated with CSF2 using pheatmap package. Further functional enrichment analysis (Fold change >2, p < 0.05) including Gene Ontology Biological Processes (BP), KEGG pathways and Gene Set Enrichment Analysis (GSEA) (FDR < 0.25, p < 0.05) were performed on the top 300 genes profile most positively associated with CSF2 using clusterProfiler package. GSVA package was performed to explore the correlations between CSF2 expression and different immune cells infiltration level.
Statistics
SPSS Version 22.0 (IBM SPSS Software, Armonk, USA) was applied for the data statistics and analysis. Kaplan–Meier method and Log rank test were applied to calculate and compare the survival rates of different groups. The statistical results of the measurement data were expressed as the mean ± standard deviation or median. Student’s t-test or Mann–Whitney U-test was performed to analyze the statistical significance of differences between groups, as appropriate. A p value of less than 0.05 was considered statistically significant. Statistically differences were defined significantly at four levels: ns = p > 0.05, *p < 0.05, **p < 0.01, ***p < 0.001.
Results
TANs in Peritumoral Region Predict Unfavorable Prognosis in LSCC
IHC staining was conducted to detect the infiltration of CD45+ leukocytes and CD66b+ TANs in the tumor tissues and normal tissues from the LSCC TMA mentioned above. Further analysis was performed to explore the relationship between the TANs infiltration and clinical characteristics of LSCC patients, as well as its correlation with the survival prognosis.
Compared with the adjacent normal tissues, the tumor tissues demonstrated substantially increased infiltration of CD45+ leukocytes, thereby indicating an inflammatory microenvironment in LSCC (). Importantly, the infiltration of TANs in LSCC tumor tissues was significantly increased compared to normal tissues (p < 0.001, and ). In total, 63, 66, 33 and 67 cases of intratumoral, peritumoral, epithelium and sub-epithelium tissues were included for further analysis of TANs distribution. Compared with the intratumoral region, TANs in the peritumoral region of tumor tissues were significantly higher (p = 0.003, and ). However, there was no statistically significant difference between the TANs in the epithelium and sub-epithelium region of normal tissues (p > 0.05, ). We further tested the correlation between the TANs infiltration and the clinical features in 45 LSCC cases with effective follow-up (Table S1). The analysis revealed that LSCC patients with advanced stage (T3-T4) had more intratumoral (p = 0.035, ) and peritumoral (p = 0.017, ) infiltrated TANs than earlier stage tissues (T2).
Figure 1 CD66b+ neutrophils were predominantly located within the peritumoral stroma region in LSCC patients, which were associated with poorer prognosis. (A) Representative images were shown for CD45 and CD66b IHC staining of tumor tissues and normal tissues from LSCC patients. (B) Representative LSCC tumor tissues exhibited various density of CD66b+ neutrophils in peritumoral stroma and intratumoral regions. Bars = 50μm. (C) Infiltrating CD66b+ neutrophils in intratumoral and peritumoral region of tumor tissue, and epithelium and sub-epithelium region of normal tissues were analyzed. (D and E) LSCC patients with advanced T stage had more intratumoral and peritumoral infiltrated CD66b+ neutrophils. (F–I) Kaplan–Meier curves for overall survival and disease-free survival of 45 LSCC patients according to different density of CD66b+ neutrophils infiltrated in peritumoral stroma and intratumoral regions of tumor tissues. 50X, 200X, 400X: magnification of 50, 200, and 400 fold; *p < 0.05, **p < 0.01, ***p < 0.001.
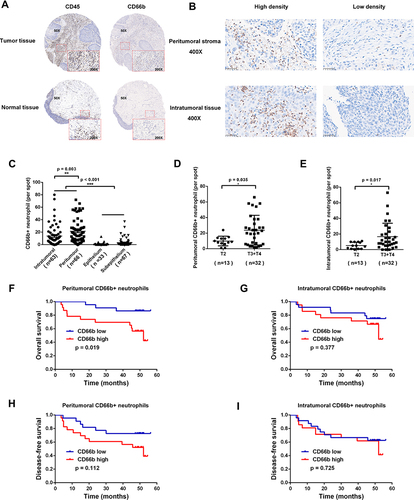
The median numbers of TANs in intratumoral and peritumoral region in LSCC tissues were 14 and 9 per HPF, respectively. These numbers were used to categorize LSCC patients into two TAN infiltration groups: high and low. LSCC patients with more infiltrated TANs in the peritumoral region of tumor tissue were associated with a poorer prognosis of lower overall survival (p = 0.019, ), whereas TANs infiltration in the intratumoral region had no statistically significant correlation with the survival prognosis (p > 0.05, ). TANs infiltration was not closely related to disease-free survival neither in the peritumoral region nor intratumoral region of tumor tissue (p > 0.05, ).
TANs Dominate the Immune Cell Composition in the Inflammatory Tumor Microenvironment of LSCC Patients
We performed flow cytometric analysis to identify the immune cell populations in LSCC patients, including CD45+ leukocytes, CD3+ T lymphocytes, CD4+ T lymphocytes, CD8+ T lymphocytes, γδT lymphocytes and CD66b+ neutrophils (TANs and PANs) (), and corresponding PD-1 expression on lymphocytes and PD-L1 expression on neutrophils (). A representative gating strategy was employed to identify immune cell infiltration and clinical characteristics of LSCC patients were demonstrated in Figure S1 and Table S2.
Figure 2 Immune cell infiltration profiles in LSCC. (A) Representative polychromatic dot plots displayed CD45+ leukocytes, CD3+ T cells, CD4+ T cells, CD8+ T cells γδT cells (γδTCR+) and neutrophils (CD66b+) in peripheral blood, tumor tissues and normal tissues from LSCC patients or healthy controls. (B) Calculative distribution of lymphocytes, neutrophils, NLR, CD3+T cells, CD4+T cells, CD8+T cells, γδT cells, and CD4+T cells /CD8 + T cells ratio in peripheral blood, tumor tissues and normal tissues. (C) Representative PD-1 expression on CD4+T/CD8+T/γδT cells and PDL-1 expression on CD66b+ neutrophils from the peripheral blood, tumor tissues and normal tissues. (D) Statistics analysis of PD-1+ CD4+T, PD-1+ CD8+T, PD-1+ γδT cells and PDL-1+ CD66b+ neutrophils. (E) Association analysis of TANs, NLR, CD3+ T cells or CD8+ T cells and tumor staging. (F) Linear correlation between TANs and CD3+ T cells, CD4+T cells, CD8+ T cells, or γδT cells. (G) Linear correlation between PD-L1+ TANs and PD-1+ CD4+ T cells, PD-1+ CD8+ T cells, or PD-1+ γδT cells. Each dot represents an independent data point as determined by flow cytometry. ns = p > 0.05, *p < 0.05, **p < 0.01, ***p < 0.001.
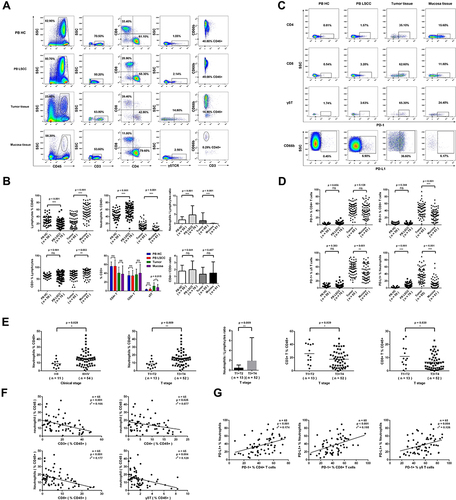
Compared with the peripheral blood from healthy donors, T lymphocytes (%CD45+) in the peripheral blood from LSCC patients were significantly decreased (19.56±10.73 vs 30.15±12.64, p < 0.001, ), while PANs (%CD45+) (57.46±16.27 vs 44.25±13.80, p < 0.001, ) and NLR (3.37 vs 1.55, p < 0.001, ) were significantly increased. Compared with normal mucosa tissue, lymphocytes (%CD45+) (27.47±16.92 vs 53.34±19.88, p < 0.001, ) and CD3+ T lymphocytes (%lymphocytes) (67.10±16.87 vs 75.96±16.13, p = 0.003, ) in the LSCC tumor tissues were significantly decreased. In contrast, TANs (%CD45+) (14.52±9.27 vs 2.86±4.85, p < 0.001, ), NLR (Neutrophil-to-Lymphocyte Ratio) (0.54 vs 0.01, p < 0.001, ) and γδT lymphocytes (%CD3+) (11.11±7.60 vs 7.91±6.87, p = 0.015, ) were significantly increased. However, CD4/CD8 ratio showed no significant change (p = 0.457, ) between the LSCC tumor tissues and normal mucosa tissue (Table S3).
In LSCC tumor tissues, more CD8+ T lymphocytes (42.99±17.94 vs 28.41±15.63, p < 0.001, ) and γδT lymphocytes (55.36±17.85 vs 44.04±20.73, p = 0.001, ) expressed PD-1, and more TANs expressed PD-L1 (37.28±19.75 vs 11.88±13.74, p < 0.001, ). The advanced stage (T3-T4) tumor tissues had more TANs (%CD45+) (16.00±9.55 vs 8.62±4.90, p = 0.009), higher NLR (0.66 vs 0.26, p = 0.009), but fewer CD3+ T lymphocytes (%CD45+) (17.55±12.54 vs 26.09±15.01, p = 0.039) and CD8+ T lymphocytes (%CD45+) (6.68±5.64 vs 10.94±8.10, p = 0.030) than early stage (T1-T2) tissues (). Linear regression analysis identified that TANs (%CD45+) in LSCC tumor tissues were inversely associated with total CD3+ T lymphocytes (p < 0.001, r2 = 0.166), CD4+ T lymphocytes (p = 0.025, r2 = 0.077), CD8+ T lymphocytes (p < 0.001, r2 = 0.177), and γδT lymphocytes (p = 0.004, r2 = 0.128) (%CD45+) (). On the other hand, PD-L1 expression on TANs in LSCC tumor tissues revealed a positive correlation with PD-1 on CD4+ T lymphocytes (p < 0.001, r2 = 0.174), CD8+ T lymphocytes (p < 0.001, r2 = 0.195) and γδT lymphocytes (p = 0.004, r2 = 0.126) ().
PD-L1+ TANs Potently Suppress T-Cell Proliferation and Cytokines Production Function in the Tumor Microenvironment of LSCC
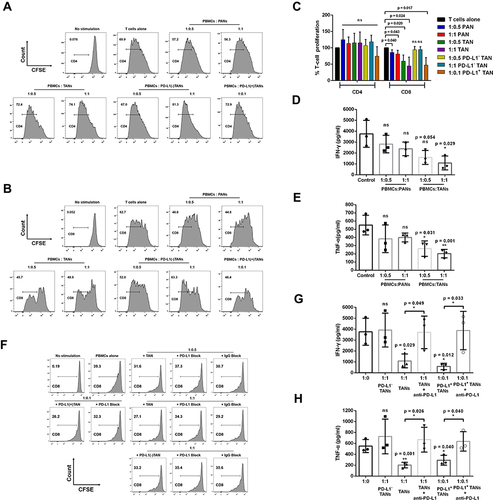
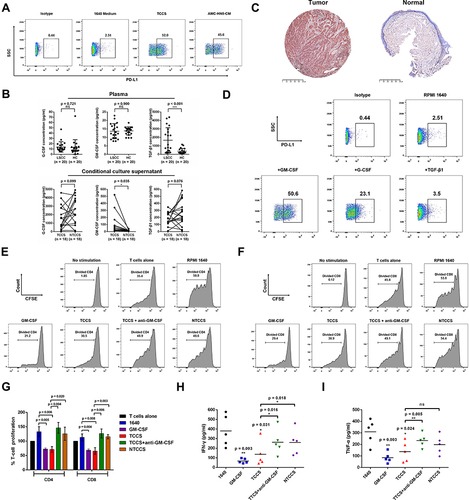
TANs in LSCC tumor tissues were morphologically heterogeneous consisting of immature neutrophils with banded nuclei as well as mature segmented neutrophils (). The apoptosis of TANs from tumor tissues of LSCC appeared less than PANs (). Compared with the control 1640 medium, PANs stimulated with tumor tissue conditional culture supernatant (TCCS) (p = 0.003) or non-tumor tissue conditional culture supernatant (NTCCS) (p = 0.016) for 16 h exhibited lower apoptosis, and PANs stimulated with TCCS displayed more significant inhibition of apoptosis (p = 0.014) (). Compared with PANs, TANs significantly suppressed CD8+ T lymphocytes proliferation () and inhibited IFN-γ (p = 0.029, ) and TNF-α (p = 0.001, ) production. Compared with unsorted TANs and PD-L1+ TANs, PD-L1- TAN showed no suppression on T cell proliferation (p > 0.05, ). However, PD-L1+ TAN demonstrated strong suppression on CD8+ T lymphocytes proliferation (p = 0.017, and ) and IFN-γ (p = 0.012, ) and TNF-α (p = 0.040, ) production, even at the 1:10 ratio of PD-L1+ TANs/PBMCs. The addition of an anti-PD-L1 neutralizing antibody partially reduced the immune suppression function of PD-L1+CD66b+TAN on T lymphocytes (), indicating the dependence of TAN’s T cell suppression on PD-L1.
Figure 3 LSCC tumor microenvironment contributes to neutrophil survival. (A) Giemsa staining of the TANs in LSCC showing that these neutrophils were morphologically heterogeneous consisting immature neutrophils with banded nuclei as well as mature segmented neutrophils. (B) Representative dot plots demonstrated the apoptosis of PANs, TANs, and PANs exposed to TTCS or NTTCS from LSCC patients by Annexin V at 16 hours. (C) Statistics analysis of apoptotic neutrophils/neutrophils exposed to TTCS and NTTCS from LSCC patients for 16 hours. *p < 0.05, **p < 0.01.
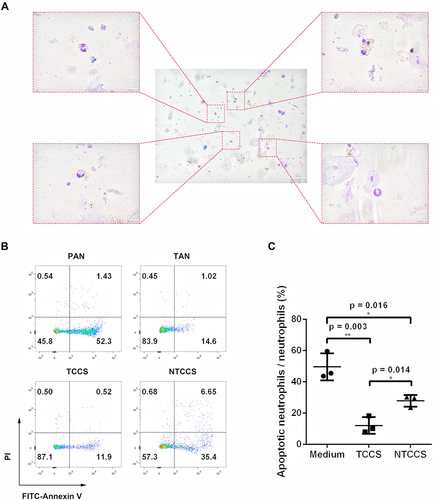
Figure 4 The effect of PANs or TANs from LSCC patients on the proliferation and cytokines production of T cells. (A–C) Representative histograms and statistics analysis of the proliferative capacity of CD4+T cells and CD8+ T cells at different ratio of coculture of PANs, TANs, PD-L1 (-) TANs or PD-L1 (+) TANs from LSCC patients with PBMCs. (D and E) IFN-γ and TNF-α production of T cells at different ratio of coculture of PANs, TANs from LSCC patients with PBMCs. Anti-PD-L1 neutralizing antibody partly weakens the suppression function of TANs on CD8+ T lymphocytes proliferation and cytokines production. (F) Representative histograms of proliferative capacity of CD8+ T cells following the coculture of TANs, PD-L1(-) TANs or PD-L1(+) TANs with PBMCs from LSCC patients at the addition of anti-PD-L1 neutralizing antibody or IgG control antibody. (G and H) IFN-γ and TNF-α production of T cells following the coculture of PD-L1(-) TANs, TANs, or PD-L1(+) TANs from LSCC patients with PBMCs at the addition of anti-PD-L1 neutralizing antibody. ns = p > 0.05, *p < 0.05, **p < 0.01.
LSCC Tumor Microenvironment-Derived GM-CSF Modulates the Phenotype and Immunosuppression of Neutrophil on T Cell
Compared to RPMI 1640 medium, PANs stimulated with TCCS or conditioned medium from AMC-HN-8 cells displayed higher levels of PD-L1 (). Compared with the healthy controls, LSCC patients displayed significantly higher plasma TGF-β1 levels (1664.0±328.4 vs 368.4±71.0 pg/mL, p < 0.001), but no statistical differences in G-CSF (p = 0.721) or GM-CSF (p = 0.900) levels (). Surprisingly, TCCS had a much higher level of GM-CSF than NTCCS (85.0±32.0 vs 13.8±1.8 pg/mL, p = 0.035), but no significant difference in G-CSF (p = 0.099) or TGF-β1 (p = 0.076) (). The high GM-CSF in the tumor tissue of LSCC was further confirmed in IHC staining, and appeared to be mainly derived from tumor cells (). GM-CSF induced the most significant up-regulation of the PD-L1 expression on PANs, compared to the stimulation of G-CSF and TGF-β1 (). Importantly, those PANs that were stimulated with GM-CSF could significantly inhibit CD4 (p = 0.005, and ) and CD8 (p = 0.004, and ) T cell proliferation and IFN-γ (p = 0.003, ) and TNF-α (p = 0.003, ) production. Compared to the stimulation with NTCCS, TCCS significantly suppressed CD4 (p = 0.020, and ) and CD8 (p = 0.003, and ) T cell proliferation and IFN-γ (p = 0.018, ) production. Adding a GM-CSF neutralizing antibody to TCCS substantially reduced PAN-mediated suppression of T-cell proliferation and cytokines production ( and ). These results indicate that GM-CSF from LSCC tumour cells modulates TANs which in turn exerts immunosuppression.
Figure 5 LSCC tumor microenvironment remodels and regulates the phenotype and function of neutrophils. (A) TCCS or cultural medium from AMC-HN-8 cells upregulated the level of immunosuppressive molecule PD-L1 on neutrophils. (B) ELISA detected the concentration of GM-CSF, G-CSF and TGF-β1 in the plasma, TCCS and NTCCS of LSCC patients. (C) Representative images were shown for GM-CSF IHC staining (magnification, X 50) of tumor tissues and normal tissues from LSCC patients. Bars = 500μm. (D) Cytokine GM-CSF most significantly upregulated the level of immunosuppressive molecule PD-L1 on neutrophils. (E-G) Representative histograms and statistics analysis of the proliferative capacity of CD4+T cells and CD8+ T cells following the coculture of PANs from LSCC patients with PBMCs at different stimuli. (H and I) IFN-γ and TNF-α production of T cells following the coculture of PANs from LSCC patients with PBMCs at different stimuli. ns = p > 0.05, *p < 0.05, **p < 0.01, ***p < 0.001.
High Level of GM-CSF Predicts Poor Prognosis and is Correlated with Inflammatory Immune Cells Infiltration in HNSC
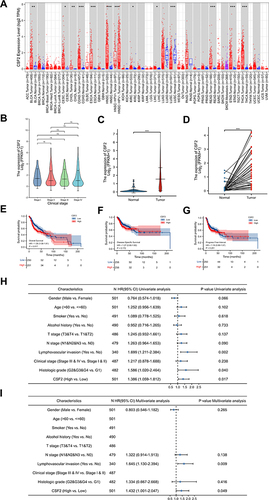
To evaluate GM-CSF (CSF2) expression levels, we analyzed the differential transcriptional levels of CSF2 between the tumor tissues and adjacent normal tissues across all tumor types including HNSC in the TCGA database (). As shown in the box plots (), the mRNA expression of CSF2 was significantly upregulated in patients with bladder urothelial carcinoma (BLCA), cervical and endocervical cancer (CESC), cholangiocarcinoma (CHOL), colon adenocarcinoma (COAD), esophageal carcinoma (ESCA), HNSC, kidney renal clear cell carcinoma (KIRC), liver hepatocellular carcinoma (LIHC), rectum adenocarcinoma (READ), stomach adenocarcinoma (STAD) and thyroid carcinoma (THCA). We verified CSF2 overexpression in HNSC tumor tissues and compared it to both unpaired and paired normal tissues in the TCGA database ( and ). However, CSF2 expression did not appear to be significantly associated with tumor clinical stages of HNSC patients (). To investigate the effect of CSF2 mRNA expression on HNSC prognosis, we performed Kaplan–Meier analysis and found that increased levels of CSF2 were associated with worse overall survival in HNSC patients (HR = 1.39 (1.06–1.81), p = 0.017) (), whereas CSF2 expression was not correlated with disease-specific survival (HR = 1.27 (0.90–1.80), p = 0.172) () nor progression free interval (HR = 1.18 (0.89–1.57), p = 0.251) (). Univariate and multivariate Cox regression analyses in the TCGA database were further conducted to confirm CSF2 expression as an independent risk factor in HNSC patients (HR = 1.432 (1.001–2.047), p = 0.049) ( and ).
Figure 6 The expression level and prognostic value of CSF2 in HNSC patients from TCGA database. (A) CSF2 expression levels in different tumor types from TCGA database were analyzed by TIMER web server. (B) Expression level of CSF2 in different clinical stage of HNSC patients in the TCGA database (Stage I: 19 cases, Stage II: 95 cases, Stage III: 102 cases, Stage IV: 272 cases, Kruskal–Wallis test, F = 0.758, p = 0.859). (C) Expression levels of CSF2 in unpaired HNSC samples of tumor tissues and normal tissues in the TCGA database (Tumor: 502 cases, Normal: 44 cases). (D) Expression levels of CSF2 in paired HNSC samples of tumor tissues and normal tissues in the TCGA database (Tumor: 43 cases, Normal: 43 cases). (E-G) Kaplan–Meier curves of overall survival, disease specific survival and progression free interval for low- and high- CSF2 expression subgroups in the TCGA-HNSC cohort. (H and I) Forest plots of univariate and multivariate analyses for HNSC patients on overall survival in the TCGA database. ns = p > 0.05, *p < 0.05, **p < 0.01, ***p < 0.001.
Since GM-CSF acts as a link between tissue-invading lymphocytes and myeloid cells in chronic inflammation,Citation16 we explored the function and association of GM-CSF expression in the immune microenvironment of HNSC patients from TCGA database (). HNSC cases in the TCGA database were divided into high- (top 50%) and low- (bottom 50%) groups according to the median expression of CSF2. Top 50 genes positively correlated with CSF2 expression were illustrated in , including inflammatory cytokines and chemokines IL24, IL11, IL1B, IL1A, CXCL3, CXCL8, and CXCL5 (p of Spearman correlation <0.001). Further GO BP and KEGG enrichment analyses of topping 300 differential expressed genes that were positively related to CSF2 expression were performed, which revealed that high CSF2 expression was involved in leukocyte migration, cell chemotaxis, and cytokine-cytokine receptor interaction ( and ). GSEA analysis also validated that high CSF2 expression was related to inflammatory response (), which suggested that high CSF2 levels might be involved in the formation of HNSC inflammatory immune microenvironment.
Figure 7 Correlation of CSF2 expression with immune infiltration level in HNSC patients from TCGA database. (A) Heatmap illustrated the top 50 genes positively associated with CSF2 expression. (B) GO BP enrichment analysis of topping 300 differential expressed genes positively related with CSF2 expression. (C) KEGG enrichment analysis of topping 300 differential expressed genes positively related with CSF2 expression. (D) GSEA of topping 300 differential expressed genes positively related with CSF2 expression. (E) Infiltration Levels of different immune cell types in HNSCC subgroups with low- and high-CSF2 enrichment score. (F) The scatter plots presented the relationship between the CSF2 expression and immune cells infiltration levels. ns = p > 0.05, **p < 0.01, ***p < 0.001.
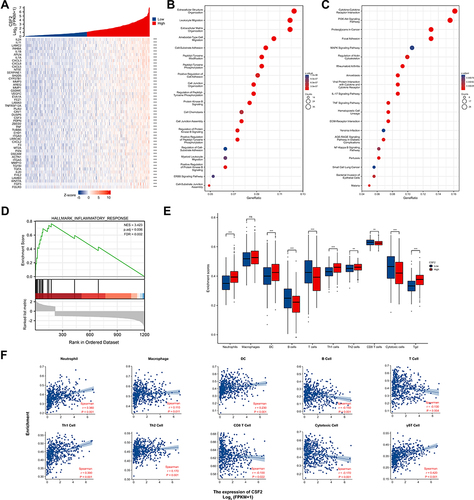
GSVA was further performed to investigate the relationship between CSF2 and various inflammatory immune infiltrating cells. The expression levels of CSF2 were significantly increased in HNSC patients with high immune cells infiltration of neutrophils, DCs, Th1 cells, Th2 cells and γδT cells. In addition, the expression level of CSF2 was significantly positively correlated with the infiltration of neutrophils (r = 0.360, p < 0.001), macrophages (r = 0.110, p = 0.011), DCs (r = 0.230, p < 0.001), Th1 cells (r = 0.390, p < 0.001), Th2 cells (r = 0.170, p < 0.001) and γδT cells (r = 0.420, p < 0.001) (). Furthermore, the expression levels of CSF2 were significantly negatively correlated with the infiltration of B cells (r = −0.150, p < 0.001), total CD3+ T cells (r = −0.130, p = 0.004), CD8 T cells (r = −0.100, p = 0.022) and cytotoxic cells (r = −0.170, p < 0.001) (). These findings further revealed a strong relationship between CSF2 and immunosuppression in the inflammatory tumor microenvironment.
Discussion
Accumulating studies have revealed critical roles for neutrophils in tumor immune surveillance and escape. However, most research on neutrophils in LSCC was limited to the analysis of PANs and peripheral blood NLRs. Although high peripheral blood NLRs were found to be associated with unfavorable outcome in LSCC patients,Citation17–19 TANs, which are much more authentically reflect the tumor immune microenvironment of LSCC, have not been fully examined or assessed for their characteristics and function roles, the remodeling plasticity in response to the TME mediators, or the potential prognostic value.
Chronic inflammation promotes tumor initiation and progression, and contributes to tumor evasion of immunosurveillance.Citation20 Terms of immunologically “hot” or “cold” TME are categorized to distinguish tumors whether they exhibit high levels of cellular and/or gene expression characteristics for anti-tumor immune function primarily through T cells.Citation21,Citation22 The inflammatory TME is well orchestrated, consisting of tumor cells, the reciprocal interacting tumor-infiltrating immune cells and surrounding stromal cells. Recent studies demonstrated that HNSC patients with higher T cell infiltration, characterized as enhanced tumor mutation burden and immune-activating signaling pathways, displayed significant PD1/PD-L1 checkpoint inhibition immunotherapeutic benefits, indicating that inflammatory immune cell infiltration landscape can act as a predictive biomarker for immunotherapy.Citation23 Long-term cigarette smoking and alcohol drinking is causatively involved in local and systemic chronic inflammation leading to LSCC. We previously reportedCitation13,Citation24,Citation25 and additional results in this study demonstrated that the tumor tissues of LSCC had an inflammatory microenvironment highly infiltrated with CD45+ leukocytes and CD66b+ neutrophils. Furthermore, compared to early-stage LSCC patients, those advanced-stage patients had increased inflammatory infiltration of TANs and NLR, and decreased infiltration of CD3+ T lymphocytes and CD8+ T lymphocytes from tumor tissues. We found that the increased TANs were predominantly located within the peritumoral stroma region and predicted poor prognosis of LSCC in a large patient cohort, serving as a LSCC prognostic marker.
The inflammatory immune cells infiltrating in tumor-surrounding regions are often modified by tumour cells in tumor development to form a supportive microenvironment.Citation26 Eruslanov et alCitation27 demonstrated that in contrast to PANs, TANs present in early stage of lung cancer patients displayed classical activated phenotype, characterized by up-expression of CD54 and co-stimulatory molecules (CD86, OX40L, 4–1BBL) and down-expression of CD62L, CXCR1, CXCR2, and CD16 to active T cells to play anti-tumor immune response. However, as the tumor progresses, in advanced tumors, TANs switched to an immunosuppressive phenotype.Citation28 We firstly revealed here that the dominantly accumulated TANs over-expressed PD-L1 in LSCC, which was completely distinct from PANs. Furthermore, advanced stage LSCC had few infiltrated CD8+ T lymphocytes but with higher PD-1 expression. In addition, PD-L1 on TANs was positively correlated with PD-1 levels on T cells, which was closely related to antitumor immune response. PD-L1 is expressed on various cells including lymphocytes, macrophages, dendritic cells, and non-hematopoietic healthy cells, such as endothelial cells, keratinocytes, and cancer cells.Citation4 PD-L1 level was found up-regulated on neutrophils from both septic mice and patients with severe sepsis, which may be related to sepsis-induced immunosuppression.Citation29 In hepatocellular carcinoma (HCC) study, the tumor infiltrating neutrophils and T cells from both HCC patients and hepatoma-bearing mice displayed higher frequencies of PD-L1 and PD-1, respectively.Citation9 Meanwhile, neutrophils expressing PD-L1 in HCC patients significantly inhibited the proliferation and activation of T cells, which could be partially reversed by the blockade of PD-L1.Citation9 TANs can regulate tumor immune escape through a variety of mechanisms including ROS or NOS production,Citation30 arginine consumption,Citation31 targeting PD-1/PD-L1 pathway,Citation9,Citation32 and release of immunosuppressive cytokines.Citation33 Compared with unsorted TANs or PD-L1−TANs, PD-L1+TANs displayed considerably more potent suppressive role in T lymphocytes proliferation and cytokines production, which could also be partially reversed by antibody blocking PD-L1. Collectively, our results demonstrate that TANs expressing high PD-L1 in LSCC are a highly suppressive population and are phenotypically and functionally distinct from PD-L1− TANs, and that PD-L1+ TANs act through the PD-1/PD-L1 pathway.
TANs can be polarized by TME toward either an anti-tumor (N1) phenotype by IFN-βCitation34 or a pro-tumor (N2) phenotype by TGF-βCitation35 and G-CSF.Citation36 TAN polarization can also be modulated by various cytokines concentration and other factors of TME (such as hypoxia and low pH).Citation37 In our study, PANs stimulated with supernatant from LSCC tumor tissue or LSCC cell lines increased PD-L1 levels, indicating that one or more factors existing in LSCC inflammatory TME regulated TANs in their tumor immune function. Previous study reportedCitation38 that TGF-β1, G-CSF and GM-CSF were the main cytokines derived from TME regulating TAN polarization and immune suppression. We discovered here that GM-CSF displayed the most significant up-regulation of the PD-L1 expression on neutrophils in LSCC, which in turn potently impaired T cell proliferation and cytokines production function. We also revealed that GM-CSF protein was abundant in LSCC tumor tissue and mainly derived from tumor cells. Increased GM-CSF mRNA levels were also confirmed in HNSC patients from TCGA and were associated with worse OS, indicating that GM-CSF could serve as an independent risk factor for HNSC. Indeed, recent studies have explored the dynamic and diverse immune regulation roles of GM-CSF in different TME cell types in a dose- and cell-dependent manner, from immunostimulation to immunosuppression. Previous studies demonstrated that GM-CSF at relatively low levels could act as an immune adjuvant for tumor vaccine to drive anti-tumor immune response through the mobilization and activation of large numbers of APCs (such as DCs, macrophages) Citation39,Citation40 and NKT.Citation41 However, high dose of GM-CSF in TME may exhibit advert immunosuppressive activity,Citation42 and form a microenvironment enriched with TregCitation43 and TANs.Citation44 Dose- and cell-dependent control and corresponding signals would guide the opposite role of GM-CSF in tumor immune regulation.Citation45 In our study, we showed that high levels of GM-CSF, mainly derived from LSCC tumor cells, remarkably polarized neutrophils to upregulate PD-L1 expression resulting in T-cell suppression, which could be reversed by blockade of GM-CSF neutralizing antibody. A recent study found that in gastric cancer, tumor-derived GM-CSF induced PD-L1 expression on neutrophils through JAK-STAT3 signaling to mediate immunosuppressive response.Citation8 Therefore, GM-CSF is vital in remodeling neutrophils, which orchestrates an immunosuppressive crosstalk between PD-L1+ TANs and T cells.
We found that HNSC patients in TCGA with high GM-CSF displayed significantly increased levels of inflammatory chemokines including CXCL3, CXCL8, CXCL5, and CXCL2. Further analyses validated that high GM-CSF expression was involved in leukocyte migration, cell chemotaxis, cytokine–cytokine receptor interaction and inflammatory response. CXCL3, CXCL8, CXCL5 and CXCL2 interact with their receptors, especially CXCR2, and facilitate the chemotaxis of neutrophils from bone marrow to the circulation and recruitment to the inflammation site of TME.Citation46–49 We demonstrated previously that the CXCL5 gradient between serum and tumor tissue facilitates the recruitment of TANs to TME, which could be further enhanced by positive feedback through CXCL5 autocrine.Citation13 High CXCL5 in tumor tissues might also be involved in TAN recruitment to HNSC TME. Moreover, our study demonstrated that there was a significantly positive correlation between the GM-CSF expression levels in HNSC patients with the tumor infiltration of neutrophils, DCs, Th1 cells, Th2 cells and γδT cells, and a negative correlation with B cells, CD8 T cells and cytotoxic cells. Together these results shed light on the important role of GM-CSF with tumor-immune interactions, especially the recruitment and regulation of inflammatory tumor-infiltrating neutrophils in HNSC. However, because of the lack of further in vitro and in vivo experiments in our study, the underlying molecular and signaling mechanisms between GM-CSF and PD-L1+ TANs in LSCC are still not fully elaborated.
Conclusion
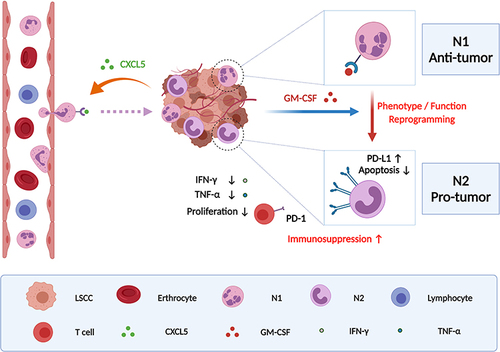
We propose that tumor-infiltrating PD-L1+ neutrophils induced by high level of tumor-derived GM-CSF predict unfavorable prognosis and suppress T cell proliferation and activation in the inflammatory microenvironment of LSCC, which in turn leads to weakening antitumor T cell immunity and fostering tumor progression ( was created based on tools from BioRender.com). Our findings here provide some experimental evidence that targeting PD-L1+TANs or GM-CSF could help disrupt tumor immunosuppression and benefit LSCC immunotherapy. Further in vitro and in vivo experiments based on practicable animal models are required to elucidate the underlying mechanisms.
Figure 8 Schematic representation of the proposed mechanism was created with from BioRender.com that tumor-derived GM-CSF may upregulate the expression of PD-L1 on tumor-infiltrating neutrophils recruited by CXCL5 release accumulation, which reprograms the phenotype and function of neutrophils and ultimately results in suppressing T cell proliferation and activation in the inflammatory microenvironment of LSCC and fostering tumor progression.
Disclosure
The authors declare no conflict of interest in this work.
Acknowledgments
We thank all members of Professor Lu’s Laboratory at Shanghai Institute of Immunology and Shanghai Jiaotong University School of Medicine for their technical assistance.
This study was supported by of the Major Clinical Research Project of Shanghai Shen-kang Hospital Clinical Development Center under Grant (SHDC2020CR6011); the Science and Technology Innovation Project of Shanghai Shen-kang Hospital Clinical Development Center under Grant (SHDC12015114); the National Natural Science Foundation of China under Grant (81772878, 82071856, 82103316, 30801283, 30972691); the Shanghai Municipal Key Clinical Specialty under Grant (shslczdzk00801); the National Key Research and Development Program under Grant (2017YFA0104500, 2020YFA010045); the Science and Technology Committee of Shanghai under Grant (20MC1920200); the Science and Technology Commission of Shanghai Municipality under Grant (16411950100, 18441903400, 20Y11902200); the Shanghai Science and Technology Development Funds under Grant (09QA1401000, 10QA1405900, 14411961900); the Shanghai Anti-Cancer Development Foundation under Grant (H6001-008); the Training Program of the Excellent Young Talents of Shanghai Municipal Health System under Grant (XYQ2011055, XYQ2011015); the Shanghai Municipal Science and Technology Foundation under Grant (11JC1410802); and the Training Program of the Excellent Doctors of Fudan University under Grant (QT00140).
Author contributions: All authors made substantial contributions to conception and design, acquisition of data, or analysis and interpretation of data, took part in drafting the article or revising it critically for important intellectual content, agreed to submit to the current journal, gave final approval for the version to be published, and agreed to be accountable for all aspects of the work.
References
- Bray F, Ferlay J, Soerjomataram I, Siegel RL, Torre LA, Jemal A. Global cancer statistics 2018: GLOBOCAN estimates of incidence and mortality worldwide for 36 cancers in 185 countries. CA Cancer J Clin. 2018;68(6):394–424. doi:10.3322/caac.21492
- Chen W, Zheng R, Baade PD, et al. Cancer statistics in China, 2015. CA Cancer J Clin. 2016;66(2):115–132. doi:10.3322/caac.21338
- Sanmamed MF, Chen L, Paradigm A. Shift in Cancer Immunotherapy: from Enhancement to Normalization. Cell. 2018;175(2):313–326. doi:10.1016/j.cell.2018.09.035
- Sun C, Mezzadra R, Schumacher TN. Regulation and Function of the PD-L1 Checkpoint. Immunity. 2018;48(3):434–452. doi:10.1016/j.immuni.2018.03.014
- Teng MW, Ngiow SF, Ribas A, Smyth MJ. Classifying Cancers Based on T-cell Infiltration and PD-L1. Cancer Res. 2015;75(11):2139–2145. doi:10.1158/0008-5472.CAN-15-0255
- Sionov RV, Fridlender ZG, Granot Z. The Multifaceted Roles Neutrophils Play in the Tumor Microenvironment. Cancer Microenviron. 2015;8(3):125–158. doi:10.1007/s12307-014-0147-5
- Ilie M, Hofman V, Ortholan C, et al. Predictive clinical outcome of the intratumoral CD66b-positive neutrophil-to-CD8-positive T-cell ratio in patients with resectable nonsmall cell lung cancer. Cancer. 2012;118(6):1726–1737. doi:10.1002/cncr.26456
- Wang TT, Zhao YL, Peng LS, et al. Tumour-activated neutrophils in gastric cancer foster immune suppression and disease progression through GM-CSF-PD-L1 pathway. Gut. 2017;66(11):1900–1911. doi:10.1136/gutjnl-2016-313075
- He G, Zhang H, Zhou J, et al. Peritumoural neutrophils negatively regulate adaptive immunity via the PD-L1/PD-1 signalling pathway in hepatocellular carcinoma. J Exp Clin Cancer Res. 2015;34:141. doi:10.1186/s13046-015-0256-0
- Wang Y, Fang T, Huang L, et al. Neutrophils infiltrating pancreatic ductal adenocarcinoma indicate higher malignancy and worse prognosis. Biochem Biophys Res Commun. 2018;501(1):313–319. doi:10.1016/j.bbrc.2018.05.024
- Trellakis S, Bruderek K, Dumitru CA, et al. Polymorphonuclear granulocytes in human head and neck cancer: enhanced inflammatory activity, modulation by cancer cells and expansion in advanced disease. Int J Cancer. 2011;129(9):2183–2193. doi:10.1002/ijc.25892
- Si Y, Merz SF, Jansen P, et al. Multidimensional imaging provides evidence for down-regulation of T cell effector function by MDSC in human cancer tissue. Sci Immunol. 2019;4(40). doi:10.1126/sciimmunol.aaw9159
- Zhang D, Zhou J, Tang D, et al. Neutrophil infiltration mediated by CXCL5 accumulation in the laryngeal squamous cell carcinoma microenvironment: a mechanism by which tumour cells escape immune surveillance. Clin Immunol. 2017;175:34–40. doi:10.1016/j.clim.2016.11.009
- Mascolo M, Ilardi G, Merolla F, et al. Tissue microarray-based evaluation of Chromatin Assembly Factor-1 (CAF-1)/p60 as tumour prognostic marker. Int J Mol Sci. 2012;13(9):11044–11062. doi:10.3390/ijms130911044
- Kargl J, Busch SE, Yang GH, et al. Neutrophils dominate the immune cell composition in non-small cell lung cancer. Nat Commun. 2017;8:14381. doi:10.1038/ncomms14381
- Becher B, Tugues S, Greter M. GM-CSF: from Growth Factor to Central Mediator of Tissue Inflammation. Immunity. 2016;45(5):963–973. doi:10.1016/j.immuni.2016.10.026
- Du J, Liu J, Zhang X, et al. Pre-treatment neutrophil-to-lymphocyte ratio predicts survival in patients with laryngeal cancer. Oncol Lett. 2018;15(2):1664–1672. doi:10.3892/ol.2017.7501
- Kano S, Homma A, Hatakeyama H, et al. Pretreatment lymphocyte-to-monocyte ratio as an independent prognostic factor for head and neck cancer. Head Neck. 2017;39(2):247–253. doi:10.1002/hed.24576
- Kara M, Uysal S, Altinisik U, Cevizci S, Guclu O, Derekoy FS. The pre-treatment neutrophil-to-lymphocyte ratio, platelet-to-lymphocyte ratio, and red cell distribution width predict prognosis in patients with laryngeal carcinoma. Eur Arch Otorhinolaryngol. 2017;274(1):535–542. doi:10.1007/s00405-016-4250-8
- Greten FR, Grivennikov SI. Inflammation and Cancer: triggers, Mechanisms, and Consequences. Immunity. 2019;51(1):27–41. doi:10.1016/j.immuni.2019.06.025
- Binnewies M, Roberts EW, Kersten K, et al. Understanding the tumor immune microenvironment (TIME) for effective therapy. Nat Med. 2018;24(5):541–550. doi:10.1038/s41591-018-0014-x
- Shalapour S, Karin M. Pas de Deux: control of Anti-tumor Immunity by Cancer-Associated Inflammation. Immunity. 2019;51(1):15–26. doi:10.1016/j.immuni.2019.06.021
- Zhang X, Shi M, Chen T, Zhang B. Characterization of the Immune Cell Infiltration Landscape in Head and Neck Squamous Cell Carcinoma to Aid Immunotherapy. Mol Ther Nucleic Acids. 2020;22:298–309. doi:10.1016/j.omtn.2020.08.030
- Xue Y, Du HD, Tang D, et al. Correlation Between the NLRP3 Inflammasome and the Prognosis of Patients With LSCC. Front Oncol. 2019;9:588. doi:10.3389/fonc.2019.00588
- Zhang D, Tang D, Heng Y, et al. Prognostic Impact of Tumor-Infiltrating Lymphocytes in Laryngeal Squamous Cell Carcinoma Patients. Laryngoscope. 2021;131(4):E1249–E1255. doi:10.1002/lary.29196
- Allen CT, Clavijo PE, Van Waes C, Chen Z. Anti-Tumor Immunity in Head and Neck Cancer: understanding the Evidence, How Tumors Escape and Immunotherapeutic Approaches. Cancers. 2015;7(4):2397–2414. doi:10.3390/cancers7040900
- Eruslanov EB. Phenotype and function of tumor-associated neutrophils and their subsets in early-stage human lung cancer. Cancer Immunol Immunother. 2017;66(8):997–1006. doi:10.1007/s00262-017-1976-0
- Catacchio I, Scattone A, Silvestris N, Mangia A. Immune Prophets of Lung Cancer: the Prognostic and Predictive Landscape of Cellular and Molecular Immune Markers. Transl Oncol. 2018;11(3):825–835. doi:10.1016/j.tranon.2018.04.006
- Wang JF, Li JB, Zhao YJ, et al. Up-regulation of programmed cell death 1 ligand 1 on neutrophils may be involved in sepsis-induced immunosuppression: an animal study and a prospective case-control study. Anesthesiology. 2015;122(4):852–863. doi:10.1097/ALN.0000000000000525
- Khanna S, Graef S, Mussai F, et al. Tumor-Derived GM-CSF Promotes Granulocyte Immunosuppression in Mesothelioma Patients. Clin Cancer Res. 2018;24(12):2859–2872. doi:10.1158/1078-0432.CCR-17-3757
- Hock BD, Taylor KG, Cross NB, Kettle AJ, Hampton MB, McKenzie JL. Effect of activated human polymorphonuclear leucocytes on T lymphocyte proliferation and viability. Immunology. 2012;137(3):249–258. doi:10.1111/imm.12004
- Buddhisa S, Rinchai D, Ato M, Bancroft GJ, Lertmemongkolchai G. Programmed death ligand 1 on Burkholderia pseudomallei-infected human polymorphonuclear neutrophils impairs T cell functions. J Immunol. 2015;194(9):4413–4421. doi:10.4049/jimmunol.1402417
- De Santo C, Arscott R, Booth S, et al. Invariant NKT cells modulate the suppressive activity of IL-10-secreting neutrophils differentiated with serum amyloid A. Nat Immunol. 2010;11(11):1039–1046. doi:10.1038/ni.1942
- Jablonska J, Leschner S, Westphal K, Lienenklaus S, Weiss S. Neutrophils responsive to endogenous IFN-beta regulate tumor angiogenesis and growth in a mouse tumor model. J Clin Invest. 2010;120(4):1151–1164. doi:10.1172/JCI37223
- Fridlender ZG, Sun J, Kim S, et al. Polarization of tumor-associated neutrophil phenotype by TGF-beta: “N1” versus “N2” TAN. Cancer Cell. 2009;16(3):183–194. doi:10.1016/j.ccr.2009.06.017
- Casbon AJ, Reynaud D, Park C, et al. Invasive breast cancer reprograms early myeloid differentiation in the bone marrow to generate immunosuppressive neutrophils. Proc Natl Acad Sci U S A. 2015;112(6):E566–75. doi:10.1073/pnas.1424927112
- Mishalian I, Bayuh R, Levy L, Zolotarov L, Michaeli J, Fridlender ZG. Tumor-associated neutrophils (TAN) develop pro-tumorigenic properties during tumor progression. Cancer Immunol Immunother. 2013;62(11):1745–1756. doi:10.1007/s00262-013-1476-9
- Coffelt SB, Wellenstein MD, de Visser KE. Neutrophils in cancer: neutral no more. Nat Rev Cancer. 2016;16(7):431–446. doi:10.1038/nrc.2016.52
- Mach N, Gillessen S, Wilson SB, Sheehan C, Mihm M, Dranoff G. Differences in dendritic cells stimulated in vivo by tumors engineered to secrete granulocyte-macrophage colony-stimulating factor or Flt3-ligand. Cancer Res. 2000;60(12):3239–3246.
- Salgia R, Lynch T, Skarin A, et al. Vaccination with irradiated autologous tumor cells engineered to secrete granulocyte-macrophage colony-stimulating factor augments antitumor immunity in some patients with metastatic non-small-cell lung carcinoma. J Clin Oncol. 2003;21(4):624–630. doi:10.1200/JCO.2003.03.091
- Gillessen S, Naumov YN, Nieuwenhuis EE, et al. CD1d-restricted T cells regulate dendritic cell function and antitumor immunity in a granulocyte-macrophage colony-stimulating factor-dependent fashion. Proc Natl Acad Sci U S A. 2003;100(15):8874–8879. doi:10.1073/pnas.1033098100
- Parmiani G, Castelli C, Pilla L, Santinami M, Colombo MP, Rivoltini L. Opposite immune functions of GM-CSF administered as vaccine adjuvant in cancer patients. Ann Oncol. 2007;18(2):226–232. doi:10.1093/annonc/mdl158
- Reggiani F, Labanca V, Mancuso P, et al. Adipose Progenitor Cell Secretion of GM-CSF and MMP9 Promotes a Stromal and Immunological Microenvironment That Supports Breast Cancer Progression. Cancer Res. 2017;77(18):5169–5182. doi:10.1158/0008-5472.CAN-17-0914
- Quail DF, Olson OC, Bhardwaj P, et al. Obesity alters the lung myeloid cell landscape to enhance breast cancer metastasis through IL5 and GM-CSF. Nat Cell Biol. 2017;19(8):974–987. doi:10.1038/ncb3578
- Zhan Y, Lew AM, Chopin M. The Pleiotropic Effects of the GM-CSF Rheostat on Myeloid Cell Differentiation and Function: more Than a Numbers Game. Front Immunol. 2019;10:2679. doi:10.3389/fimmu.2019.02679
- Eash KJ, Greenbaum AM, Gopalan PK, Link DC. CXCR2 and CXCR4 antagonistically regulate neutrophil trafficking from murine bone marrow. J Clin Invest. 2010;120(7):2423–2431. doi:10.1172/JCI41649
- Zhou SL, Dai Z, Zhou ZJ, et al. Overexpression of CXCL5 mediates neutrophil infiltration and indicates poor prognosis for hepatocellular carcinoma. Hepatology. 2012;56(6):2242–2254. doi:10.1002/hep.25907
- Chao T, Furth EE, Vonderheide RH. CXCR2-Dependent Accumulation of Tumor-Associated Neutrophils Regulates T-cell Immunity in Pancreatic Ductal Adenocarcinoma. Cancer Immunol Res. 2016;4(11):968–982. doi:10.1158/2326-6066.CIR-16-0188
- Nywening TM, Belt BA, Cullinan DR, et al. Targeting both tumour-associated CXCR2(+) neutrophils and CCR2(+) macrophages disrupts myeloid recruitment and improves chemotherapeutic responses in pancreatic ductal adenocarcinoma. Gut. 2018;67(6):1112–1123. doi:10.1136/gutjnl-2017-313738