
Abstract
Introduction
Lung adenocarcinoma (LUAD) is the most common type of lung cancer. DEP domain-containing 1 B (DEPDC1B) is involved in the development of several cancers; however, its role in LUAD is unknown. Therefore, we aimed to determine the biological function and prognostic value of DEPDC1B in LUAD.
Material and Methods
We analyzed the correlation between DEPDC1B expression and the clinical features of LUAD and lung squamous cell carcinoma (LUSC). Survival was evaluated by generating Kaplan–Meier curves, which were used to analyze the relationship between DEPDC1B expression and prognosis in LUAD and LUSC. DEPDC1B expression in tumor and normal tissues from patients with LUAD and LUSC was determined using immunohistochemistry, and its clinical significance was analyzed. Finally, the correlation between the expression and biological function of DEPDC1B in LUAD was examined.
Results
Our findings revealed that DEPDC1B expression was higher in tumor tissues than that in normal tissues from patients with LUAD and LUSC (P < 0.001). These results were confirmed in clinical samples from patients using immunohistochemistry. Analysis of a dataset from The Cancer Genome Atlas (TCGA) showed that high DEPDC1B expression was associated with poor prognosis only in patients with LUAD (P < 0.001). Similarly, high DEPDC1B expression was related to shorter overall survival (OS) and progression-free interval (PFI) in patients with LUAD. These associations were not observed in LUSC. Functional enrichment analysis suggested that DEPDC1B promoted tumor development in LUAD by regulating the cell cycle.
Conclusion
High DEPDC1B expression predicts poor prognosis in patients with LUAD. Thus, DEPDC1B has potential as a therapeutic target for LUAD.
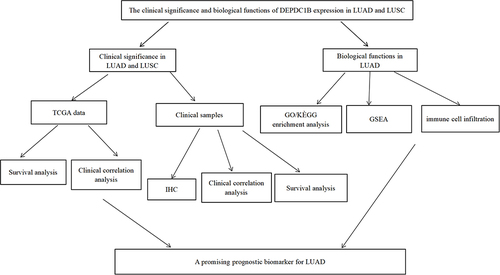
Graphical Abstract
Introduction
Lung cancer is a leading cause of cancer and cancer-related death worldwide.Citation1–3 The majority of lung cancers (about 85%) are non-small cell lung cancer (NSCLC), which includes lung adenocarcinoma (LUAD) and lung squamous cell carcinoma (LUSC). Adenocarcinoma is the most common pathological subtype. Prior to the 1990s, LUSC was the most common pathological subtype, especially in males. However, the incidence of adenocarcinoma has increased and now exceeds that of squamous cell carcinoma.Citation4 Lung cancer is one of the deadliest cancers, accounting for approximately 28% of cancer-related deaths. Most lung cancers are diagnosed at advanced stages, and the five-year survival rate is poor.Citation5 Despite recent advances in the timely diagnosis and treatment of NSCLC, the prognosis of advanced NSCLC remains poor. The diagnosis and treatment of NSCLC are multidisciplinary and require comprehensive clinical, radiological, molecular biological, and pathological data to accurately assess the prognosis and identify therapeutic targets. Studies have shown that molecular biological detection plays a significant role in improving the early diagnosis rate and prognosis of NSCLC.Citation6–8 Therefore, identifying oncogenes associated with prognosis in NSCLC is important for developing molecular biomarkers.
DEP domain-containing 1 B (DEPDC1B) is involved in various signaling pathways. DEPDC1B, located on chromosome 5q12, encodes a 61 kDa protein of 529 amino acids.Citation9,Citation10 DEP domains play significant roles in several processes. DEPDC1B recognizes G-protein-coupled receptors and regulates signaling pathways through effector and regulatory factors.Citation11 DEPDC1B interacts with diverse signaling molecules, including splicing regulatory molecules and transmembrane proteins. Studies have shown that DEPDC1B participates in cell adhesion, cell proliferation, and cell cycle regulation.Citation12,Citation13 DEPDC1B is overexpressed in various cancers and is a potential biomarker and therapeutic target.Citation9,Citation14–18 However, few studies have explored the role of DEPDC1B in NSCLC. Therefore, the objective of the present study was to explore the correlation between DEPDC1B expression and the clinicopathological features and prognosis of NSCLC. We also aimed to clarify the biological processes involving DEPDC1B in LUAD.
We analyzed and compared DEPDC1B expression between tumor and normal tissues in LUAD and LUSC in dataset from The Cancer Genome Atlas (TCGA) database. We then assessed DEPDC1B expression in clinical LUAD and LUSC samples using immunohistochemistry. We separately validated the association between DEPDC1B expression and prognosis in patients with LUAD and LUSC. Then, we used gene set enrichment analysis (GSEA) to determine the possible functions of DEPDC1B in LUAD. Our results strongly support DEPDC1B as a biomarker for predicting prognosis and treatment outcomes in LUAD. GSEA and immune-associated infiltration analysis revealed the biological impact of DEPDC1B in LUAD and the underlying mechanism. Our findings indicate that DEPDC1B may be an useful biomarker for predicting the prognosis of LUAD, but not LUSC.
Materials and Methods
Bioinformatics Data Source
We collected 594 LUAD cases (535 tumors and 59 normal tissues) and 551 LUSC cases (502 tumors and 49 normal tissues) from TCGA (https://cancergenome.nih.gov; Table S1). Next, we divided the cases into two groups, low and high DEPDC1B expression groups, using the median expression level as a cutoff.
Pathological Sample Collection
We collected tumor tissue samples and paired adjacent normal tissues (normal lung tissue more than 5 cm from the tumor margin) from 100 patients diagnosed with LUAD and 60 patients diagnosed with LUSC between December 2017 and December 2020. All patients were admitted to the First Affiliated Hospital of Anhui Medical University and provided written informed consent. The follow-up date was December 31, 2021 or the date of death. We collected the following patient information: age, gender, smoking status, pathological stage, TNM stage, tumor differentiation, follow-up status, progression free interval (PFI), and overall survival (OS). The clinicopathological information for enrolled patients is presented in Table S2. Two pathologists diagnosed lung cancer based on pathological findings and determined histologic types and stages according to the eighth edition of the tumor, node, metastasis (TNM) staging system for lung cancer.Citation19 This study was approved by the Institutional Review Board of First Affiliated Hospital of Anhui Medical University.
Immunohistochemical Analysis of DEPDC1B Expression
DEPDC1B expression in LUAD and LUSC was evaluated through immunohistochemical analysis of tumor and normal tissue samples collected from 100 patients diagnosed with LUAD and 60 patients diagnosed with LUSC. The tissues were fixed with formalin and embedded in paraffin, and DEPDC1B was detected using a rabbit anti- DEPDC1B polyclonal antibody (ab237542; Abcam). The paraffin embedded slides were deparaffinized in xylene, dehydrated using an ethanol gradient, and rinsed with distilled water and phosphate-buffered saline. Antigens were extracted by incubation in EDTA buffer for 30 min. Sections were incubated with an anti-DEPDC1B antibody (1:100 dilution) overnight at 4°C and then incubated with HRP-conjugated goat anti-rabbit IgG (ab111909; Abcam) at room temperature for 2 h. Finally, the slides were developed with DAB, stained with hematoxylin, dehydrated, mounted, examined, and evaluated. Two independent pathologists examined the prepared slides under a light microscope (400×) along with positive and negative controls. DEPDC1B overexpression was calculated based on the percentage of stained cells and staining intensity using a semi-quantitative scoring system.Citation20 Scores were assigned according to the percentage of stained cells as follows: 0 (0–5%), 1 (5–25%), 2 (25–50%), 3 (50–75%), and 4 (75–100%), and staining intensity was scored according to the color of the cell as follows: 0 (no staining), 1 (light staining), 2 (moderate staining), or 3 (intense staining). The scores for the percentage of stained cells and staining intensity were multiplied to obtain the final score (0–12 points). We defined 0–2, 3–6, and 7–12 points as no expression, low DEPDC1B expression, and high DEPDC1B expression, respectively.
Differential Gene Expression Analysis
We divided patients with LUAD into low and high DEPDC1B expression groups using the median z-score. Differentially expressed genes (DEGs) were analyzed using R software with a |log fold change| (log FC) >1 and adjusted P value <0.05 as threshold values.Citation21 Volcano and heat maps were created to visualize the results of the analyses.
Gene Set Enrichment Analysis
The biological function of DEPDC1B in LUAD was explored using Gene Set Enrichment Analysis (GSEA) of Gene Ontology (GO) terms and Kyoto Encyclopedia of Genes and Genomes (KEGG) pathways. GSEA has the advantage of gene sets grouped based on common biological function, chromosomal regulatory mechanism, or location.Citation22 Enrichment results were considered statistically significant when they showed a false discovery rate (FDR) <0.25 and an adjusted P-value <0.05.
Immune Infiltrate Analysis
Immune infiltration in LUAD samples was analyzed by single-sample GSEA, and infiltration of 24 immune cell types was analyzed using the GSVA package in R (http://www.biocondutor.org/package/release/bioc/html/GSVA.html).Citation23
Statistical Analysis
We analyzed DEPDC1B expression in unpaired and paired samples using the Wilcoxon rank-sum and Wilcoxon rank-sum sign tests, respectively. A nomogram of the clinical variables associated with DEPDC1B in LUAD was generated using the RMS R package.Citation24 The prognostic value of DEPDC1B in LUAD and LUSC was assessed using Kaplan–Meier analysis. Univariate and multivariate Cox regression analyses were employed to determine the prognostic factors in LUAD. All statistical analyses were conducted and plots were generated using R software (version 3.6.3). A P-value less than 0.05 was considered statistically significant.
Results
Elevated Expression of DEPDC1B in LUAD and LUSC
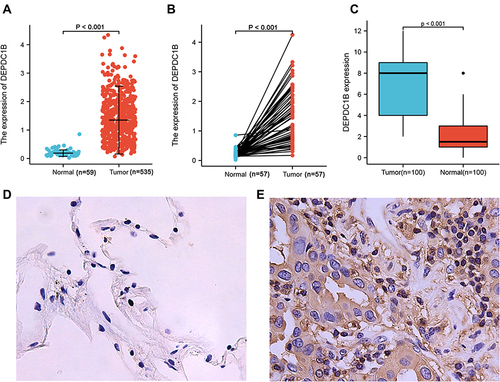
To examine DEPDC1B expression in patients with LUAD and LUSC, we compared the expression levels in tumor and normal tissues in a dataset from TCGA. In LUAD, DEPDC1B levels were significantly higher in tumor tissues than in normal tissues (P < 0.001; ) and were higher in tumor tissues than in paired normal tissues (P < 0.001; ). Similar results were observed in LUSC (P < 0.001; Figure S1A and B). To verify this difference in DEPDC1B expression, immunohistochemical analysis was performed using paired normal and tumor tissues collected from 100 patients with LUAD and 60 patients with LUSC. The results of our analysis confirmed elevated DEPDC1B levels in LUAD tumor tissue (P < 0.001; ), and representative immunohistochemical images are shown in and . Similar results were observed in LUSC (P < 0.001; Figure S1C–E).
Figure 1 DEPDC1B expression in lung adenocarcinoma (LUAD). (A) DEPDC1B expression levels in LUAD and normal tissues from a TCGA dataset. (B) DEPDC1B expression levels in LUAD and paired normal tissues from a TCGA dataset. (C) Immunohistochemical staining of DEPDC1B in LUAD and adjacent normal lung tissues from 100 patients. Representative IHC images of DEPDC1B expression in normal tissues (D) and LUAD tissues (E).
Relationship Between DEPDC1B Expression and the Clinicopathologic Features of LUAD and LUSC Obtained from a TCGA Dataset
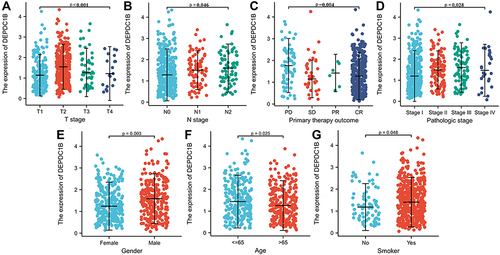
Kruskal–Wallis analysis showed that DEPDC1B expression levels in patients with LUAD were significantly related to T stage (P < 0.001), N stage (P = 0.046), primary therapy outcome (P = 0.004), and pathologic stage (P = 0.028; ). DEPDC1B expression levels in patients with LUSC were significantly related to T stage (P = 0.042), N stage (P < 0.001), and pathologic stage (P< 0.001) (Figure S2A–C). Results of the Mann–Whitney U-test revealed that DEPDC1B levels were significantly related to gender (P = 0.003), age (P = 0.025), and smoker (P = 0.048; ) in LUAD, but only significantly related to age (P = 0.003; Figure S2D) in LUSC.
Figure 2 Association of DEPDC1B expression with clinicopathologic characteristics in lung adenocarcinoma (LUAD): (A) T stage, (B) N stage, (C) primary therapy outcome, (D) pathologic stage, (E) gender, (F) age, and (G) smoker.
High Expression of DEPDC1B is Associated with Poor Prognosis in LUAD
Kaplan–Meier survival analysis of TCGA dataset showed that patients with high DEPDC1B-expressing tumors had shorter survival than those with low DEPDC1B-expressing tumors (OS, and PFI, ; P < 0.001). These results were validated in 100 patients with LUAD (OS, and PFI, ; P < 0.001). Interestingly, no significant difference was observed in patients with LUSC in TCGA dataset (Figure S3A and B) or our 60 LUSC patient cohort (Figure S3C and D). Therefore, we only conducted subgroup analysis of patients with LUAD in TCGA dataset, which showed that high DEPDC1B expression was correlated with OS for different TNM stages: T1 and T2 (P = 0.002; Figure S4A), T3 and T4 (P = 0.016, Figure S4B); N0 (P = 0.021; Figure S4C), N1, N2, and N3 (P = 0.065; Figure S4D); M0 (P < 0.001; Figure S4E) and M1 (P = 0.75; Figure S4F). Similar results were observed for clinical stages (I and II, P = 0.002, Figure S4G; III and IV, P = 0.116, Figure S4H). These results suggest that DEPDC1B expression levels impact the prognosis of patients with LUAD ().
Figure 3 Kaplan-Meier survival curves comparing patients with high and low DEPDC1B-expressing LUAD from a TCGA dataset. (A) Overall survival and (B) progression free interval. Kaplan–Meier survival curves of 100 LUAD patients with high and low DEPDC1B-expressing tumors (C) Overall survival and (D) progression free interval.
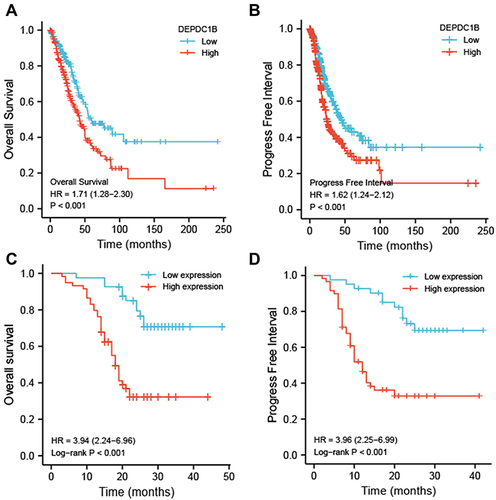
Figure 4 Relationship between DEPDC1B expression and different clinicopathological factors with overall survival. (A) Survival analysis of different clinical subgroups of patients with LUAD according to DEPDC1B expression. (B) Nomogram for predicting the outcome of patients with LUAD.
Univariate and Multivariate Cox Analyses of Prognosis in Patients with LUAD
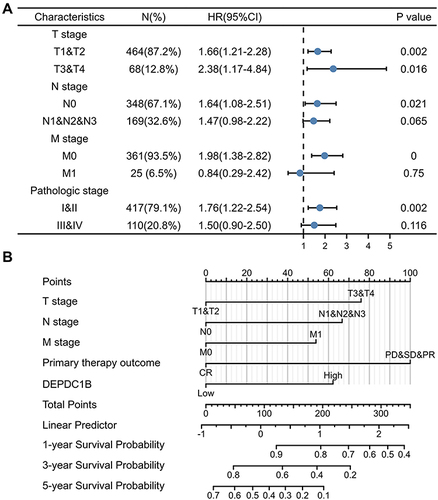
We examined the correlation between DEPDC1B expression and clinical characteristics of patients with LUAD in TCGA dataset using univariate Cox analysis. Clinicopathological variables associated with shorter survival included TNM stage, pathologic stage, primary therapy outcome, and high DEPDC1B expression. To comprehensively explore the factors related to high DEPDC1B expression and survival, multivariate Cox regression analysis was performed; high DEPDC1B expression remained an independent factor correlated with OS (Hazard ratio [HR]: 1.949, 95% confidence interval [CI]: 1.292–2.940; P = 0.001) and was correlated with N stage and primary therapy outcome (). We also conducted univariate and multivariate Cox analyses of our 100-patient cohort with LUAD. Univariate analysis showed that gender, N stage, pathologic stage, differentiation, and DEPDC1B expression were prognostic factors for OS. The results of the univariate analysis of PFI were similar to those of OS and are shown in . Multivariate analysis was performed using variables with P values <0.05 in the univariate analysis, and the results showed that male sex, terminal pathologic stage, poor differentiation, and high DEPDC1B expression were independent risk factors for OS and PFI of patients with LUAD, and the detailed results are shown in .
Table 1 Correlations Between DEPDC1B Expression and Overall Survival in Patients with Lung Adenocarcinoma Based on Univariate and Multivariate Cox Regression Analysis
Table 2 Univariate and Multivariate Analyses of Overall Survival and Progression Free Interval in 100 Patients with Lung Adenocarcinoma
Construction of a Nomogram Based on DEPDC1B Expression in LUAD
To better predict the outcomes of patients with LUAD, we constructed a nomogram using the multivariate analysis of TCGA dataset. This line chart incorporates the clinical features independently associated with survival in the multivariate analysis (ie, TNM stage, primary therapy outcome, and DEPDC1B expression; ). High DEPDC1B expression was associated with poor prognosis, in agreement with the results of the multivariate analysis. The c-index of the line chart was 0.719 (95% CI: 0.693–0.745). The calibration plot (Figure S5) showed that the predicted values are in good agreement with the observed values.
Identification of DEGs Between LUAD Patients with Low and High DEPDC1B Expression
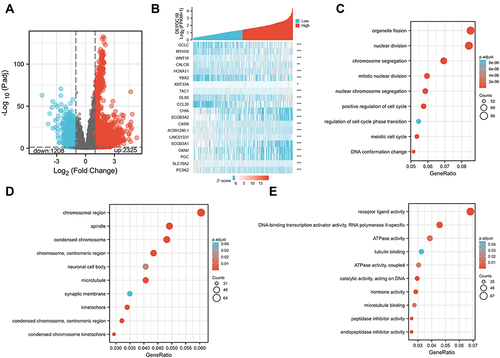
We used R (with |logFC| >1, and an adjusted P value <0.05) to analyze TCGA dataset (). We identified 3533 DEGs (2325 upregulated and 1208 downregulated) between the low and high DEPDC1B expression groups. Volcano and heat maps were created to visualize the results ( and ).
Figure 5 Differentially expressed genes between patients with high and low DEPDC1B-expressing LUAD. (A) Volcano plot of differentially expressed genes according DEPDC1B expression status. (B) Heat map showing 10 upregulated and downregulated genes selected based on DEPDC1B expression status. (Pearson). GO enrichment analysis of DEPDC1B expression-related genes. (C) Enriched GO biological process terms. (D) Enriched GO cellular component terms. (E) Enriched GO molecular function terms. *P < 0.05; **P < 0.01; ***P < 0.001.
DEPDC1B-Related Signaling Pathways and Enrichment Analyses in LUAD
To elucidate the role of DEPDC1B in LUAD, we conducted GO enrichment analysis of the 1400 DEGs most closely related to DEPDC1B using the ClusterProfile R package. We detected 253 enriched terms in GO biological process categories, including “organelle fission”, “nuclear division”, and “chromosome segregation” (), which indicates that DEPDC1B expression is involved in diverse biological processes. Sixty-four GO terms were related to the cellular component category “chromosomal region” (). Furthermore, the analysis suggested enrichment in the molecular function category “receptor-ligand activities” ().
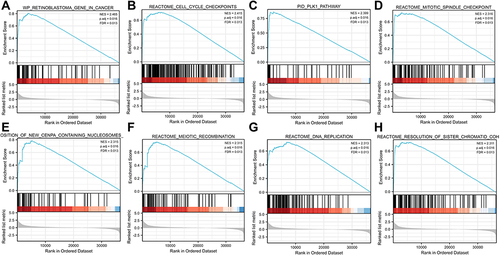
Related signaling pathways were identified in the low and high DEPDC1B expression groups using GSEA, and results with an adjusted P value <0.05 and a FDR <0.25 were regarded as significant. The following eight pathways were significantly different between the two groups: retinoblastoma gene in cancer, cell cycle checkpoints, PLK1 pathway, mitotic spindle checkpoint, deposition of new CENP-A-containing nucleosomes at the centromere, meiotic recombination, DNA replication, and resolution of sister chromatid cohesion ().
Figure 6 Enrichment plot from gene set enrichment analysis (GSEA). (A) Retinoblastoma gene in cancer, (B) cell cycle checkpoints, (C) PLK1 pathway, (D) mitotic spindle checkpoint, (E) deposition of new CENP-A-containing nucleosomes at the centromere, (F) meiotic recombination, (G) DNA replication, and (H) resolution of sister chromatid cohesion.
Correlations Between Immune Cell Infiltration and DEPDC1B Expression
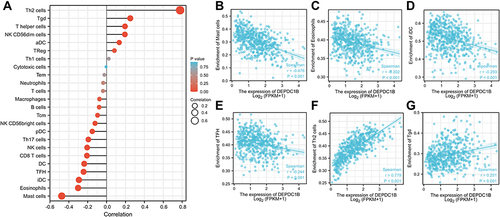
We next explored the correlation between DEPDC1B expression levels and infiltration of 24 immune cell types in LUAD (). DEPDC1B expression was negatively associated with mast cells, eosinophils, immature dendritic cells (iDCs), follicular helper T cells (TFHs), dendritic cells (DCs), CD8 T cells, and natural killer cells () and was positively associated with type-2 T helper (Th2) cells and gamma delta T (Tgd) cells ( and ).
Figure 7 Correlations between immune cell infiltration and DEPDC1B expression levels in LUAD. (A) Relationship between DEPDC1B expression and infiltration of 24 immune cell types. Relationship between DEPDC1B expression and infiltration of (B) mast cells, (C) eosinophils, (D) iDCs, (E) TFHs, (F) Th2 cells, and (G) Tgd cells.
Discussion
Lung cancer is one of the deadliest cancers worldwide, and LUAD is the most common histological subtype.Citation2 Developments in chemotherapy and advances in targeted therapy and immunotherapy have led considerable progress in the treatment of LUAD. However, the 5-year survival rate of LUAD remains unsatisfactory.Citation25,Citation26 Owing to the insidious symptoms of early lung cancers, many patients are diagnosed at an advanced stage. Therefore, identifying molecular biomarkers of LUAD is critical to develop novel therapeutic targets and establish optical treatment strategies.
The DEPDC protein family comprises seven members, which are characterized by the presence of a DEP domain. Accumulating evidence indicates that the DEPDC protein family is involved in the development and progression of several cancers, especially hepatocellular carcinoma, and is closely related to poor prognosis.Citation27 DEPDC1B, a member of the DEPDC1 family, is involved in the growth and progression of numerous tumors.Citation9,Citation15–17,Citation27–31
We performed bioinformatics analyses using RNA-seq data from TCGA to assess the prognostic value of DEPDC1B for LUAD and LUSC. The results indicated that high DEPDC1B expression was related to poor OS and PFI in patients with LUAD, but this association was not observed in LUSC. This result was also confirmed using immunohistochemistry. Overexpression of DEPDC1B in LUAD was associated with poor clinicopathological factors, indicating that DEPDC1B may function as an oncogene in LUAD. Typically, LUAD patients with high DEPDC1B expression had poorer OS than patients with low DEPDC1B expression, while no significant difference related to DEPDC1B expression was observed in LUSC. This finding differs from a previous study showing that DEPDC1B acts on the Wnt/β-catenin signaling pathway to accelerate NSCLC migration and invasion, suggesting that elevated DEPDC1B expression may be associated with poor prognosis in both types of NSCLC.Citation32 Previous investigations have indicated that most tumors are related to activation of the Wnt/β-catenin signaling pathway, which is involved in major developmental processes and may promote tumor development by influencing immune exclusion and immunosurveillance.Citation33,Citation34 Therefore, the Wnt/β-catenin signaling may also play an important role in NSCLC. Although DEPDC1B was previously shown to have an oncogenic effect on the progression of NSCLC, the sample size in the study was relatively small, and the possible biological functions of DEPDC1B in LUAD and LUSC have not been comprehensively explored. The results of our study indicate that DEPDC1B plays a role in LUAD but has no significant impact on the prognosis of LUSC. Accordingly, DEPDC1B is more valuable for the prognosis of LUAD.
Given that DEPDC1B expression did not significantly influence the prognosis of patients with LUSC in the present study, functional enrichment and immune infiltration analyses were performed for LUAD only. Targeted therapies for LUAD and LUSC differ substantially;Citation35 targeted therapies for LUAD tend to be more sensitive than those for LUSC. Enrichment analysis suggests that DEPDC1B expression is related to various biological processes, such as mitosis, and plays a significant role in the cell cycle. Studies have also shown that DEPDC1B acts at G2 phase of the cell cycle to control the progression of mitosis through adhesion-dependent signaling mechanisms.Citation12 Sustained proliferative signaling is one of the most important features of tumors.Citation36 Cancer cells are unstable, and our results suggest that high DEPDC1B expression may accelerate mitosis and promote cell migration and proliferation, resulting in tumor development, consistent with previous reports on other cancers.Citation16,Citation31
Evasion of immune destruction is a well-known characteristic of tumors, and immune cell infiltration is an important feature of the tumor microenvironment. The composition and distribution of infiltrating immune cells can impact prognosis. We investigated the relationship between DEPDC1B expression and immune cell infiltration in patients with LUAD. Our results showed that DEPDC1B expression was positively correlated with the levels of Th2 and Tgd cell infiltration. Studies have shown that T-cell stalling dominates the lung cancer landscape, along with immune dysregulation, such as Th1/Th2 cytokine ratio imbalance and T-cell infiltration, leading to tumor invasion.Citation37–39 A previous report showed that a Th2 response and tumor immune evasion lead to poor prognosis; however, this study was conducted in mice, and no significant progress has been made in human studies. Conversely, the development of lung cancer was associated with the expansion and phenotypic changes of resident Tgd cells in the tumor microenvironment.Citation40 In different cancers, Tgd cells regulate tumor activity through distinct mechanisms.Citation41,Citation42 Our findings revealed that DEPDC1B expression in LUAD was negatively associated with infiltration of mast cells and eosinophils. However, infiltration of eosinophils and mast cells has been correlated with a more favorable prognosis in several malignancies.Citation43–45 These results suggest that DEPDC1B might influence immune infiltration to alter the prognosis of patients with LUAD.
Our study has several limitations. First, the study included only one dataset and 160 clinical samples. Thus, the sample size was relatively small, and studies of larger samples are needed to verify the results. Second, although the relationship between DEPDC1B expression and immune cell infiltration was examined using bioinformatics, the specific mechanism requires experimental verification.
Conclusion
Our results showed that the DEPDC1B expression was significantly higher in tumor tissues than in normal tissues in both LUAD and LUSC. We examined the prognostic value of DEPDC1B in LUAD and LUSC, and the results suggest that high DEPDC1B expression predicts poor prognosis in patients with LUAD but not in patients with LUSC. DEPDC1B has potential as a biomarker for predicting the occurrence, progression, and prognosis of LUAD. However, additional experiments are needed to clarify the biological function of DEPDC1B and the underlying mechanism.
Data Sharing Statement
The data of this manuscript can be downloaded from The Cancer Genome Atlas database (https://portal.gdc.cancer.gov/). The original contributions presented in the study are included in the article and supplements. Further inquiries can be directed to the corresponding authors.
Ethics Approval and Consent to Participate
This research had been approved by the Institutional Review Boards of First Affiliated Hospital of Anhui Medical University. This project was following the principles of the Helsinki Declaration.
Consent for Publication
All patients signed an informed consent approved by the Institutional Review Board.
Disclosure
The authors have declared that no competing interest exists.
Acknowledgments
We acknowledge the TCGA database for providing their platforms and contributors for uploading their meaningful datasets.
Additional information
Funding
References
- Ettinger DS, Wood DE, Aisner DL, et al. Non-small cell lung cancer, version 5.2017, NCCN clinical practice guidelines in oncology. J Natl Compr Cancer Netw. 2017;15(4):504–535. doi:10.6004/jnccn.2017.0050
- Siegel RL, Miller KD, Fuchs HE, Jemal A. Cancer Statistics, 2021. CA Cancer J Clin. 2021;71(1):7–33. doi:10.3322/caac.21654
- Zhu K, Xu A, Xia W, et al. Association between NAT2 polymorphism and lung cancer risk: a systematic review and meta-analysis. Front Oncol. 2021;11:567762. doi:10.3389/fonc.2021.567762
- Lortet-Tieulent J, Soerjomataram I, Ferlay J, Rutherford M, Weiderpass E, Bray F. International trends in lung cancer incidence by histological subtype: adenocarcinoma stabilizing in men but still increasing in women. Lung Cancer. 2014;84(1):13–22. doi:10.1016/j.lungcan.2014.01.009
- Cheng TY, Cramb SM, Baade PD, Youlden DR, Nwogu C, Reid ME. The international epidemiology of lung cancer: latest trends, disparities, and tumor characteristics. J Thorac Oncol. 2016;11(10):1653–1671. doi:10.1016/j.jtho.2016.05.021
- Ettinger DS, Wood DE, Aggarwal C, et al. NCCN guidelines insights: non-small cell lung cancer, version 1.2020. J Natl Compr Cancer Netw. 2019;17(12):1464–1472. doi:10.6004/jnccn.2019.0059
- Vargas AJ, Harris CC. Biomarker development in the precision medicine era: lung cancer as a case study. Nature reviews. Cancer. 2016;16(8):525–537. doi:10.1038/nrc.2016.56
- Zhang B, Xu A, Wu D, et al. ARL14 as a prognostic biomarker in non-small cell lung cancer. J Inflamm Res. 2021;14:6557–6574. doi:10.2147/jir.S340119
- Liu X, Li T, Huang X, et al. DEPDC1B promotes migration and invasion in pancreatic ductal adenocarcinoma by activating the Akt/GSK3β/Snail pathway. Oncol Lett. 2020;20(5):146. doi:10.3892/ol.2020.12009
- Garcia-Mata R. Arrested detachment: a DEPDC1B-mediated de-adhesion mitotic checkpoint. Dev Cell. 2014;31(4):387–389. doi:10.1016/j.devcel.2014.11.008
- Ballon DR, Flanary PL, Gladue DP, Konopka JB, Dohlman HG, Thorner J. DEP-domain-mediated regulation of GPCR signaling responses. Cell. 2006;126(6):1079–1093. doi:10.1016/j.cell.2006.07.030
- Marchesi S, Montani F, Deflorian G, et al. DEPDC1B coordinates de-adhesion events and cell-cycle progression at mitosis. Dev Cell. 2014;31(4):420–433. doi:10.1016/j.devcel.2014.09.009
- Chen D, Ito S, Hyodo T, Asano-Inami E, Yuan H, Senga T. Phosphorylation of DEPDC1 at Ser110 is required to maintain centrosome organization during mitosis. Exp Cell Res. 2017;358(2):101–110. doi:10.1016/j.yexcr.2017.06.005
- Bai S, Chen T, Du T, et al. High levels of DEPDC1B predict shorter biochemical recurrence-free survival of patients with prostate cancer. Oncol Lett. 2017;14(6):6801–6808. doi:10.3892/ol.2017.7027
- Chen X, Guo ZQ, Cao D, Chen Y, Chen J. Knockdown of DEPDC1B inhibits the development of glioblastoma. Cancer Cell Int. 2020;20:310. doi:10.1186/s12935-020-01404-7
- Dang XW, Pan Q, Lin ZH, et al. Overexpressed DEPDC1B contributes to the progression of hepatocellular carcinoma by CDK1. Aging. 2021;13(16):20094–20115. doi:10.18632/aging.203016
- Lai CH, Xu K, Zhou J, et al. DEPDC1B is a tumor promotor in development of bladder cancer through targeting SHC1. Cell Death Dis. 2020;11(11):986. doi:10.1038/s41419-020-03190-6
- Zhang S, Shi W, Hu W, et al. DEP domain-containing protein 1B (DEPDC1B) promotes migration and invasion in pancreatic cancer through the Rac1/PAK1-LIMK1-Cofilin1 signaling pathway. Onco Targets Ther. 2020;13:1481–1496. doi:10.2147/ott.S229055
- Rami-Porta R, Bolejack V, Crowley J, et al. The IASLC lung cancer staging project: proposals for the revisions of the T descriptors in the forthcoming eighth edition of the TNM classification for lung cancer. J Thorac Oncol. 2015;10(7):990–1003. doi:10.1097/jto.0000000000000559
- Li Q, Wu J, Wei P, et al. Overexpression of forkhead Box C2 promotes tumor metastasis and indicates poor prognosis in colon cancer via regulating epithelial-mesenchymal transition. Am J Cancer Res. 2015;5(6):2022–2034.
- Dalman MR, Deeter A, Nimishakavi G, Duan ZH. Fold change and p-value cutoffs significantly alter microarray interpretations. BMC Bioinform. 2012;13(Suppl 2):S11. doi:10.1186/1471-2105-13-s2-s11
- Subramanian A, Tamayo P, Mootha VK, et al. Gene set enrichment analysis: a knowledge-based approach for interpreting genome-wide expression profiles. Proc Natl Acad Sci U S A. 2005;102(43):15545–15550. doi:10.1073/pnas.0506580102
- Hänzelmann S, Castelo R, Guinney J. GSVA: gene set variation analysis for microarray and RNA-seq data. BMC Bioinform. 2013;14:7. doi:10.1186/1471-2105-14-7
- Robin X, Turck N, Hainard A, et al. pROC: an open-source package for R and S+ to analyze and compare ROC curves. BMC Bioinform. 2011;12:77. doi:10.1186/1471-2105-12-77
- Jiang H, Xu A, Xia W, et al. Nivolumab monotherapy or combination therapy with ipilimumab for lung cancer: a systemic review and meta-analysis. Cancer Cell Int. 2021;21(1):426. doi:10.1186/s12935-021-02100-w
- Zhang B, Liu Y, Zhou S, Jiang H, Zhu K, Wang R. Predictive effect of PD-L1 expression for immune checkpoint inhibitor (PD-1/PD-L1 inhibitors) treatment for non-small cell lung cancer: a meta-analysis. Int Immunopharmacol. 2020;80:106214. doi:10.1016/j.intimp.2020.106214
- Liao Z, Wang X, Zeng Y, Zou Q. Identification of DEP domain-containing proteins by a machine learning method and experimental analysis of their expression in human HCC tissues. Sci Rep. 2016;6:39655. doi:10.1038/srep39655
- Ahuja P, Singh K. In Silico Approach for SAR analysis of the predicted model of DEPDC1B: a novel target for oral cancer. Adv Bioinformatics. 2016;2016:3136024. doi:10.1155/2016/3136024
- Gu Y, Li J, Guo D, et al. Identification of 13 key genes correlated with progression and prognosis in hepatocellular carcinoma by weighted gene co-expression network analysis. Front Genet. 2020;11:153. doi:10.3389/fgene.2020.00153
- Li Z, Wang Q, Peng S, et al. The metastatic promoter DEPDC1B induces epithelial-mesenchymal transition and promotes prostate cancer cell proliferation via Rac1-PAK1 signaling. Clin Transl Med. 2020;10(6):e191. doi:10.1002/ctm2.191
- Xu Y, Sun W, Zheng B, et al. DEPDC1B knockdown inhibits the development of malignant melanoma through suppressing cell proliferation and inducing cell apoptosis. Exp Cell Res. 2019;379(1):48–54. doi:10.1016/j.yexcr.2019.03.021
- Yang Y, Liu L, Cai J, et al. DEPDC1B enhances migration and invasion of non-small cell lung cancer cells via activating Wnt/β-catenin signaling. Biochem Biophys Res Commun. 2014;450(1):899–905. doi:10.1016/j.bbrc.2014.06.076
- Zhan T, Rindtorff N, Boutros M. Wnt signaling in cancer. Oncogene. 2017;36(11):1461–1473. doi:10.1038/onc.2016.304
- Clevers H, Loh KM, Nusse R. Stem cell signaling. An integral program for tissue renewal and regeneration: wnt signaling and stem cell control. Science. 2014;346(6205):1248012. doi:10.1126/science.1248012
- Campbell JD, Alexandrov A, Kim J, et al. Distinct patterns of somatic genome alterations in lung adenocarcinomas and squamous cell carcinomas. Nat Genet. 2016;48(6):607–616. doi:10.1038/ng.3564
- Hanahan D, Weinberg RA. Hallmarks of cancer: the next generation. Cell. 2011;144(5):646–674. doi:10.1016/j.cell.2011.02.013
- Stankovic B, Bjørhovde HA, Skarshaug R, et al. Immune cell composition in human non-small cell lung cancer. Front Immunol. 2018;9:3101. doi:10.3389/fimmu.2018.03101
- Anichini A, Perotti VE, Sgambelluri F, Mortarini R. Immune escape mechanisms in non small cell lung cancer. Cancers. 2020;12(12):3605. doi:10.3390/cancers12123605
- Bindea G, Mlecnik B, Tosolini M, et al. Spatiotemporal dynamics of intratumoral immune cells reveal the immune landscape in human cancer. Immunity. 2013;39(4):782–795. doi:10.1016/j.immuni.2013.10.003
- Jin C, Lagoudas GK, Zhao C, et al. Commensal microbiota promote lung cancer development via γδ T cells. Cell. 2019;176(5):998–1013.e16. doi:10.1016/j.cell.2018.12.040
- Story JY, Zoine JT, Burnham RE, et al. Bortezomib enhances cytotoxicity of ex vivo-expanded gamma delta T cells against acute myeloid leukemia and T-cell acute lymphoblastic leukemia. Cytotherapy. 2021;23(1):12–24. doi:10.1016/j.jcyt.2020.09.010
- Faustino LD, Griffith JW, Rahimi RA, et al. Interleukin-33 activates regulatory T cells to suppress innate γδ T cell responses in the lung. Nat Immunol. 2020;21(11):1371–1383. doi:10.1038/s41590-020-0785-3
- Theoharides TC. Mast cells and pancreatic cancer. N Engl J Med. 2008;358(17):1860–1861. doi:10.1056/NEJMcibr0801519
- Nielsen HJ, Hansen U, Christensen IJ, Reimert CM, Brünner N, Moesgaard F. Independent prognostic value of eosinophil and mast cell infiltration in colorectal cancer tissue. J Pathol. 1999;189(4):487–495. doi:10.1002/(sici)1096-9896(199912)189:4<487::Aid-path484>3.0.Co;2-i
- Davis BP, Rothenberg ME. Eosinophils and cancer. Cancer Immunol Res. 2014;2(1):1–8. doi:10.1158/2326-6066