
Abstract
Purpose
Sarcopenia has been described as a new complication of type 2 diabetes mellitus (T2DM). T2DM and sarcopenia impact each other, resulting in a variety of adverse outcomes such as frailty, disability, poor quality of life and increased mortality. Sodium butyrate (NaB) is reported to play a protective role against T2DM. The present study aimed to investigate whether NaB could ameliorate T2DM-related sarcopenia and the underlying mechanisms.
Materials and Methods
The male db/db mice at 7-weeks were used as T2DM-related sarcopenia animal model with C57BL/6J mice as control. Mice were grouped according to whether they received NaB orally as follows: C57BL/6J+water group, C57BL/6J+NaB group, db/db+water group, and db/db+NaB group. Then, db/db mice receiving NaB orally were administered with inhibitors of group 2 innate lymphocytes (ILC2s), anti-CD90.2 by intraperitoneal injection divided into db/db+NaB+PBS group and db/db+NaB+anti-CD90.2 group. NaB dissolved in water at 150 mM. The skeletal muscle mass was measured by dural X-ray (DXA) test. ILC2s in spleen and skeletal muscle were evaluated by flow cytometry. The expressions of IL-33, IL-13, STAT3, P-STAT3, GATA-3 and peroxisome proliferator-activated receptor gamma coactivator-1 alpha (PGC-1α) were assessed by ELISA or WB. The morphology of skeletal muscle fibers was assessed by immunofluorescence staining.
Results
The proportion of ILC2s and the expressions of ILC2s markers IL-13 and GATA-3 were all significantly decreased in db/db mice, and these changes were improved by NaB. NaB increased the proportion of slow-twitch fibers in gastrocnemius, thus partially reversing the reduced exercise capacity of db/db mice. The expression of slow-twitch fibers marker PGC-1α induced by NaB was increased via activation of ILC2s/IL-13/STAT3 pathway. On the other way, IL-33 was not necessary for the activation of ILC2s/IL-13/STAT3 pathway. After depletion of ILC2s by anti-CD90.2, the ameliorating effect of NaB on T2DM-related sarcopenia was partially antagonized.
Conclusion
These results indicated that NaB could ameliorate type 2 diabetes-related sarcopenia by activating IL-33-independent ILC2s/IL-13/STAT3 signaling pathway.
Introduction
Type 2 diabetes (T2DM) has emerged as one of the world’s fastest growing health challenges, causing life threatening, disabling and costly complications, and reducing life expectancy.Citation1 Skeletal muscle is also the target organ involved in T2DM.Citation2 Beyond microvascular and macrovascular complications, sarcopenia has been described as a new T2DM complication with a prevalence ranging from 7% to 29.3%.Citation3 Sarcopenia is a syndrome characterized by loss of skeletal muscle mass and muscle weakness or loss of physical function.Citation4 T2DM and sarcopenia deteriorate each other, being related to adverse outcomes such as frailty, disability, poor quality of life, and increased mortality.Citation5,Citation6 At present, there are no effective interventions to improve T2DM-related sarcopenia, especially in terms of drugs, and which hypoglycemic drugs are better suited for geriatric T2DM patients with sarcopenia remains undetermined.Citation7
Sodium butyrate (NaB), a short-chain fatty acid (SCFA) from microbiota metabolite, is a dietary component found in foods such as cheese and butter.Citation8 Butyrate is mostly produced in large amounts from dietary fiber after fermentation in the large intestine, and is reported to play a protective role against T2DM.Citation9 Dietary supplementation of NaB at 5% wt/wt could enrich the type I fiber in skeletal muscle and prevent development of insulin resistance and obesity in C57BL/6J mice fed with high fat diet (HFD).Citation10 NaB inhibited the diabetes-associated increase of histone deacetylases (HDACs) activity and improved the glucose homeostasis in rat with T2DM.Citation11 However, whether NaB affects T2DM-related sarcopenia is unknown.
Group 2 innate lymphoid cells (ILC2s) are integral regulators of type 2 immunity.Citation12 They are activated by molecular signals such as interleukin (IL)-25, IL-33, thymic stromal lymphopoietin (TSLP) and lipid mediators, and play a role in allergic diseases and metabolic diseases through the production of type 2 cytokines such as IL-5 and IL-13.Citation13 ILC2s reside in white adipose tissue and have a key role in the pathogenesis of T2DM.Citation14 ILC2s also have effects on skeletal muscle. They are present in skeletal muscle and contribute to the development of Duchenne muscular dystrophy (DMD).Citation15 Nevertheless, whether ILC2s are involved in the pathogenesis of T2DM-related sarcopenia has not been studied.
IL-13 and its downstream IL-13/STAT3 pathway is a crucial regulator of endurance capacity, hepatic glucose production controlment and cardiac protection.Citation16–18 ILC2s in skeletal muscle may serve as a source of IL-13–producing cells.Citation16 It has been reported that the IL-13/STAT3 axis controlled the metabolic program in skeletal muscle elicited by exercise training.Citation16 In this study, we investigated whether exogenous addition of NaB could ameliorate T2DM-related sarcopenia by ILC2s/IL-13/STAT3 pathway.
Materials and Methods
Animal Materials
Six-week-old male db/db mice with C57BL/6J background and wild type C57BL/6J (ViewSolid Biotech Co., Beijing, China) were raised in a specific pathogen-free (SPF) environment. Both C57BL/6J mice and db/db mice were fed with regular chow for one-week adaptive feeding.
Animal Experiments
Animal Models
As we knew, db/db mice were identified as an obese, diabetic mouse model.Citation19,Citation20 In order to confirm whether the 7-week-old db/db mouse could be considered an animal model of T2DM with sarcopenia, we carried out the following tests with C57BL/6J mice as controls. Intraperitoneal glucose tolerance test (IPGTT) was measured. The mice were weighed each week from 7 to 15 weeks. Skeletal muscle mass was evaluated by dural X-ray (DXA). The gastrocnemius weight to body weight ratio, forelimb grip strength, time of hanging grip test and treadmill running time and distance in each group were also measured.
Animal Groups and Interventions
To explore whether NaB could affect T2DM-related sarcopenia, 7-week-old C57BL/6J mice were randomly grouped into normal control (n = 10) and NaB group (150 mM in drinking water, n = 10). Age- and sex-matched wild-type db/db mice were randomly allocated as follows: (1) db/db+water group (n = 10); (2) db/db+NaB group: intervention group in which animals were orally treated with NaB in drinking water (150 mM, n = 10).
To elucidate the effects and potential mechanism of NaB on ILC2s, we applied anti-CD90.2 (Bioxcell, United States) to deplete ILC2s in the following study, in which animals were grouped as control group (db/db+NaB+PBS, n = 10) and depletion group (db/db+NaB+anti-CD90.2, n = 10). The depletion group was intraperitoneally injected with anti-CD90.2 (300 μg each time) every other day, while control group was intraperitoneally administered with the same dose of PBS. The flow chart is shown in .
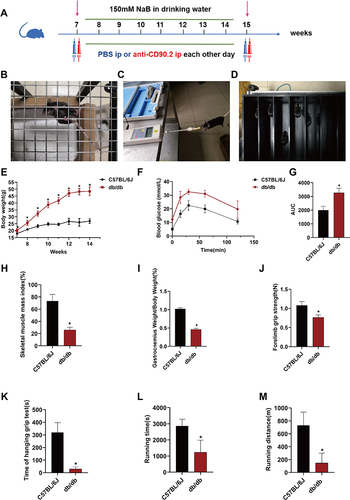
Figure 1 Seven-week-old db/db mice were animal model of T2DM-related sarcopenia. (A) The flow chart of ILC2s depletion test. (B) Hanging grid test. (C) Forelimb grip strength test. (D) Endurance running capacity test. (E) Body weight curve. (F) Intraperitoneal glucose tolerance test (IPGTT) curve. (G) Statistical analysis of area under the curve (AUC). (H) Statistical analysis of muscle mass index measured by dual energy X-ray absorptiometry (DXA). (I) Statistical analysis of gastrocnemius weight to body weight ratio. (J) Statistical analysis of forelimb grip strength. (K) Statistical analysis of time of hanging grip test. (L) Statistical analysis of treadmill exhaustion running distance. (M) Statistical analysis of treadmill exhaustive running time. Data are expressed as mean ± SEM (n = 10 in each group). *P < 0.05 vs C57BL/6J+water group.
Intraperitoneal Glucose Tolerance Test (IPGTT)
Mice were fasted overnight (from 4 pm to 8 am) prior to glucose tolerance test. Fasting blood glucose was measured and animals were injected with glucose at 2 g/kg body weight into the peritoneum. Blood glucose was measured at 15 min, 30 min, 60 min, 90 min and 120 min post-injection.
Skeletal Muscle Mass Measurement
Mice were anesthetized by intraperitoneal injection of 0.8% sodium pentobarbital. The mice were in prone position with their limbs stretched out and fixed to a foam board with tape, making sure that the spine was straight and the head was parallel to the sagittal plane. At the same time, the mouse’s tail should not cover any of the long bones. The mice were then scanned on the GE-Lunar Prodigy Advance DXA absorptiometry table. The skeletal muscle mass was then calculated automatically.
Muscle Strength Measurement
Hanging Grid Test
A 45×45 cm grid was placed on a 55-cm-high frame with a 5-cm-thick cushion under the grid. We placed each mouse at the center of the grid and then turned the grid upside down with the mouse head declining first (). Hanging time was recorded as the time until the mice fell. Each mouse was tested three times with a >30-min interval between tests, and the hanging time was recorded and averaged.
Forelimb Grip Strength Test
The dynamometer was placed horizontally. The operator grasped the mouse tail and the mice were trained to grasp the dynamometer with the front paws (). The mice were then gently pulled backward until they released the dynamometer. Forelimb grip strength of each mouse was tested three times, and the three measured values were recorded and averaged.
Endurance Running Capacity Assessment
As shown in , the mice were placed on the treadmill. Before the test, the mice underwent training on the treadmill for 10 min, then rested for 15 min. The training speed was 10 m/min and 5 m/min for C57BL/6J and db/db mice, respectively, with a slope angle of 20°. The running was started at 8 m/min with a slope angle of 20°, and then the speed was increased by 2 m/min every 2 min. Because the mice had a risk of being stuck at the junction of the treadmill belt and the electrodes when reaching the upper limit speed, the maximum running speed of the C57BL/6J mice was set at 20 m/min to 22 m/min, while the maximum movement speed of the db/db mice was set at 10 m/min to 12 m/min. The failure to climb for 3 consecutive electrical stimulations was defined as exhaustion, and the exercise time and exercise distance of the mice were recorded after exhaustion.
Serum Cytokines Measurement
The blood from the mice was centrifuged at 3000 rpm for 10 min at 4°C to obtain supernatant. Assays of mouse IL-13 (BMS6015, ebioscience, United States) and IL-33 (KE10054, Proteintech Group, United States) levels in serum were performed using ELISA kits according to manufacturer instructions.
Preparation of the Muscle Single-Cell Suspension and Flow Cytometry Analysis
Single cells were isolated from gastrocnemius, quadriceps, tibialis anterior, and biceps femoris of the mice. Muscles were chopped and digested with 0.4% collagenase II (17101015, Invitrogen, United States) and 300 μg/mL DNAse I (11284932001, Sigma, United States), 2% FBS (16140089, Gibco, United States) in DMEM (21063045, Gibco, United States) for 45 min in a tube horizontally placed in 37°C water bath with gentle shaking and digesting for 40 min. After filtering through a 70 μm cell strainer, the cell suspension was centrifuged at 400×g for 10 min at 4°C. Cells were washed with 2% FBS in DMEM and resuspend in 6 mL of 40% Percoll (P8370, Solarbio, China), then overlaid onto 60% Percoll (P8370, Solarbio, China) for centrifugation at 400×g for 25 min. After centrifugation, leukocytes were band at the 40–80% interface. All the white materials in the interface were taken with a clean pipette and transferred to an another clean tube. Harvested cells were stained with APC/Cy7 anti-mouse CD45 antibody (1.25 μL/test, 103116, Biolegend, United States), FITC anti-mouse Lineage Cocktail with Isotype Ctrl (20 μL/test, 133302, Biolegend, United States), PE anti-mouse CD127 (IL-7Rα) (1.25 μL/test, PE-65093, Proteintech group, United States), APC anti-mouse CD278 (ICOS) antibody (1.25 μL/test, 107712, Biolegend, United States), PE/Cy7 anti-mouse CD25 antibody (5 μL/test, 102016, Biolegend, United States). Stained cells were analyzed on a Beckman Gallios Cell Analyzer (Beckman, United States).
Preparation of the Spleen Single-Cell Suspension and Flow Cytometry Analysis
The spleen of mice was isolated, then filtered with a 100 μm cell strainer. During this process, 5 mL of PBS was added to prepare a single splenocyte suspension. The single splenocyte suspension was gently add into a 15 mL of sterile centrifuge tube with 5 mL of lymphocyte separation solution (17-1440-02, GE Healthcare, United States) pre-added. After centrifugation at 2500 rpm for 30 min at 4°C, the middle buffy coat layer was sucked out and mixed with equal volume of PBS. Then the mixture was centrifuged at 1500 rpm for 10 min at 4°C and the supernatant was discarded. A volume of 100 μL of flow cytometry staining buffer was added to resuspend the cell pellet, and the cells were counted to adjust the cell concentration to 1×10⁶/flow tube. And then the fluorescence-labeled antibodies were added as in the previous step.
Protein Extraction and Western Blotting Assay
Total proteins from tissue were extracted by radioimmunoprecipitation assay (RIPA) lysis buffer (CW2333, CWBIO, China) mixed with phenyl methane sulfonyl fluoride (PMSF) (EA0005, SparkJade, China) and phosphatase inhibitors (CW2383S, CWBIO, China) (1000:1:1). Protein samples were separated by 10% sodium dodecyl sulfate-polyacrylamide gel electrophoresis (SDS-PAGE) and then transferred to PVDF membranes (pore size 0.45 μm, Millipore, United States) by wet transfer. Membranes were incubated with primary antibodies in TBST buffer at 4°C overnight. Subsequently, membranes were incubated with secondary antibodies at room temperature for 1 h. Finally, ECL signal was visualized by Amersham Imager 680 (GE, United States). Tubulin (1:5000, 10094-1-AP, Proteintech Group, United States) was applied as control. Primary antibodies for immunoblotting were including Fast MyHC (1:1000, ab91506, Abcam, United States), Slow MyHC (1:1000, 22280-1-AP, Proteintech Group, United States), Atrogin 1 (1:2000, ab168372, Abcam, United States), MuRF 1 (1:1000, 55456-1-AP, Proteintech Group, United States), STAT3 (1:1000, 12640S, Cell Signaling Technology, United States), P-STAT3 (1:1000, 9145T, Cell Signaling Technology, United States), GATA-3 (1:1000, ab199428, Abcam, United States), and PGC-1α (1:1000, 66369-1-Ig, Proteintech Group, United States). Relative expression of protein was analyzed by Image-J software (National Institutes of Health, United States). All experiments were repeated three times.
Hematoxylin-Eosin (HE) and Skeletal Muscle Fiber Type Immunofluorescence Staining
HE staining was performed to observe the morphological changes and calculate the average cross-sectional area (CSA) of muscle cells. Briefly, paraffin-embedded gastrocnemius muscle sections (5 μm) were deparaffinized, progressively hydrated and stained with hematoxylin and eosin. Myofiber CSA was analyzed by Image J.
Immunofluorescence staining of fast and slow MyHC was performed to calculate the myofiber CSA and the relative content of fast and slow muscle cells. Briefly, skeletal muscle sections were incubated in EDTA, pH 8.0 for antigen clearance. Then the sections were blocked with 3% H2O2 solution and bovine serum albumin (BSA) (GC305010, Servicebio, China) at room temperature for 30 min. Slides were washed with PBS (pH 7.4) for 3 times, each time for 5min. For staining of myosin heavy chain isoforms, sections were stained overnight with mouse Fast MyHC (ab91506, 1:3000, Abcam, United States). After washing, the secondary antibodies HRP–conjugated goat a-rabbit IgG2b (GB23303, 1:500, Servicebio, China) were incubated with sections for 50 min. Slides were incubated with CY3-TSA (G1223, Servicebio, China). After washing, the blocking process was repeated. For staining of myosin heavy chain isoforms, sections were stained overnight with mouse Slow MyHC (ab234431, 1:200, Abcam, United States). After washing, the secondary antibodies Alexa Fluor 488–conjugated goat a-rabbit IgG2b (GB25303, 1:400, Servicebio, China) were incubated with sections for 50 min. Slides were mounted with anti-fade mounting solution with nuclei stained by DAPI and sealed with nail polish. Image analysis was performed using Image J.
Statistical Analyses
Statistical analyses were performed by the software of IBM SPSS 20.0 (SPSS Inc., Chicago, Illinois, USA). Data were presented as the mean ± standard error (SEM). Two-way ANOVA was used to analyze the two main influencing factors, T2DM and NaB. Comparisons between two groups were performed using independent samples t-test. Differences between multiple groups were analyzed by one-way ANOVA and LSD post-hoc analysis. P<0.05 was considered statistically significant.
Results
The Establishment of Animal Model for T2DM-Related Sarcopenia
The body weight of db/db mice aged from 7 weeks to 15 weeks was significantly higher than that of C57BL/6J mice (all P<0.05) (). Compared with C57BL/6J mice, IPGTT of db/db mice was significantly impaired (P<0.05) ( and ). The results showed that obesity and diabetes emerged in 7-week-old db/db mice.
As the European working group on sarcopenia in older people 2 (EWGSOP2) recommended, the diagnosis of sarcopenia was based on low skeletal muscle mass, low muscle strength, and poor physical performance.Citation21 Skeletal muscle mass measured by DXA (SMM) adjusted by weight, namely skeletal muscle mass index (SMI), was significantly reduced in db/db mice compared with C57BL/6J mice (P<0.05) (), so did the gastrocnemius weight to body weight ratio (). The muscle strength parameters including forelimb grip strength and the time of hanging grip test of db/db mice were significantly lower than those of C57BL/6J mice (both P<0.05) ( and ). The treadmill running time and distance of db/db mice were significantly shorter compared with C57BL/6J mice, indicating impaired physical performance (both P<0.05) ( and ).
All these results demonstrated that the 7-weeks-old db/db mice could be used as the animal model for T2DM-related sarcopenia.
NaB Up-Regulated ILC2s in Spleen and Skeletal Muscle in Correspondence with Serum IL-13
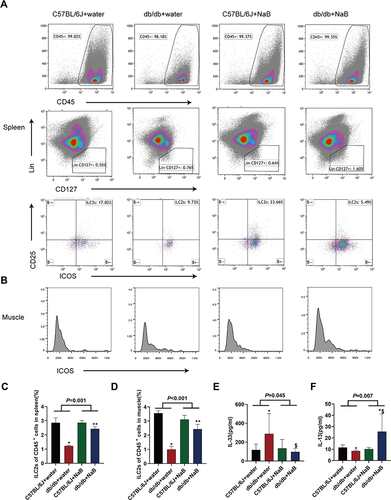
The ILC2s markers used for flow cytometry analysis were Lin−CD45+ICOS+CD127+CD25+ (). As shown in and , the ILC2s level in spleen and skeletal muscle of db/db mice were investigated. Compared with C57BL/6J+water group, the ILC2s levels both in spleen and muscle of db/db mice were decreased (both P<0.05). NaB up-regulated the ILC2s levels both in spleen and muscle of db/db mice (both P<0.01) ( and ). Serum IL-33 level significantly increased in db/db mice compared with C57BL/6J mice, while after NaB treatment, serum IL-33 level of db/db mice significantly decreased (P<0.05) (). Serum IL-13 level significantly decreased in db/db mice compared with C57BL/6J mice, while after NaB treatment, serum IL-13 level of db/db mice significantly increased (P<0.05) (). As IL-13 was mainly secreted by ILC2s, we could conclude that its change was consistent with ILC2s after the intervention with NaB.
Figure 2 NaB up-regulated ILC2s in the spleen and skeletal muscle in accordance with the level of serum IL-13 of db/db mice. (A) and (C) Changes of ILC2s in the spleen of the mice. (B) and (D) Changes of ILC2s in the muscle of the mice. (E) Serum IL-33 level measured by ELISA. (F) Serum IL-13 level measured by ELISA. Data are expressed as mean ± SEM (n = 4–10 in each group). *P < 0.05 vs C57BL/6J+water group; $P < 0.05 vs db/db+water group; **P < 0.01 vs db/db+water group.
Anti-CD90.2 were applied to elucidate the effects of NaB on ILC2s. As shown in Figure S1A and B, the depletion effect of anti-CD90.2 on ILC2s was confirmed by flow cytometry. The ILC2s levels both in spleen and muscle of db/db depletion group were significantly decreased (Figure S1C and D). Serum IL-13 level significantly decreased in db/db depletion group (P<0.05), while serum IL-33 level exhibited no change (Figure S1E and F).
These results demonstrated that NaB could up-regulate ILC2s in spleen and skeletal muscle in accordance with serum IL-13.
NaB Ameliorated Gastrocnemius Myofiber Atrophy
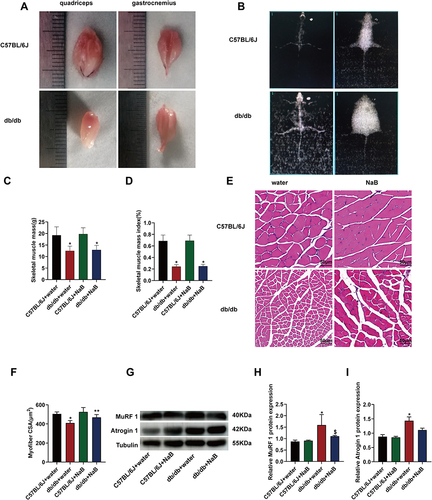
As shown in , the quadriceps and gastrocnemius tissue of db/db mice appeared smaller than those of C57BL/6J mice. We measured skeletal muscle mass by DXA (). The result showed that, SMM and SMI measured by DXA were significantly reduced in db/db mice compared with C57BL/6J mice, while NaB treatment showed no influence on this decrease ( and ). For HE staining, the results showed that the CSA of myofibers in db/db mice was much smaller than C57BL/6J mice (P<0.05), while NaB treatment blocked this decrease (P<0.01) ( and ). The results of Western blot confirmed the HE staining results. The expressions of MuRF1 and Atrogin 1 protein in skeletal muscle of db/db mice were significantly increased, while the expression of MuRF1 protein was significantly decreased after treatment with NaB (P<0.05) ().
Figure 3 NaB ameliorated gastrocnemius myofiber atrophy of db/db mice without affecting muscle mass. (A) Appearance of exemplary quadriceps and gastrocnemius from the 15-week-old C57BL/6J and db/db mice. (B) The dual energy X-ray absorptiometry (DXA) image of C57BL/6J and db/db mice at 15-week. (C) Statistical analysis of muscle mass measured by the dual energy X-ray absorptiometry (DXA) in 4 groups of mice. (D) Statistical analysis of muscle mass index measured by DXA in 4 groups of mice. (E) Gastrocnemius myofibers from the 4 groups with HE staining. (F) Statistical analysis of cross-sectional area (CSA) of myofiber. (G) Protein expression of MuRF 1 and Atrogin 1 in the gastrocnemius of mice in the 4 groups. (H) and (I) MuRF 1, Atrogin 1 and tubulin were detected. The histogram showed the grayscale value ratio. Data are expressed as mean ± SEM (n = 6 in each group). *P < 0.05 vs C57BL/6J+water group; **P < 0.01 vs db/db+water group; $P < 0.05 vs db/db+water group. The bar represents 50 μm.
The CSA of myofibers in db/db depletion group was much smaller than NaB group (P<0.05) (Figure S2A and B). SMM and SMI exhibited no change in db/db depletion group compared with NaB group (both P<0.05) (Figure S2C and D). The expression of MuRF1 protein in skeletal muscle of db/db depletion group was significantly increased (P<0.05), while the expression of Atrogin 1 protein showed no significant difference (Figure S2E–G).
These results demonstrated that NaB treatment could ameliorated gastrocnemius myofiber atrophy.
NaB Alleviated Impaired Exercise Capacity in Db/Db Mice Without Affecting Muscle Strength
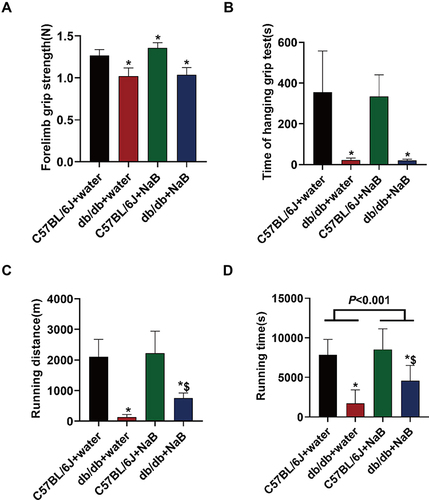
As shown in , we examined muscle strength and exercise capacity in all the mice. The results showed that forelimb grip strength and time of hanging grip test in db/db mice were obviously reduced compared with C57BL/6J mice (P<0.05). After NaB treatment, db/db mice exhibited no change in forelimb grip strength and time of hanging grip test ( and ). The running time and running distance in db/db mice were obviously reduced compared with C57BL/6J mice (P<0.05). After NaB treatment, the running time and running distance in db/db mice were obviously improved ( and ).
Figure 4 NaB alleviated impaired exercise capacity in db/db mice without affecting muscle strength. (A) Statistical analysis of forelimb grip strength in 4 groups of mice. (B) Statistical analysis of time of hanging grip test in 4 groups of mice. (C) Statistical analysis of treadmill exhaustion running distance in 4 groups of mice. (D) Statistical analysis of treadmill exhaustive running time in four groups of mice. Data are expressed as mean ± SEM (n = 10 in each group). *P < 0.05 vs C57BL/6J+water group; $P < 0.05 vs db/db+water group.
The time of hanging grip test, running time and running distance apparently ameliorated in db/db depletion group compared with those in NaB group (all P<0.05), while forelimb grip strength exhibited no change in db/db depletion group (Figure S3A–D).
These results demonstrated that NaB could alleviate impaired exercise capacity in db/db Mice without muscle strength being affected.
NaB Improved IPGTT of Db/Db Mice
Compared with C57BL/6J mice, IPGTT of db/db mice was significantly impaired (P<0.05). After NaB treatment, the IPGTT remarkably ameliorated in db/db mice (P<0.05) ( and ), whereas the IPGTT exhibited no change in db/db depletion group compared with NaB group (P<0.05) (Figure S3E and F). As shown in , NaB had no effect on body weight, random blood glucose and IPGTT in C57BL/6J mice.
Figure 5 NaB improved IPGTTof db/db mice. (A) Intraperitoneal glucose tolerance test (IPGTT) curve. (B) Statistical analysis of area under the curve (AUC). (C) Body weight curve. (D) Random blood glucose curve. Data are expressed as mean ± SEM (n = 10 in each group). *P < 0.05 vs C57BL/6J+water group; $P < 0.05 vs db/db+water group.
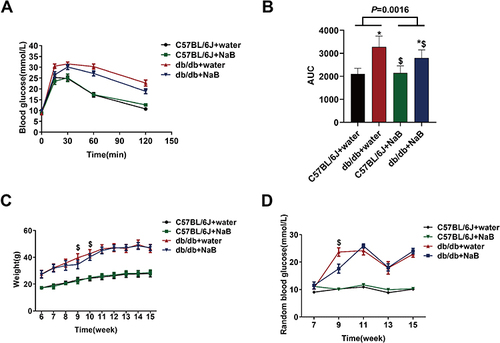
At the beginning of the experiment, due to the special smell, NaB caused a transient decrease in the body weight and random blood sugar of db/db mice, which had no effect at other detection time points ( and ). Compared with NaB group, body weight at each detection point exhibited no change in db/db depletion group (all P<0.05) (Figure S3G), while random blood sugar showed no change in db/db depletion group except at the 11 weeks (P<0.05) (Figure S3H).
These results demonstrated that NaB could improve the IPGTT of db/db mice.
NaB Promoted Skeletal Muscle Fiber Type Switching in Db/Db Mice
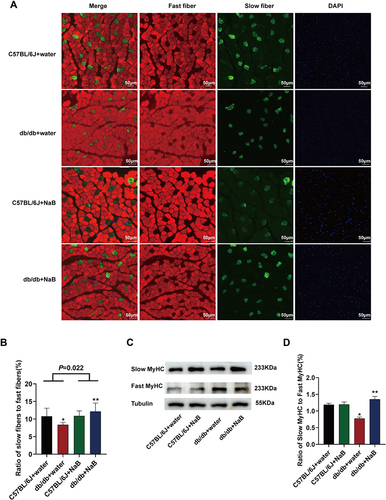
As was known, muscle fiber type was critical for exercise capacity. As shown in , to explore the mechanism for exercise capacity improvement, we stained skeletal muscle fiber type by immunofluorescence. The ratio of slow fibers/fast fibers in db/db mice was lower than that of C57BL/6J mice. After NaB treatment, the ratio of slow fibers/fast fibers remarkably ameliorated in db/db mice (P<0.01) ( and ). The results of Western blot confirmed the immunofluorescence staining results. The ratio of protein expression of slow MyHC/fast MyHC presented consistent changes as the ratio of slow fibers/fast fibers (P<0.01) ( and ).
Figure 6 NaB promoted skeletal muscle fiber type switching in db/db mice. (A) Immunofluorescence staining of fast-twitch muscle fibers and slow-twitch muscle fibers. (B) The histogram showed the ratio of slow to fast muscle fibers. (C) Protein expression of Slow MyHC and Fast MyHC in the gastrocnemius of mice in the 4 groups. (D) Statistical analysis of the ratio of Slow MyHC/Fast MyHC protein expression. Data are expressed as mean ± SEM (n = 6 in each group). *P < 0.05 vs C57BL/6J+water group; **P < 0.01 vs db/db+water group. The bar represents 50 μm.
As shown in Figure S4A and B, the ratio of slow fibers/fast fibers apparently decreased in db/db depletion group compared with NaB group (P<0.05), while the ratio of protein expression of slow MyHC/fast MyHC exhibited same change in db/db depletion group (Figure S4C and D).
These results demonstrated that NaB could promote skeletal muscle fiber type switching in db/db mice.
NaB Acted on ILC2s to Induce Slow Muscle Fiber Generation Through IL-13/STAT3 Pathway
According to the above experiments, NaB stimulated ILC2s to induce the production of IL-13. So we investigated whether NaB could promote skeletal muscle fiber type switching by IL-13/STAT3 pathway. ILC2s were defined by the transcription factor GATA-3. The protein expression of GATA-3 decreased in db/db mice than in C57BL/6J mice, and after NaB treatment, GATA-3 expression remarkably ameliorated in db/db mice (all P<0.05) (). The GATA-3 expression apparently reduced in db/db depletion group compared with NaB group (P<0.05) (Figure S5A).
Figure 7 NaB acted on ILC2s to induce slow muscle fiber generation through the IL-13/STAT3 pathway. (A) Protein expression of GATA-3 in the gastrocnemius of mice in the 4 groups and the histogram showed the grayscale value ratio. (B) Protein expression of P-STAT3 and STAT3 in the gastrocnemius of mice in the 4 groups and the histogram showed the grayscale value ratio of P-STAT3/STAT3. (C) Protein expression of PGC-1α in the gastrocnemius of mice in the 4 groups and the histogram showed the grayscale value ratio. Data are expressed as mean ± SEM (n = 6 in each group). *P < 0.05 vs C57BL/6J+water group; $P < 0.05 vs db/db+water group.
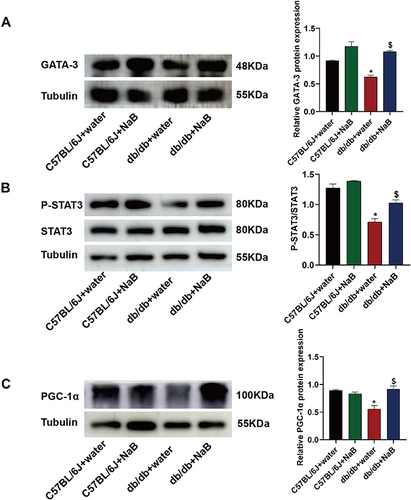
The protein expression ratio of P-STAT3/STAT3 decreased in db/db mice than in C57BL/6J mice. After NaB treatment, ratio of P-STAT3/STAT3 remarkably ameliorated in db/db mice (P<0.05) (). The ratio of P-STAT3/STAT3 apparently reduced in db/db depletion group compared with NaB group (P<0.05) (Figure S5B).
Compared with C57BL/6J mice, the protein expression of PGC-1α decreased in db/db mice. After NaB treatment, PGC-1α expression remarkably ameliorated in db/db mice (P<0.05) (). The PGC-1α expression apparently reduced in db/db depletion group compared with NaB group (P<0.05) (Figure S5C).
These results demonstrated that NaB could act on ILC2s to induce slow muscle fiber generation through IL-13/STAT3 pathway.
Discussion
NaB, as one kind of SCFA, exerts multiple beneficial effects at both the intestinal level and extraintestinal level.Citation22,Citation23 In recent years, especially a wide spectrum of positive effects exerted by NaB at the extraintestinal level has suggested a high potential for a therapeutic use in human medicine, including anti-atherosclerosis, inhibition of inflammation and antitumor properties etc.Citation24–26 However, the role of NaB in sarcopenia has not been reported. Db/db mice are widely accepted as one kind of T2DM animal model.Citation19 In this study, we found that db/db mice were an animal model of T2DM-related sarcopenia due to its significantly reduced muscle mass, muscle strength and exercise capacity. The proportion of ILC2s in db/db mice was significantly reduced, and NaB partially reversed the exercise capacity of db/db mice by increasing the proportion of slow muscle fibers through up-regulating ILC2s.
Beyond microvascular and macrovascular complications, sarcopenia has been described as a new diabetes complication, due to the heavy impact that sarcopenia may have on physical and psychosocial health of diabetic patients.Citation23,Citation27 Sarcopenia in T2DM is secondary sarcopenia.Citation4 Sarcopenia may mediate the higher diabetes-related disability risk, thus affecting quality of life.Citation28 Recently, studies showed that the regulation of both muscle mass and muscle strength was independent and that distinct pathways are responsible for each symptom.Citation29 As we know, functional muscle strength tests are essential for clear diagnosis of sarcopenia.Citation21 However, a large body of studies based on skeletal muscle mass or lean body mass only have been performed. Diabetes-related alterations consequently resulted in the phenotype of sarcopenia with the main characteristics of the loss in muscle mass and strength accompanied by changes in muscle composition.Citation30 In this study, we focused on not only the changes in muscle mass in T2DM, but also the changes in muscle function.
NaB improved glucose tolerance as determined by IPGTT and exercise capacity of db/db mice. Although study reported that butyrate increased myofiber CSA stained by HE and ameliorated skeletal muscle atrophy in db/db mice,Citation31 which was consistent with our findings, we demonstrated that SMM and SMI measured by DXA did not change at the overall level after NaB treatment. In the revised guidelines, muscle strength comes to the forefront, as it is recognized that strength is better than mass in predicting adverse outcomes.Citation21 EWGSOP2 uses low muscle strength as the primary parameter of sarcopenia; when low muscle strength, low muscle quantity/quality and low physical performance are all detected, sarcopenia is considered severe. Hence, db/db mice had suffered from severe sarcopenia. As NaB was applied only for a short period of time, so the overall level of muscle mass did not change significantly in the experiment. Still, the improvement in physical performance of db/db mice by NaB was surprising, which was more important than the improvement in muscle mass.
In the present study, NaB alleviated reduced exercise tolerance in db/db mice, which might be related to muscle fiber type switching. Skeletal muscle fiber type was related to body exercise ability.Citation32,Citation33 Skeletal muscle is comprised of type I and II fibers. Type I fibers (slow-twitch) possess greater oxidative capacity and are mainly comprised of the contractile protein myosin heavy chain (MHC) 1.Citation34 Type II fibers (fast twitch) possess higher glycolytic capacity and can be subdivided into type IIA and type IIB fibers, which are mainly made up of MCH2a and MHC2x, respectively.Citation34 Individuals with a high proportion of type I muscle fibers may have an advantage in endurance sports. We demonstrated that the exercise capacity of db/db mice was impaired. This phenomenon has also been found in T2DM patients with sarcopenia.Citation35 We found the proportion of slow muscle fibers in db/db mice was significantly reduced, which might be related to decreased muscle strength and exercise capacity. An obvious decrease in the amount of type I fibers in T2DM and considerable phenotypic changes in these slow-twitch fibers leading to considerable functional impairments have been reported.Citation30 Interestingly, we found in this study that, NaB improved the exercise capacity of db/db mice by increasing the proportion of slow-twitch muscle fibers.
For the first time, we found that proportion of ILC2s in db/db mice was significantly reduced, and NaB partially reversed exercise capacity by modulating ILC2s in db/db mice. ILC2s might play an important role in specific regulation of the two type muscle fibers switch. ILC2s orchestrated protective type II immunity and have been implicated in various immune disorders.Citation36 Type 2 innate signals IL-4/IL-13 played their role in acute skeletal muscle injury repair.Citation37 ILC2s have been shown to be present in muscle tissue, but there was no report on the role of ILC2s in the pathogenesis of sarcopenia.Citation15 Jenna M Kastenschmidt et al reported that ILC2s were the principal regulators of muscle eosinophils during Duchenne muscular dystrophy (DMD).Citation15 A primary source of IL-13 was tissue-resident ILC2s.Citation16 IL-13 might be a pivotal factor in the regulation of muscle fiber type switching by ILC2s. IL-13 drived metabolic conditioning of muscle to endurance exercise. The canonical downstream transcription factor of IL-13 receptors was STAT6, but it was not expressed in muscle.Citation16 Thus, we hypothesized and demonstrated that, NaB ameliorated T2DM-related sarcopenia by promoting IL-13 expression. One of the upstream signals of ILC2s was IL-33. IL-33/ILC2s axis played a protective role in cardiac fibrosis, cutaneous wound healing and progressive glomerulosclerosis.Citation38–40 However, NaB stimulated the release of IL-13, but reduced the cytokine of IL-33. NaB acted on ILC2s through an IL-33-independent pathway. In addition, the PGC-1α, an important factor for mitochondrial biogenesis and slow oxidative phenotype regulation,Citation32,Citation41 was also found to be decreased in db/db mice. NaB treatment reverted the PGC-1α expression through ILC2s/IL-13/STAT3 pathway and increased the proportion of slow-twitch fibers.
Conclusions
These results suggested that NaB could ameliorate T2DM-related sarcopenia by activating IL-33-independent ILC2s/IL-13/STAT3 signaling pathway. ILC2s might be an interesting target to develop innovative strategies for sarcopenia in T2DM, and NaB could exert a marked therapeutic effect in alleviating glucose tolerance and exercise capacity.
Data Sharing Statement
All the data used to support the findings of this study are available from the corresponding author Zhihao Wang on reasonable request.
Ethical Approval
The animal protocol was approved by the Animal Ethics Committee of Qilu Hospital, Shandong University (Approval No. KYLL-2021(KS)-198). All the animals used in this study were handled according to the Guide for the Care and Use of Laboratory Animals published by the National Institutes of Health (NIH Publications No. 8023, revised 1978).
Disclosure
The authors report no conflicts of interest in this work.
Additional information
Funding
References
- Sun H, Saeedi P, Karuranga S, et al. IDF Diabetes Atlas: global, regional and country-level diabetes prevalence estimates for 2021 and projections for 2045. Diabetes Res Clin Pract. 2022;183:109119. doi:10.1016/j.diabres.2021.109119
- Leenders M, Verdijk LB, van der Hoeven L, et al. Patients with type 2 diabetes show a greater decline in muscle mass, muscle strength, and functional capacity with aging. J Am Med Dir Assoc. 2013;14(8):585–592. doi:10.1016/j.jamda.2013.02.006
- Izzo A, Massimino E, Riccardi G, et al. A narrative review on sarcopenia in type 2 diabetes mellitus: prevalence and associated factors. Nutrients. 2021;13(1):183. doi:10.3390/nu13010183
- Cruz-Jentoft AJ, Sayer AA. Sarcopenia. Lancet. 2019;393(10191):2636–2646. doi:10.1016/S0140-6736(19)31138-9
- Mesinovic J, Zengin A, De Courten B, et al. Sarcopenia and type 2 diabetes mellitus: a bidirectional relationship. Diabetes Metab Syndr Obes. 2019;12:1057–1072. doi:10.2147/DMSO.S186600
- Mesinovic J, Scott D. Sarcopenia and diabetes mellitus: evidence for a bi-directional relationship. Eur Geriatr Med. 2019;10(5):677–680. doi:10.1007/s41999-019-00230-z
- Ma XY, Chen FQ. Effects of anti-diabetic drugs on sarcopenia: best treatment options for elderly patients with type 2 diabetes mellitus and sarcopenia. World J Clin Cases. 2021;9(33):10064–10074. doi:10.12998/wjcc.v9.i33.10064
- Xu YH, Gao CL, Guo HL, et al. Sodium butyrate supplementation ameliorates diabetic inflammation in db/db mice. J Endocrinol. 2018;238(3):231–244. doi:10.1530/JOE-18-0137
- Arora T, Tremaroli V. Therapeutic potential of butyrate for treatment of type 2 diabetes. Front Endocrinol. 2021;12:761834. doi:10.3389/fendo.2021.761834
- Gao Z, Yin J, Zhang J, et al. Butyrate improves insulin sensitivity and increases energy expenditure in mice. Diabetes. 2009;58(7):1509–1517. doi:10.2337/db08-1637
- Chriett S, Zerzaihi O, Vidal H, et al. The histone deacetylase inhibitor sodium butyrate improves insulin signalling in palmitate-induced insulin resistance in L6 rat muscle cells through epigenetically-mediated up-regulation of Irs1. Mol Cell Endocrinol. 2017;439:224–232. doi:10.1016/j.mce.2016.09.006
- Bartemes KR, Kita H. Roles of innate lymphoid cells (ILCs) in allergic diseases: the 10-year anniversary for ILC2s. J Allergy Clin Immunol. 2021;147(5):1531–1547. doi:10.1016/j.jaci.2021.03.015
- Kabata H, Moro K, Koyasu S. The group 2 innate lymphoid cell (ILC2) regulatory network and its underlying mechanisms. Immunol Rev. 2018;286(1):37–52. doi:10.1111/imr.12706
- Painter JD, Akbari O. Type 2 innate lymphoid cells: protectors in type 2 diabetes. Front Immunol. 2021;12:727008. doi:10.3389/fimmu.2021.727008
- Kastenschmidt JM, Coulis G, Farahat PK, et al. A stromal progenitor and ILC2 niche promotes muscle eosinophilia and fibrosis-associated gene expression. Cell Rep. 2021;35(2):108997. doi:10.1016/j.celrep.2021.108997
- Knudsen NH, Stanya KJ, Hyde AL, et al. Interleukin-13 drives metabolic conditioning of muscle to endurance exercise. Science. 2020;368(6490):6490. doi:10.1126/science.aat3987
- O’Meara CC, Wamstad JA, Gladstone RA, et al. Transcriptional reversion of cardiac myocyte fate during mammalian cardiac regeneration. Circ Res. 2015;116(5):804–815. doi:10.1161/CIRCRESAHA.116.304269
- Stanya KJ, Jacobi D, Liu S, et al. Direct control of hepatic glucose production by interleukin-13 in mice. J Clin Invest. 2013;123(1):261–271. doi:10.1172/JCI64941
- Ferreira GS, Veening-Griffioen DH, Boon WPC, et al. Comparison of drug efficacy in two animal models of type 2 diabetes: a systematic review and meta-analysis. Eur J Pharmacol. 2020;879:173153. doi:10.1016/j.ejphar.2020.173153
- Sharma K, McCue P, Dunn SR. Diabetic kidney disease in the db/db mouse. Am J Physiol Renal Physiol. 2003;284(6):F1138–F1144. doi:10.1152/ajprenal.00315.2002
- Cruz-Jentoft AJ, Bahat G, Bauer J, et al. Sarcopenia: revised European consensus on definition and diagnosis. Age Ageing. 2019;48(1):16–31. doi:10.1093/ageing/afy169
- Canani RB, Costanzo MD, Leone L, et al. Potential beneficial effects of butyrate in intestinal and extraintestinal diseases. World J Gastroenterol. 2011;17(12):1519–1528. doi:10.3748/wjg.v17.i12.1519
- Dang G, Wu W, Zhang H, et al. A new paradigm for a new simple chemical: butyrate & immune regulation. Food Funct. 2021;12(24):12181–12193. doi:10.1039/d1fo02116h
- Xiao Y, Guo Z, Li Z, et al. Role and mechanism of action of butyrate in atherosclerotic diseases: a review. J Appl Microbiol. 2021;131(2):543–552. doi:10.1111/jam.14906
- Lee C, Kim BG, Kim JH, et al. Sodium butyrate inhibits the NF-kappa B signaling pathway and histone deacetylation, and attenuates experimental colitis in an IL-10 independent manner. Int Immunopharmacol. 2017;51:47–56. doi:10.1016/j.intimp.2017.07.023
- Liu L, Li L, Min J, et al. Butyrate interferes with the differentiation and function of human monocyte-derived dendritic cells. Cell Immunol. 2012;277(1–2):66–73. doi:10.1016/j.cellimm.2012.05.011
- Wiedmer P, Jung T, Castro JP, et al. Sarcopenia - Molecular mechanisms and open questions. Ageing Res Rev. 2021;65:101200. doi:10.1016/j.arr.2020.101200
- Gregg EW, Menke A. Diabetes and disability. In: Cowie CC, Casagrande SS, editors. Diabetes in America. 3rd ed. Bethesda (MD): National Institute of Diabetes and Digestive and Kidney Diseases; 2018.
- Mitchell WK, Williams J, Atherton P, et al. Sarcopenia, dynapenia, and the impact of advancing age on human skeletal muscle size and strength; a quantitative review. Front Physiol. 2012;3:260. doi:10.3389/fphys.2012.00260
- Oberbach A, Bossenz Y, Lehmann S, et al. Altered fiber distribution and fiber-specific glycolytic and oxidative enzyme activity in skeletal muscle of patients with type 2 diabetes. Diabetes Care. 2006;29(4):895–900. doi:10.2337/diacare.29.04.06.dc05-1854
- Tang G, Du Y, Guan H, et al. Butyrate ameliorates skeletal muscle atrophy in diabetic nephropathy by enhancing gut barrier function and FFA2-mediated PI3K/Akt/mTOR signals. Br J Pharmacol. 2022;179(1):159–178. doi:10.1111/bph.15693
- Duan Y, Li F, Tan B, et al. Metabolic control of myofibers: promising therapeutic target for obesity and type 2 diabetes. Obes Rev. 2017;18(6):647–659. doi:10.1111/obr.12530
- Qaisar R, Bhaskaran S, Van Remmen H. Muscle fiber type diversification during exercise and regeneration. Free Radic Biol Med. 2016;98:56–67. doi:10.1016/j.freeradbiomed.2016.03.025
- Schiaffino S, Reggiani C. Fiber types in mammalian skeletal muscles. Physiol Rev. 2011;91(4):1447–1531. doi:10.1152/physrev.00031.2010
- Fang ZY, Sharman J, Prins JB, et al. Determinants of exercise capacity in patients with type 2 diabetes. Diabetes Care. 2005;28(7):1643–1648. doi:10.2337/diacare.28.7.1643
- Lloyd CM, Snelgrove RJ. Type 2 immunity: expanding our view. Sci Immunol. 2018;3(25). doi:10.1126/sciimmunol.aat1604
- Heredia JE, Mukundan L, Chen FM, et al. Type 2 innate signals stimulate fibro/adipogenic progenitors to facilitate muscle regeneration. Cell. 2013;153(2):376–388. doi:10.1016/j.cell.2013.02.053
- Chen WY, Wu YH, Tsai TH, et al. Group 2 innate lymphoid cells contribute to IL-33-mediated alleviation of cardiac fibrosis. Theranostics. 2021;11(6):2594–2611. doi:10.7150/thno.51648
- Rak GD, Osborne LC, Siracusa MC, et al. IL-33-dependent group 2 innate lymphoid cells promote cutaneous wound healing. J Invest Dermatol. 2016;136(2):487–496. doi:10.1038/JID.2015.406
- Riedel JH, Becker M, Kopp K, et al. IL-33-mediated expansion of type 2 innate lymphoid cells protects from progressive glomerulosclerosis. J Am Soc Nephrol. 2017;28(7):2068–2080. doi:10.1681/ASN.2016080877
- Schuler M, Ali F, Chambon C, et al. PGC1alpha expression is controlled in skeletal muscles by PPARbeta, whose ablation results in fiber-type switching, obesity, and type 2 diabetes. Cell Metab. 2006;4(5):407–414. doi:10.1016/j.cmet.2006.10.003