

Abstract
Introduction
An assay to determine glucocorticoid (GC) responsiveness in humans could be used to monitor GC non-responsiveness in states of GC insufficiency and could provide a tool to adapt GC treatment to individual patients. We propose an ex vivo assay to test GC responsiveness in peripheral leukocytes. The assay was evaluated in a human experimental model of surgery-induced inflammation.
Patients and methods
Changes in expression of the GC-regulated genes GILZ, IL1R2, FKBP5, and HLA-DR and glucocorticoid receptor alpha (GRα) were determined by reverse transcriptase quantitative polymerase chain reaction (RT-qPCR) in peripheral leukocytes from surgical patients and healthy blood donors (total n=60) in response to low (1 nM) and high (1 µM) dexamethasone (DEX). The final selection of a suitable endogenous control gene was based on the studies of stability during DEX treatment and inflammation. Correlations between pre- and postoperative GC-induced gene expression, the postoperative systemic inflammatory and metabolic response (CRP, IL-6, white blood cell count, cytokines, resistin, free fatty acids, glucose, insulin, and adiponectin), and the clinical outcome were analyzed. The length of stay in the intensive care unit (ICU-LOS), the length of stay in the hospital, and postoperative complications were used to measure clinical outcome.
Results
When the blood donors were compared to the patients, there were no significant differences in the regulation of the genes in response to DEX, except for GRα. Preoperative, but not postoperative, gene regulation of GILZ and GRα was negatively correlated to ICU-LOS (P<0.05 and P<0.01, respectively). Preoperative GILZ and FKBP5 gene regulation was negatively correlated to postoperative systemic TNFα and MIP-1α levels.
Conclusion
We suggest that this assay could be used to determine GC responsiveness. An alteration in preoperative GC responsiveness may be related to a patient’s ability to recover from surgically induced inflammatory stress.
Supplementary materials
Gene Expression Omnibus data
Dataset GSE2842, samples GSM60588–60593.
Chip files for GCOS 1.4 were generated using all probe sets scaled to target signal 100. Expression levels between samples were compared using pairwise comparisons in GCOS:
6–0 hours; 60589 vs 60588, 60589 vs 60591, 60592 vs 60588 and 60592 vs 60591.
24–0 hours; 60590 vs 60588, 60590 vs 60591, 60593 vs 60588, 60593 vs 60591.
Probe sets with change call and signal log ratio ≥1 (fold change ≥2), and signal log ratio ≤−1 (fold change ≤−2) in all comparisons were selected for RT-qPCR.
Figure S1 Correlation between preoperative gene expression of IL1R2 (P=0.06) in response to 10 nM dexamethasone (DEX) in peripheral leukocytes from the PAT2 cohort and length of stay (days) in the intensive care unit (ICU).
Note: Scatterplot with fitted regression lines with 95% confidence interval of predicted means.
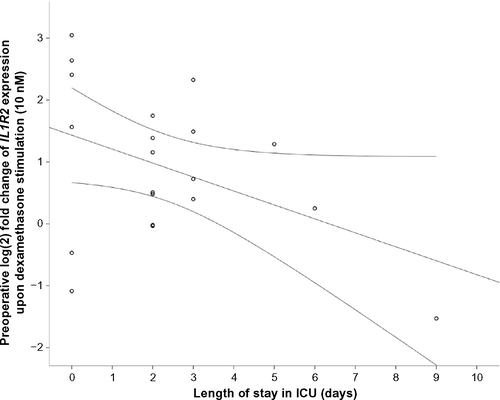
Figure S2 Correlation between preoperative gene expression of IL1R2 (P=0.051) in response to 10 nM dexamethasone (DEX) in peripheral leukocytes from the PAT2 cohort and Clavien–Dindo grade of complications.
Note: Scatterplot with fitted regression lines with 95% confidence interval of predicted means.
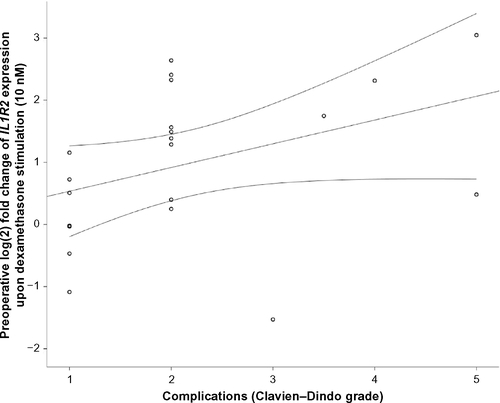
Table S1 Primer and probe sequences for investigated genes and endogenous control genes
Table S2 Gene expression of candidate endogenous control genes in healthy blood donors (n=9)
Table S3 Gene expression of endogenous control genes in surgical patients (n=21)
Acknowledgments
We would like to thank Olivera Werngren for technical assistance with RT-qPCR.
Disclosure
The authors report no conflicts of interest in this work.