
Abstract
Background
Good public health ensures an efficient work force. Organizations can ensure a prominent position on the global stage by staying on the leading edge of technological development. Public health and technological innovation are vital elements of prosperous economies. It is important to understand how these elements affect each other. This research study explored and described the relationship between these two critical elements/constructs.
Methods
Indicators representing technological innovation and public health were identified. Indicator data from 2000 to 2009 were collected from various US federal government sources, for the four US Census regions. The four US Census regions were then compared in terms of these indicators. Canonical correlation equations were formulated to identify combinations of the indicators that are strongly related to each other. Additionally, the cause–effect relationship between public health and technological innovation was described using the structural equation modeling technique.
Results
The four US Census regions ranked differently in terms of both type of indicators in a statistically significant manner. The canonical correlation analysis showed that the first set of canonical variables had a fairly strong relationship, with a magnitude > 0.65 at the 95% confidence interval, for all census regions. Structural equation modeling analysis provided β < −0.69 and Student’s t statistic > 12.98, for all census regions. The threshold Student’s t statistic was 1.98. Hence, it was found that the β values were significant at the 95% confidence interval, for all census regions.
Discussion
The results of the study showed that better technological innovation indicator scores were associated with better public health indicator scores. Furthermore, the study provided preliminary evidence that technological innovation shares causal relation with public health.
Keywords:
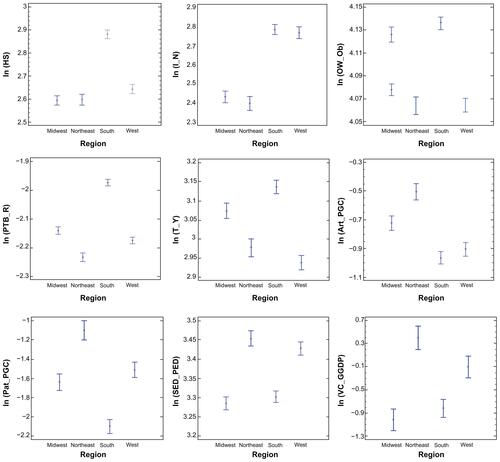
Supplementary figure
Figure S1 Multiple range tests.
Abbreviations: ln, logarithm; HS, health status; I_N, insurance; OW_Ob, obesity and overweight rate; PTB_R, preterm birth rate; T_Y, tobacco use; Art_PGC, articles per 1000 capita; Pat_PGC, patents per 1000 capita; SED_PED, percentage of science and engineering degrees; VC_GGDP, venture capital per $1000 of GDP.
Disclosure
The author reports no conflicts of interest in this work.