
Abstract
Background
Empathy for pain helps us to understand the pain of others indirectly. To better comprehend the processing of empathic pain, we report the frequency-dependent modulation of cortical oscillations induced by watching movies depicting pain using high-density electroencephalography (EEG), magnetoencephalography (MEG), and motor evoked potentials (MEP).
Methods
Event-related desynchronization of EEG and MEG was assessed while participants viewed videos of painful (needle) or neutral (cotton swab) situations. The amplitudes of MEPs were also compared between the needle and cotton swab conditions.
Results
The degree of suppression in α/β band power was significantly increased, whereas that of γ band power was significantly decreased, in the needle condition compared with the cotton swab condition. EEG revealed that significant differences in α/β band were distributed in the right frontocentral and left parietooccipital regions, whereas significant γ band differences were distributed predominantly over the right hemisphere, which were confirmed by source estimation using MEG. There was a significant positive correlation between the difference in γ power of the two conditions and the visual analog scale subjective rating of aversion, but not in the α/β band. The amplitude of MEPs decreased in the needle condition, which confirmed the inhibition of the primary motor cortex.
Conclusion
MEP suppression supports that modulation of cortical oscillations by viewing movies depicting pain involves sensorimotor processing. Our results suggest that α/β oscillations underlie the sensory qualities of others’ pain, whereas the γ band reflects the cognitive aspect. Therefore, α/β and γ band oscillations are differentially involved in empathic pain processing under the condition of motor cortical suppression.
Introduction
Understanding or having empathy for others while observing their circumstances is crucial for making fundamental social ties. Witnessing another person in a painful situation can cause “empathy for pain” in the observer. Empathy for pain involves complex processes that make it possible for the observer to experience sensory and emotional qualities of vicarious pain.Citation1 It is proposed that experience of empathy maps another person’s mental state on one’s own body through a resonance system, like that of action observation and the mirror neuron system.Citation2 In line with these concepts, empathic pain shares a neural substrate with first-hand pain in the pain matrix. The pain matrix is composed of lateral (sensory–discriminatory involving areas such as the primary and secondary somatosensory cortex, thalamus, and posterior parts of the insula) and medial (affective–cognitive–evaluative involving areas such as the anterior parts of the insula, anterior cingulate cortex, and prefrontal cortex) neuroanatomical components.Citation3–Citation7 Empathy for pain induces not only affective–motivational representations, but also sensory–discriminatory representations in the brain.Citation8–Citation10 Thus, we can use empathic pain to explore the pain system without inducing actual pain.
Visual stimuli depicting pain can cause modifications in induced oscillatory potentials measured with electroencephalography (EEG) and magnetoencephalography (MEG). Neural oscillations are classified into two categories: event-related synchronization and desynchronization. These enhanced or suppressed oscillations are time-locked but not phase-locked to the event, and are frequency band-specific and dependent on changes in thalamocortical activities.Citation11 Several studies investigating empathic pain have shown that α suppression occurs over the frontal and central regions after exposure to painful pictures, observed with EEGCitation12–Citation14 and MEG.Citation9 γ band activity plays a specific role in first-hand pain processing.Citation6,Citation15–Citation17 However, a previous study on empathic pain with MEG failed to reveal the enhancement or suppression of neural oscillations, including γ band activity, over the sensorimotor area.Citation18 To date, the implication of frequency band-specific modulation of oscillations by empathic pain is still under debate.
Pain systems are tightly linked to action systems that can be considered as part of the pain matrix.Citation8,Citation19,Citation20 The amplitudes of motor evoked potentials (MEPs) measured with transcranial magnetic stimulation decrease during viewing of video clips of painful situations.Citation8,Citation21 This indicates suppression of the primary motor cortex (M1) contralateral to the side of a penetrated hand. Somatosensory evoked potentials were also reported to be inhibited by movie clips showing pain.Citation19 Because sensorimotor systems are tightly linked, it is difficult to determine whether empathic pain inhibits M1 excitability directly or through somatosensory systems. However, these evoked potential findings suggest that empathic pain influences somatic sensorimotor reactivity of the pain matrix through the resonance system. Importantly, it is not always the case that the observation of painful stimuli suppresses MEP amplitudes; a movie showing deep penetration of a hand muscle inhibits MEPs, whereas pinpricking does not.Citation21 Thus, sensorimotor modulation by empathic pain may be dependent on “flesh and bone” painful stimuli. MEP suppression is also dependent on the first-person or third-person perspective.Citation22 Therefore, it is important to consider whether MEPs are suppressed when evaluating the modulation of neural oscillations by empathic pain.
In the present study, we evaluated the effects of empathic pain on neural oscillations using EEG and MEG, and on excitability of the corticospinal tract using MEPs, while participants viewed video clips of painful stimuli to each hand. To quantify these effects, we used a dense array of 128-ch EEG and 306-ch MEG to evaluate the whole brain area and to clarify the changes in cortical oscillatory activities of the pain matrix, including sensorimotor areas. We hypothesized that we would observe frequency-dependent modulation of neuronal oscillations, including γ band, by empathy for pain under the condition of MEP suppression.
Methods
Participants
In experiment 1, 17 participants (4 males, 13 females; 20–38 years old) underwent EEG recording and 12 participants (8 males, 4 females; 21–31 years old) underwent MEG recording. In experiment 2, 8 subjects (7 males, 1 female; 20–22 years old) underwent transcranial magnetic stimulation. All subjects were right-handed by self-report and had normal or corrected-to-normal visual acuity. None had a history of neurological or psychiatric disorders. All the subjects provided written informed consent, and the study was conducted with the approval of the Human Ethics Committee of the Faculty of Medicine, Graduate School of Medical Sciences, Kyushu University.
Visual stimuli
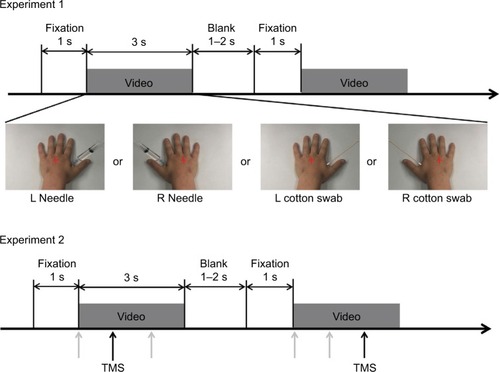
In both the experiments, a 3 s video clip that depicted four different observational conditions was used: 1) a needle penetrating the dorsal view of a left hand (L needle); 2) a cotton swab pressing the same region of the left hand (L cotton swab); 3) a needle penetrating the dorsal view of the right hand (R needle); and 4) a cotton swab pressing the same region of the right hand (R cotton swab). The stimuli were presented in first-person perspective on a monitor 114 cm away from the subject.
In experiment 1, videos were presented in a pseudorandom order for 3 s per trial, followed by gray screens of 1–2 s and a gray fixation point at the center of the screen for 1 s. The procedure was repeated in 10 blocks of 16 trials each, for a total of 160 trials in experiment 1. In experiment 2, the same procedure was repeated in 10 blocks of 24 trials each, for a total of 240 trials ().
Figure 1 Experimental design used in this study. Red crosses represent the fixation point. Arrows in experiment 2 indicate the time for transcranial magnetic stimulation after the onset of the video clip. Each magnetic stimulation was delivered at one of three time points (0, 1000, or 2000 ms after movie onset) for viewing each video clip (gray arrows). Black arrows indicate the examples of magnetic stimulation (1000 ms for the left video and 2000 ms for the right one).
EEG, MEG, and MEP recording
Experiment 1 was designed to explore the relationship between neuronal oscillations and subjective inner pain. EEG data were acquired using a high-density 128-ch Geodesic Sensor NetCitation23 with NetAmps 200 system (Electrical Geodesics Inc., Eugene, OR, USA). Continuous EEG was recorded with Cz as the reference electrode. The analog data were digitized at a sampling rate of 1000 Hz. Amplified analog voltages were hardware bandpass filtered at 0.1–200 Hz. Electrode impedances were kept below 50 kΩ, an acceptable range given by the high input impedance amplifiers in this system. The subjects were seated comfortably in a dark sound-attenuated chamber and were instructed to fixate on the fixation point in the center of the screen. Arousal level of each participant was carefully monitored throughout the experiment. If the subjects became drowsy, we alerted them and allowed a brief rest. After EEG recordings, all the participants were asked to evaluate how much they felt the subjective aversion in their mind using a visual analog scale (VAS), which ranged from 0 (corresponding to “no aversion”) to 10 (corresponding to “maximal aversion”); the VAS evaluation was not performed after MEG or MEP recordings.
MEG recording was performed after the EEG recordings and analysis to confirm the EEG results because of its superior spatial resolution in each frequency range. MEG data were recorded in a magnetically shielded room with a 306-ch whole head system (Neuromag Vector View, Elekta, Finland). The continuous magnetic field was bandpass filtered between 0.3 and 330 Hz and digitized at 1000 Hz. The shield room was kept dark during viewing of the movie clips, as was done for EEG recordings.
Experiment 2 was designed to study the effect of empathy for pain on M1 excitability contralateral to the pricked hand. A figure-eight coil connected to a Magstim 200 stimulator (Magstim, Whitland, UK) was placed over the right or left M1, and MEPs were recorded from the first dorsal interosseous muscle contralateral to the side of the stimulated cortex. Electromyographic signals were sampled at 10 kHz. The intersection of the coil was placed tangentially to the scalp with the handle pointing backward and laterally at 45° from the midline. The coil was moved on the scalp to determine the optimal position from which maximal amplitude MEPs were elicited in the recording muscle. The intensity of magnetic pulses was set at 120% of the resting motor thresholds, defined as the minimal intensity of the stimulatory output that produces MEPs with an amplitude of at least 50 μV with a 50% probability. A magnetic pulse was randomly delivered at 0, 1000, and 2000 ms after the onset of the video clips ().
Data analysis of high-density EEG and MEG
Offline analyses of the data were performed using Net Station software (Electrical Geodesics Inc.). EEG waveforms were filtered using a 1–100 Hz bandpass filter and a 60 Hz notch filter before segmentation. The time window was 1000 ms before and 3000 ms after the stimulus onset. Trials were marked “bad” if the average amplitude exceeded 100 μV, if they contained more than 10 bad channels, or if they contained eye movement more than 55 μV. These automated criteria were supplemented by visual inspection. In the remaining trials, data for bad channels were replaced by interpolations from the remaining channels using Net Station software. They were then re-referenced offline to the average of the two electrodes around the nose tip for analysis. All responses were then baseline corrected. A baseline correction was applied at 800 ms before target onset.
We performed an independent component analysis (ICA) to identify and extract ocular artifact components from the data. ICA is a blind source decomposition algorithm that enables the separation of statistically independent sources from multichannel data. ICA was performed using the Infomax ICA algorithm,Citation24 as implemented in the EEGLAB toolbox (sccn.ucsd.edu/eeglab/).Citation25 For each subject, we decomposed the data from all 128 channels into statistically independent components. Components classified as eye artifact related were subsequently removed from the data.
A time–frequency analysis of the EEG data was performed, and the power spectra between 10 and 60 Hz in steps of 1 Hz were evaluated by wavelet transformation using the wavelet toolbox of MATLAB ver. 7.5. In this transformation, we used a complex Morlet wavelet, with a window size of 7 at each center frequency, as in our previous study.Citation26 The mean power before the movie onset (−1000–0 ms) was used as a baseline, and the remainder were normalized.
The source estimation of MEG data was processed using MNE-pythonCitation27 for the time and frequency windows revealed by EEG analysis. Individual magnetic resonance imaging (MRI) data were obtained to calculate the lead field matrix based on a single-shell boundary element model.Citation28 Each subject’s reconstructed MRI head model was obtained by FreeSurfer (surfer.nmr.mgh.harvard.edu), and the coordinate system of the MRI data was coregistered with that of the MEG data. The MEG data were segmented, and source analysis was also performed by dynamical imaging of coherent Sources beamformer technique of frequency domainCitation29 after obtaining the power of the α/β or γ bands. Individual brain activities were transformed into the standard brain and averaged among the subjects. The source power was normalized to the segment before the onset of the video clip, and the two conditions of needle and cotton swab were compared.
Data analysis of MEPs
Peak-to-peak amplitudes were measured from each MEP waveform. Mean amplitudes were calculated for each condition, and the ratios of MEP amplitude with respect to the baseline (0 ms condition) were calculated for the 1000 and 2000 ms time points of the same video clip.
Statistical analysis
In experiment 1, the time–frequency analyses of the 128-ch EEG data were evaluated by the frequency range of 10–16 Hz for the α–β range and 30–60 Hz for the γ range. Next, clusters of two or more contiguous electrodes with significant differences were obtained based on t-values using the one-sample t-test between the needle and cotton swab conditions. Finally, the differences of each cluster between the needle and cotton swab conditions were tested with the time bin of 500 ms using nonparametric cluster-level statistics based on a permutation approach (1000 permutations).Citation30 The detection of clusters and the cluster-based permutation test were performed using the fieldtrip toolbox.Citation31 A probability level less than 0.05 was considered to represent a significant difference. Pearson correlation coefficients were calculated between the mean power difference of the needle and cotton swab conditions in each cluster and VAS subjective rating of aversion after determining that the sample data were normally distributed by the Kolmogorov–Smirnov test. The mean power of each cluster was also tested between the needle and cotton swab conditions by one-sample t-test to confirm the difference.
In experiment 2, normalized MEP values were analyzed by repeated-measures one-way analysis of variance, with the condition as the main factor with four levels (ipsilateral needle, ipsilateral cotton swab, contralateral needle, and contralateral cotton swab). For example, “ipsilateral needle” means that MEPs were recorded from left (or right) hand muscle while viewing needle penetrating left (or right) hand. The data of 1000 and 2000 ms as well as left and right recording muscles were combined because there was not a significant difference between the two conditions. Post hoc comparisons were carried out by means of the Student–Newman–Keuls test.
Results
Stimulus-induced EEG and MEG oscillations – α/β band (10–30 Hz)
α/β band suppression was observed in the needle and cotton swab conditions (). The α/β suppression over the right frontal regions was more evident in the needle condition than in the cotton swab condition. Contiguous electrodes of significant difference between the two conditions were selected in an automated fashion to form clusters, and statistically significant clusters were detected over the right frontocentral region (1000–1500 ms, p = 0.049; 1500–2000 ms, p = 0.010; 2500–3000 ms, p = 0.025) and the left parietooccipital region (1000–1500 ms, p = 0.012; 2500–3000 ms, p = 0.043, ). We also found that the mean power of regions of interest (ROIs) of the needle condition was significantly lower than that of the cotton swab condition for both clusters (right frontocentral: 1000–1500 ms, p = 0.003; 1500–2000 ms, p<0.001; 2500–3000 ms, p = 0.001, left parietooccipital: 1500–2000 ms, p = 0.002; 2500–3000 ms, p = 0.008, ). There was no significant linear relationship between the degree of suppression in α/β mean power and VAS score.
Figure 2 t-value maps (needle condition vs. cotton swab condition) of the 128-ch electroencephalography (EEG) system. (A) Two significant clusters of electrodes estimated based on t-values are outlined by black oval lines. Induced α/β band activity was decreased in the needle condition over the right frontocentral and left parietooccipital regions. (B) The top (Needle) and second (Cotton swab) rows show the logarithmic-transformed power value normalized to that of the prestimulus period for needle and cotton swab conditions. The third (Subtract) row represents the subtracted value of the cotton swab condition from that of the needle condition. The bottom (t-value) row shows the t-value map of the t-test that compares the two conditions. Positive values mean that the value of the needle condition is greater, whereas negative values mean the opposite. The power suppression of the needle condition was enhanced between 200 and 3000 ms after movie onset for 10–16 Hz (white dotted line). (C) Significant clusters during the 1500–2000 ms segment are indicated by a multiplication sign (×). Right frontocentral and left parietooccipital clusters were confirmed by a cluster-based permutation test. (D) Source estimation was conducted on the standard brain using the beamformer method to analyze magnetoencephalography data for the same time and frequency window shown in EEG. Blue color indicates suppression of power values by the needle condition. The data are masked by t-values corresponding to p<0.05. The areas of α/β band suppression were distributed over the frontal and parietal lobes, and the desynchronization of α/β over the frontal lobe was lateralized to the right hemisphere, similar to EEG.
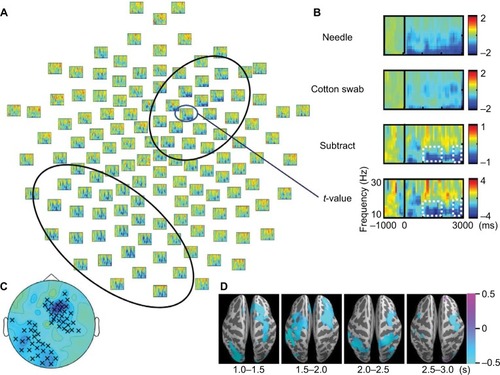
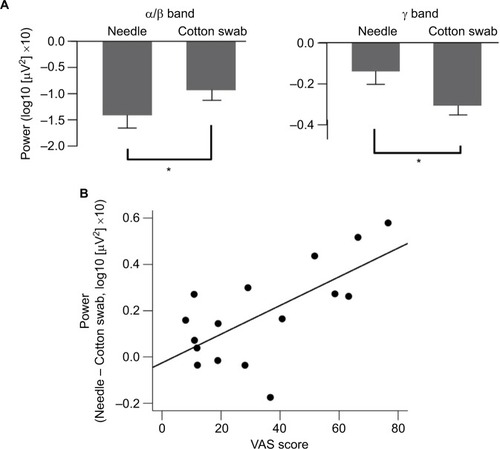
Figure 3 Mean power of regions of interest (ROIs) of the needle and cotton swab conditions at α/β bands during 1500–2000 ms, and γ bands for 1000–1500 ms. (A) Error bars indicate standard error. Asterisks (*) indicate significant differences using one-sample t-test comparisons (p < 0.05). Relationship between the mean power of ROIs and the visual analog scale (VAS) subjective rating of aversion is shown. (B) The mean power of ROIs of the γ band was positively correlated with VAS scores (r = 0.624, p = 0.007).
The source activity of α and β frequencies (10–16 Hz) was estimated by beamformer method. α/β band suppression was more pronounced in the needle condition after video onset, and the differences were mainly distributed over the frontal and parietal lobes. The area of α/β band suppression in the frontal lobe was dominant over the right hemisphere ().
Stimulus-induced EEG and MEG oscillations – low γ band (30–60 Hz)
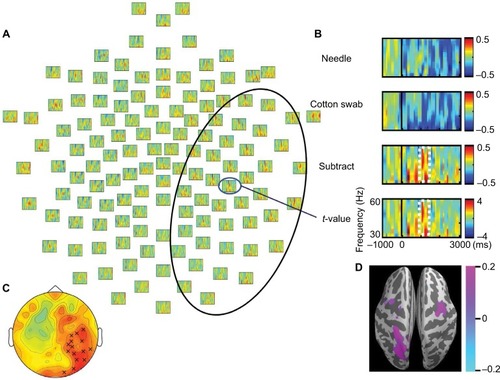
Low γ frequency suppression was observed in the needle and cotton swab conditions. The degree of γ band power suppression over the right frontotemporal region was decreased in the needle condition compared with the cotton swab condition during the time range of 1000–1500 ms, 30–60 Hz after stimulus onset (). Clusters were mechanically formed with contiguous electrodes of significant differences between the needle and cotton swab conditions. Based on the cluster-level permutation test, a significant cluster was estimated over the right centroparietal region (p = 0.022, ). The mean power within ROIs was significantly increased compared with that of the needle condition (p = 0.006, ). The difference in source power for the γ band was observed over the right motor area and left parietal lobe during 1000–1500 ms ().
Figure 4 t-Values (needle condition vs. cotton swab condition) for the γ band. (A) A significant cluster of significant electrodes is outlined by a black oval line. Induced γ band activities (30–60 Hz) were increased in the needle condition over the right hemisphere. (B) Power values and t-values of a representative electrode. The degree of power suppression was decreased between 1000 and 1500 ms after movie onset. (C) A significant cluster was observed over the right centroparietal region, as indicated by a multiplication sign (×). This was confirmed by a cluster-based permutation test. (D) Source estimation of the time and frequency window on the standard brain indicates that the decreased γ band suppression is centered at the right motor area.
There was a significant positive correlation between mean power of ROIs (needle condition minus cotton swab condition) and VAS subjective rating of aversion (p = 0.007, ).
MEP amplitudes during observation of video clips
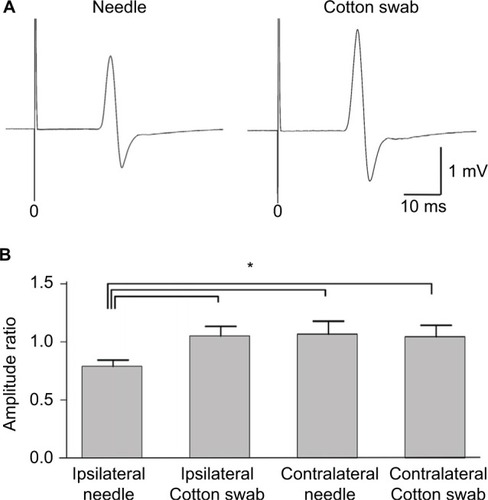
Transcranial magnetic stimulation was applied to the hot spot of the primary motor cortex, and MEPs were recorded from the contralateral hand muscles (). The amplitude in the needle condition was smaller than that in the cotton swab condition. MEP ratios based on those at the movie onset were compared between needle and cotton swab conditions. MEP amplitudes recorded from the hand muscles were significantly smaller in the needle conditions of the same side than in the cotton swab conditions of the same side, and either condition of the opposite side (). Thus, MEPs were suppressed by the movie depicting pain ipsilateral to the recording muscle (e.g. left hand MEPs viewing needle penetrating left hand), but not by the other conditions.
Figure 5 Motor evoked potentials (MEPs) during the needle and cotton swab conditions in experiment 2. Transcranial magnetic stimulation was applied to the hot spot of the primary motor cortex and MEPs were recorded from the contralateral first dorsal interosseous muscle. (A) Representative waveforms of the hand muscles during observation of the needle and cotton swab conditions. Note that the amplitude in the needle condition is smaller than that in the cotton swab condition. (B) Normalized amplitude (ratio of baseline) of MEPs of hand muscles during observation of ipsilateral needle, ipsilateral cotton swab, contralateral needle, and contralateral cotton swab conditions. Error bars indicate standard error of mean. Asterisk (*) indicates significant differences by post hoc comparison (p<0.05). MEPs were suppressed by the needle condition of the hand ipsilateral to the recorded muscle, but not the other conditions.
Discussion
We have studied the modulation of EEG and MEG oscillations induced by viewing movies depicting pain. This is the first study in which EEG and MEG modulations were evaluated under the condition that MEP suppression was confirmed. Because painful visual stimuli do not always induce M1 inhibition,Citation21,Citation22 it is important to evaluate EEG and MEG oscillations while MEP suppression is also observed. The results of this study add further evidence of sensorimotor and cognitive–affective representations of empathy for pain processing. In the following discussion, we will focus on the relationships between oscillation changes of the α/β or γ bands and cognitive–affective or somatic aspects of empathy for pain.
Role of α and β band desynchronization
EEG analysis showed that enhanced suppression of α/β band power in the needle condition was lateralized toward the right frontocentral region and the left parietooccipital region, rather than the contralateral side of the penetrated hand. Source estimation of MEG using the beamformer method also suggested the areas of α/β band suppression were distributed over the frontal and parietal lobes, and the frontal area with enhanced α/β band suppression was predominant on the right side. The increased suppression of α/β band power is consistent with many previous studies,Citation9,Citation13,Citation14 though one previous study reported conflicting results.Citation12 We hypothesize that the increased suppression is partly induced by activation of the somatic sensorimotor area, based on the frontocentral distribution that was related to the sensorimotor system. The absence of a correlation between the degree of α/β power suppression and the VAS score is consistent with the link to sensorimotor functions rather than to cognitive and perceptual functions. MEP inhibition also supported sensorimotor modulation, which we assume is reflected in these frequency bands based on the relationship between motor functions and α/β oscillations.Citation11
Although somewhat inconsistent results between EEG and MEG were observed, the observation of right hemispheric predominance of frontal α/β desynchronization is worth noting. If α/β suppression reflects mere activation of the somatosensory area, the suppressed area would likely be distributed on the bilateral central regions over the somatosensory cortex. However, this was not the case. Previous studies have shown laterality of suppression when still pictures of the left handCitation13 or right hand onlyCitation9 are used as the visual stimulus. Yang et alCitation14 reported more suppression of α frequency over the central region. Similarly, other empathic pain studies have shown α suppression with EEGCitation13 and MEGCitation9 over the frontal and central regions using painful pictures. However, another study showed lateralized modulation of oscillations in the right hemisphere.Citation32 Interestingly, in functional MRI studies, overall brain reactivity to negative pictures is lateralized toward the right hemisphere.Citation6,Citation33 Video clips of hands in painful situations induce a decrease in α power, where the largest decrease in α power occurred during viewing of a surgery scene, and was prominent over the right posterior region.Citation32 Therefore, right central α/β band suppression in this study suggests that empathy for pain brings about a more profound effect on the right hemisphere. Several previous studies have reported a higher sensitivity of the left hand to pain sensation,Citation34 which might also support the dominance of the right hemisphere in pain processing or empathic pain.
Conversely, parietooccipital desynchronization was lateralized to the left hemisphere. Mu et alCitation12 have reported that α band suppression by painful pictures is reduced relative to neutral stimuli over the central and parietal regions with left predominance. They assumed that the changes were derived from emotional sharing and regulation. Smith et alCitation35 have reported that emotional sound induces left hemispheric asymmetry of α power of parietal electrodes. Thus, affective processing may also involve the left parietal region. Because observed touch activates parietal cortices,Citation36 enhanced α/β suppression in the left parietal region induced by watching movies depicting pain may be linked to the right frontocentral desynchronization in which somatosensory processing would be activated, and also lead to MEP inhibition.
Role of low γ band desynchronization in the right centroparietal region
γ band oscillatory synchrony is involved in a neuron’s fine temporal tuning, which favors the selective transmission of synchronized information (attention) and fosters synaptic plasticity.Citation37 Decreased γ band desynchronization over the right frontotemporal region was observed in the time window of 1000–1500 ms after stimulus onset, and the current source was estimated to be centered on the right central area. In addition, there was a significant positive correlation between the total power of ROI and the VAS subjective rating of aversion. These results indicate that this oscillatory change in γ power was induced by the pain-related brain regions allied to the subjective experience of pain.
γ band activity plays a specific role in first-hand pain processing.Citation15–Citation17 Thus, it is likely that the γ band activity observed in this study could be involved in the processing of empathic pain. Activation in the right anterior insula correlates with the subjective intensity rating of painful thermal simulation.Citation38 However, a previous MEG study of viewing movies depicting pain failed to reveal the enhancement or suppression of neural oscillations, including γ band activities, over the sensorimotor area.Citation18 In that study, they estimated only the left sensorimotor area with a 28-channel MEG system because videos of penetrated right hands were presented to subjects. However, we found that the decreased γ band suppression was estimated to be centered on the right sensorimotor area, which partly corresponded to the behavior of γ band EEG activities. Interestingly, the mean power of ROIs of γ activity positively correlated with the VAS subjective rating of aversion. Emotional affective processing occurs mainly in anterior cingulate cortex, anterior insula, or other deeper structures. Subcortical networks are also involved in the processing of empathic pain, which are difficult to estimate using EEG and MEG. In addition, the results in this study cannot exclude the contribution of other cognitive processes such as anxiety. Thus, γ band modulation may reflect empathic pain processing only indirectly. Recent studies have indicated that empathic pain influences cognitive functions,Citation39 which might be related to the involvement of γ band oscillations. Still, it is plausible that γ band modulation reflects cognitive and perceptual functions rather than somatosensory functions.
Effect of empathic pain on the contralateral motor cortex
We found a decrease in MEP amplitudes, which indicates inhibition of the corticospinal tract. The inhibition was observed on the same side as that of the needle condition. Avenanti et alCitation8 provided the first evidence of an intimate relationship between the pain and action systems using MEPs. In that study, empathic pain caused a reduction in MEP amplitude that was specific to the muscle that subjects observed being penetrated. They have also shown that MEP suppression needs a “flesh and bone” stimulus, and not just pricking a hand.Citation21 MEP suppression is also modulated by first-person or third-person perspective.Citation22 Thus, our painful visual stimuli were chosen appropriately to suppress the corticospinal tract. In earlier functional MRI studies, empathic pain induced an increase in the blood oxygen level-dependent signal in the anterior insula and anterior cingulate cortex (affective division of the pain matrix), but not in the sensory–discriminative areas such as primary and secondary somatosensory cortex.Citation4,Citation5,Citation7 Event-related potentials to painful laser stimulation were modulated contralaterally to the stimulation during the observation of video clips showing noxious stimulation,Citation10 in agreement with the MEP findings in this study. Therefore, external stimulation, such as transcranial magnetic stimulation, is useful to detect changes in the sensorimotor system under empathic pain-inducing conditions. Taking the results of experiment 1 into consideration, our results suggest that α/β band desynchronization underlies the sensorimotor aspect of experiencing others’ pain. Somatosensory and motor cortices are deeply connected;Citation40 thus, MEP inhibition may occur through somatosensory modulation. Because MEPs were not recorded for the same subjects as those of EEG and MEG, the link between MEP suppression and modulation of the α/β or γ bands cannot be directly evaluated. A recent study has suggested a link between β band enhancement and MEP suppression with experimental pain.Citation41 Thus, future studies should explore the link between EEG and MEP during empathic pain with recordings from the same subjects.
Limitations of this study
The data in this study were based on a relatively small sample size; thus, the role of sex could not be evaluated. Because sex differences in sensitivity to pain or empathy have often been reported,Citation14,Citation42 the effect of sex should be investigated in future studies.
The frequency range was determined arbitrarily because we did not have an a priori assumption of spatiotemporal dynamics to process empathy for pain while viewing the needle condition. However, the clusters of electrodes were automatically determined for each time segment to obtain unbiased results. EEG, MEG, and MEP were not recorded simultaneously, and VAS was obtained only in the EEG study. Thus, the results from both experiments cannot be directly compared. Nevertheless, the source estimation by MEG appears to be compatible with the EEG data. Repetitive viewing of a small number of movies may lead to habituation of the responses, which would result in underestimated effects. However, significant differences were measured for both the α/β and γ bands; thus, it is likely that the effect of empathic pain exists in the cortical oscillations.
Conclusion
We explored the frequency-dependent changes of empathy for pain by viewing movies depicting pain using high-density EEG and MEG with the condition that MEP inhibition was observed. Our results suggest that α/β band suppression is involved in the processing of somatic aspects of empathy for pain, which in turn results in inhibition of M1 excitability. γ oscillations most likely reflect the cognitive aspects of pain assessment. The analyses help advance our understanding of the processing of empathic pain. Further studies are needed to study the direct link between α/β band suppression and MEP suppression, and the relationship between α/β and γ band modulations, to further elucidate the neural substrates of pain observation.
Acknowledgments
This work was supported by Kyushu University Project for Interdisciplinary Research (Type A) of Molecular Imaging of Pain. This work was also supported in part by a Grant-in-Aid for Scientific Research on Innovative Areas MEXT KAKENHI (15H05875 to ST).
Disclosure
The authors report no conflicts of interest in this work.
References
- BettiVAgliotiSMDynamic construction of the neural networks underpinning empathy for painNeurosci Biobehav Rev20166319120626877105
- RizzolattiGSinigagliaCThe functional role of the parieto-frontal mirror circuit: interpretations and misinterpretationsNat Rev Neurosci201011426427420216547
- BotvinickMJhaAPBylsmaLMFabianSASolomonPEPrkachinKMViewing facial expressions of pain engages cortical areas involved in the direct experience of painNeuroimage200525131231915734365
- JacksonPLMeltzoffANDecetyJHow do we perceive the pain of others? A window into the neural processes involved in empathyNeuroimage200524377177915652312
- MorrisonILloydDdi PellegrinoGRobertsNVicarious responses to pain in anterior cingulate cortex: is empathy a multisensory issue?Cogn Affect Behav Neurosci20044227027815460933
- OginoYNemotoHInuiKSaitoSKakigiRGotoFInner experience of pain: imagination of pain while viewing images showing painful events forms subjective pain representation in human brainCereb Cortex20071751139114616855007
- SingerTSeymourBO’DohertyJKaubeHDolanRJFrithCDEmpathy for pain involves the affective but not sensory components of painScience200430356611157116214976305
- AvenantiABuetiDGalatiGAgliotiSMTranscranial magnetic stimulation highlights the sensorimotor side of empathy for painNat Neurosci20058795596015937484
- WhitmarshSNieuwenhuisILBarendregtHPJensenOSensorimotor alpha activity is modulated in response to the observation of pain in othersFront Hum Neurosci201159122007165
- ValentiniELiangMAgliotiSMIannettiGDSeeing touch and pain in a stranger modulates the cortical responses elicited by somatosensory but not auditory stimulationHum Brain Mapp201233122873288422234936
- PfurtschellerGFunctional brain imaging based on ERD/ERSVision Res20014110–111257126011322970
- MuYFanYMaoLHanSEvent-related theta and alpha oscillations mediate empathy for painBrain Res2008123412813618718453
- PerryABentinSBartalIBLammCDecetyJ“Feeling” the pain of those who are different from us: modulation of EEG in the mu/alpha rangeCogn Affect Behav Neurosci201010449350421098810
- YangCYDecetyJLeeSChenCChengYGender differences in the mu rhythm during empathy for pain: an electroencephalographic studyBrain Res2009125117618419083993
- ChenACHerrmannCSPerception of pain coincides with the spatial expansion of electroencephalographic dynamics in human subjectsNeurosci Lett2001297318318611137758
- GrossJSchnitzlerATimmermannLPlonerMGamma oscillations in human primary somatosensory cortex reflect pain perceptionPLoS Biol200755e13317456008
- HauckMLorenzJEngelAKAttention to painful stimulation enhances gamma-band activity and synchronization in human sensorimotor cortexJ Neurosci200727359270927717728441
- BettiVZappasodiFRossiniPMAgliotiSMTecchioFSynchronous with your feelings: sensorimotor {gamma} band and empathy for painJ Neurosci20092940123841239219812314
- BufalariIAprileTAvenantiADi RussoFAgliotiSMEmpathy for pain and touch in the human somatosensory cortexCereb Cortex200717112553256117205974
- SvenssonPMilesTSMcKayDRiddingMCSuppression of motor evoked potentials in a hand muscle following prolonged painful stimulationEur J Pain200371556212527318
- AvenantiAMinio-PaluelloIBufalariIAgliotiSMStimulus-driven modulation of motor-evoked potentials during observation of others’ painNeuroimage200632131632416675270
- BucchioniGFossataroCCavalloAMourasHNeppi-ModonaMGarbariniFEmpathy or ownership? Evidence from corticospinal modulation during pain observationJ Cogn Neurosci201628111760177127378331
- TuckerDMSpatial sampling of head electrical fields: the geodesic sensor netElectroencephalogr Clin Neurophysiol19938731541637691542
- BellAJSejnowskiTJAn information-maximization approach to blind separation and blind deconvolutionNeural Comput199576112911597584893
- DelormeAMakeigSEEGLAB: an open source toolbox for analysis of single-trial EEG dynamics including independent component analysisJ Neurosci Methods2004134192115102499
- HagiwaraKOkamotoTShigetoHOscillatory gamma synchronization binds the primary and secondary somatosensory areas in humansNeuroimage201051141242020149885
- GramfortALuessiMLarsonEMEG and EEG data analysis with MNE-PythonFront Neurosci2013726724431986
- HämäläinenMSSarvasJRealistic conductivity geometry model of the human head for interpretation of neuromagnetic dataIEEE Trans Biomed Eng19893621651712917762
- GrossJKujalaJHamalainenMTimmermannLSchnitzlerASalmelinRDynamic imaging of coherent sources: studying neural interactions in the human brainProc Natl Acad Sci U S A200198269469911209067
- MarisEOostenveldRNonparametric statistical testing of EEG- and MEG-dataJ Neurosci Methods2007164117719017517438
- OostenveldRFriesPMarisESchoffelenJMFieldTrip: open source software for advanced analysis of MEG, EEG, and invasive electrophysiological dataComput Intell Neurosci2011201115686921253357
- SarloMBuodoGPoliSPalombaDChanges in EEG alpha power to different disgust elicitors: the specificity of mutilationsNeurosci Lett2005382329129615925105
- CanliTDesmondJEZhaoZGloverGGabrieliJDHemispheric asymmetry for emotional stimuli detected with fMRINeuroreport1998914323332399831457
- PudDGolanYPestaRHand dominancy–a feature affecting sensitivity to painNeurosci Lett2009467323724019853018
- SmithBDMeyersMKlineRBozmanAHemispheric asymmetry and emotion: lateralized parietal processing of affect and cognitionBiol Psychol19872532472603503666
- KeysersCKaasJHGazzolaVSomatosensation in social perceptionNat Rev Neurosci201011641742820445542
- Tallon-BaudryCThe roles of gamma-band oscillatory synchrony in human visual cognitionFront Biosci (Landmark Ed)20091432133219273069
- CraigADHow do you feel? Interoception: the sense of the physiological condition of the bodyNat Rev Neurosci20023865566612154366
- HuKFanZHeSUncovering the interaction between empathetic pain and cognitionPsychol Res20157961054106325476997
- Di LazzaroVOlivieroAPilatoFThe physiological basis of transcranial motor cortex stimulation in conscious humansClin Neurophysiol2004115225526614744565
- MartelMHarveyMPHoudeFBalgFGoffauxPLéonardGUnravelling the effect of experimental pain on the corticomotor system using transcranial magnetic stimulation and electroencephalographyExp Brain Res201723541223123128188330
- Christov-MooreLSimpsonEACoudéGGrigaityteKIacoboniMFerrariPFEmpathy: gender effects in brain and behaviorNeurosci Biobehav Rev201446Pt 460462725236781