
Abstract
Purpose
Endoscopic sinus surgery for patients with chronic rhinosinusitis (CRS) unresponsive to medical therapy has traditionally been performed under general anesthesia and in the operating room. Balloons for catheter dilation of paranasal sinuses were introduced in 2005, allowing sinus surgery to be safely performed either in the operating room or the office care setting, under local anesthesia. This change in care setting has raised concerns of overuse or expanded indications for sinus surgery. This study was thus designed to evaluate changes in surgical volumes in the United States, for the period 2006–2011, and to evaluate the impact of the sinus balloons on surgical practice.
Methods
The MarketScan® Commercial Claims and Encounter Database was queried for the period 2006 to 2011 using CRS International Classification of Diseases, Ninth Revision codes (473.X) and sinus surgery US-based Common Procedural Terminology (CPT) codes (endoscopic sinus surgery: CPT codes 31254–31294 and 31299; balloon catheter dilation: CPT codes 31295–31297). MarketScan’s projection methodology was applied to estimate the nationwide prevalence of CRS and the incidence of sinus surgery. Procedural case mix and total average payment per surgery were analyzed.
Results
From 2006 to 2011, the yearly prevalence of CRS and sinus surgery volume remained flat with ~430 patients with CRS per 100,000 in the employer-sponsored insured population, of which ~117/100,000 underwent surgery. In 2006, 2.69 paranasal sinuses (95% confidence interval [95% CI]: 2.65–2.71) were treated during each individual sinus surgery, with an additional 1.11 nasal procedures (95% CI: 1.08–1.13) performed concurrently. By 2011, the procedural case mix had expanded to 2.90 sinus (95% CI: 2.87–2.93) and 1.16 nasal procedures (95% CI: 1.14–1.85) per surgery. Payments increased from $7,011.06 (α=$6,378.30; β=3.1490) in 2006 to $9,090.11 (α=$8,350.20; β=2.9535) in 2011, in line with US medical inflation.
Conclusion
In the study population, approximately 1 in 3.7 patients diagnosed with CRS underwent sinus surgery. This ratio remained constant from 2006 to 2011. There was no evidence that the number of distinct sinus surgeries per 100,000 people increased despite the introduction and utilization of balloon catheter dilation tools that enabled migration of sinus surgery to the office.
Introduction
New technologies designed to improve patient care and reduce costs are shifting health care delivery from inpatient to outpatient settings, and increasingly, to physicians’ offices. Increasingly complex procedures are now performed in the office, and in 2010, the number of such procedures performed in the United States was estimated at more than 10 million.Citation1 Balloon catheter dilation (BCD) of paranasal sinuses in the treatment of patients with chronic rhinosinusitis (CRS) who experience an inadequate response to medical management is an example of such a procedure.Citation2 Before the introduction of BCD in 2005, nearly all sinus surgeries were performed in operating rooms, under general anesthesia, as rigid instruments were required to create access within diseased tissue. Sinus surgery using BCD tools is minimally invasive, preserves bone and tissue, and allows treatment of appropriately selected patients either in the operating room as done traditionally, or in the office using local anesthesia.Citation2,Citation3
BCD in the office has been shown to provide key benefits for CRS patients, such as avoidance of general anesthesia and rapid return to work.Citation2 For otolaryngologists, being able to offer a safe, effective, and minimally-invasive treatment within their office is appealing. These benefits, however, have raised concerns of an increase in utilization, either via supplier-induced (physician-driven) demand or simply increased requests from patients with CRS.Citation4 To determine whether an increase in utilization occurred after the introduction of BCD technology, we analyzed changes in endoscopic sinus surgery (ESS) volume in the United States from 2006 through 2011, whether through ESS or BCD.
We also sought to provide additional clarity on the actual prevalence of sinus surgery in the United States. Multiple reports have recently been published, estimating the volume of sinus surgery from 256,000 cases a yearCitation5 to 600,000 cases per year.Citation4,Citation6 As procedures migrate into the outpatient setting, accurate and precise accounting of all sinus procedures done in a given year continues to be challenging since no definitive census is available. A recent publication suggested significant growth from 2000–2006 with relative flat growth from 2006–2009,Citation7 whereas another report provides growth figures of 75% for frontal sinus surgery alone between 2007–2009.Citation4 Our study thus evaluated all time points from 2006–2011 so as to account for macroeconomic anomalies and adjustments.
Methods
All queries were conducted using the Truven Health MarketScan® Commercial Claims and Encounter Database (Truven Health Analytics, Ann Arbor, MI, USA) as of October 1, 2013. This database, with its >20 million lives with continuous enrollment in any given year, its ability to track patients longitudinally across all sites of care over multiple years, and unique projection methodology, is a valuable tool to estimate frequency of diseases and surgeries. This database has recently been used for a number of disease prevalence and incidence estimatesCitation8,Citation9 and was referenced in more than 50 peer-reviewed manuscripts in 2012 alone.Citation10
All sinus surgeries (for both adult and pediatric patients) occurring from January 1, 2006 to December 31, 2011 were identified using the US-based Common Procedural Terminology (CPT-4) codes 31254 to 31299. These codes specifically describe ESS (31254–31294) as well as BCD (31295–31297). The general “sinus surgery” code 31299 was included to account for BCD procedures performed before 2011, when BCD-specific codes came into effect. Surgeries were defined as the entire episode of care limited to a 24 hour window during which the CPT codes listed above were recorded. One surgery therefore could include multiple procedural codes, and one patient could have multiple surgeries within a given year.
All surgeries were further analyzed by site of care using place-of-service codes: hospital outpatient (code 22), ambulatory surgical center (code 24), office (code 11), or unspecified (codes 82–99).
From 2006 to 2010, all surgeries, with or without BCD, were reported using general ESS CPT codes (31254–31294 and 31299) as the BCD codes only came into effect in 2011. However, for surgeries in 2011, more granular analyses were conducted to identify the percentage of surgeries in which BCD was used as the only surgical approach, without tissue removal (these procedures being coded with CPT codes 31295–31297; all other procedures in which ESS was performed with or without BCD being coded 31254–31294).
To estimate changes in the prevalence of patients with CRS – which may be linked to changes in surgery volume – all patients with an International Classification of Disease, Ninth Revision, Clinical Modification code of: 473 (chronic sinusitis), 473.0 (maxillary), 473.1 (frontal), 473.2 (ethmoidal), 473.3 (sphenoidal), 473.8 (other chronic sinusitis), or 473.9 (unspecified sinusitis – chronic) from 2006 to 2011 were identified.Citation11 Patient records were analyzed to keep only patients with at least two diagnoses of CRS, at least 12 weeks apart, in accordance with the definition of the disease.Citation6
Nationwide projections of surgery volumes were obtained using a proprietary methodology developed by MarketScan. Briefly, the MarketScan population was subdivided into 72 demographic cells linked to similar subpopulations from the Medical Expenditure Panel Survey (MEPS).Citation12 A weight factor was assigned to each cell, such that the weight would be equal to the ratio of the MEPS-estimated population divided by the MarketScan sample size. In our analyses, only those patients with 12 months of consecutive enrollment were included. When estimating surgery volumes each year, care was taken to ensure that when a patient underwent more than one surgery in a given year, each surgery would be counted as a separate event.
To understand changes in case mix and payments from 2006 to 2011, all sinus surgeries performed from January 1 to January 31 of each year were identified. These representative samples ranged in size from 4,689 to 7,067 surgeries for each given year. For these analyses, the entire episode of care on the day of the procedure was analyzed in terms of all listed sinus and nasal procedures and total payments for the sinonasal surgery. The shape and scale of payments for surgery came from a fit to a log-logistic distribution.
Projections of disease prevalence and sinus surgery incidence each year are shown as a count per 100,000 in the employer-sponsored insured (ESI) population. Analyses of case mix are shown as averages with 95% confidence intervals (α=0.05). Payment distributions were analyzed and final costs are shown as averages with shape and scale values. Differences between 2006 and 2011 in terms of number of sinus and nasal procedures per surgery were analyzed using Student’s t-tests of unpaired observations. A P-value less than 0.05 was considered significant.
Results
From 2006 to 2011, the number of lives with at least 12 months of continuous enrollment in the MarketScan database increased from 22.1 million in 2006 to 35.9 million in 2011, out of a total estimated ESI population in the United States of 166.4 million in 2006 and 154.3 million in 2011. The MarketScan methodology was thus developed to project findings within the 22.1 million (2006) and 35.9 million (2009) lives to the total, 166.4 and 154.3 million lives, respectively.
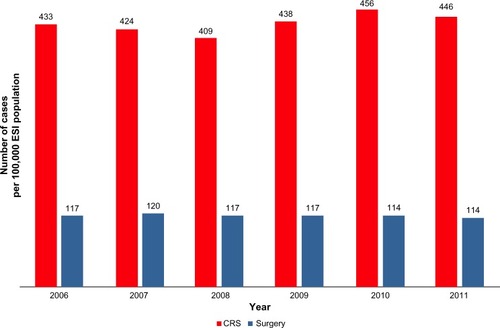
The prevalence of CRS and the incidence of sinus surgery in the commercial ESI population per 100,000 members are shown in . CRS, using the definition established by clinical practice guidelines,Citation6 impacted between 409 and 456 patients for every 100,000 members, or approximately 0.5% of the overall ESI population. Sinus surgery was conducted on 114–120 patients for every 100,000 members, or approximately one in 3.5 to 4 CRS patients. No clear trend was observed in the timeframe analyzed with both CRS prevalence and incidence of surgery remaining constant with some normal yearly variability.
Figure 1 Prevalence of patients with CRS and incidence of sinus surgery per 100,000 ESI patients in the US, from 2006 to 2011.
Abbreviations: CRS, chronic rhinosinusitis; ESI, employer-sponsored insured.
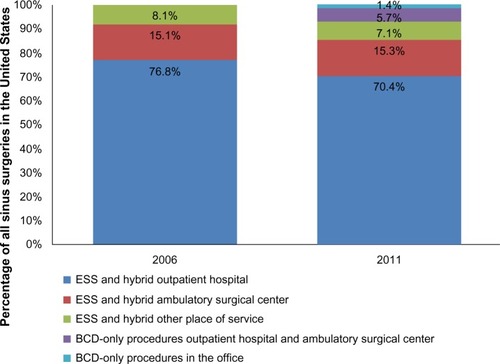
As shown in , from 2006 to 2011, the rate of BCD-only procedures increased to approximately 7% and by 2011 about 1.5% of all sinus procedures were done in the office. Due to coding conventions, procedures in which both tissue removal and dilation of sinus ostia with BCD tools were performed concurrently are coded as “ESS” procedures (CPT 31254–31294 and 31299) – therefore an unknown proportion of BCD with ESS procedures (“hybrid procedures”) is included in the ESS category.
Figure 2 Percentage of ESS surgeries by site of care and surgery type.
Abbreviations: BCD, balloon catheter dilation; ESS, endoscopic sinus surgery.
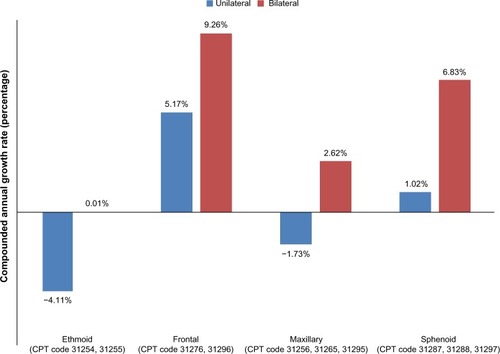
To understand changes in case mix and overall changes to the complexity of sinus surgery, an analysis was conducted to determine the number of recorded (billed) sinus and nasal procedures associated with each sinus surgery event. shows slight increases in distinct sinus and nasal procedures over time. From 2006 to 2011, the number of nasal procedures, defined by CPT codes 30000 to 30999, increased by 4.9%. This change was significant (P=0.0089). Similarly, the number of sinus procedures billed for every surgery, defined by CPT codes 31000 to 31299, increased by 8%. This change was also significant (P<0.0001). An analysis of sinus procedures on a per-code basis indicated that the greatest growth was observed for bilateral procedures, whereas negative growth was observed for ethmoid and maxillary unilateral procedures ().
Figure 3 Average number of distinct sinus and nasal procedures coded during each sinonasal surgery, from 2006 to 2011 in the US.
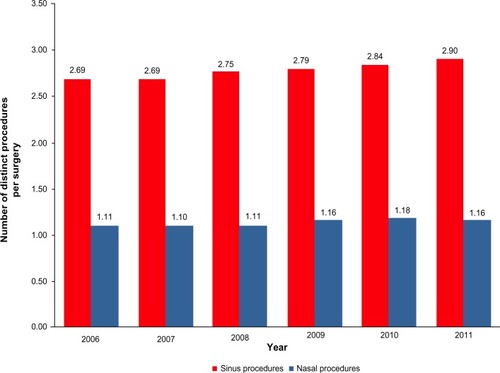
Figure 4 Compounded annual growth rate in specific sinus procedures, by anatomy (ethmoid, frontal, maxillary, or sphenoid) and laterality (unilateral versus bilateral).
Abbreviation: CPT, Common Procedural Terminology.
Payments followed log-logistic distributions. Average payments increased from $7,011.06 (α=6,378.30; β=3.1490) in 2006 to $9,090.11 (α=8,350.20; β=2.9535) in 2011, a compounded annual growth rate of 5.3%. Comparatively, during that same time period, yearly rates of medical inflation ranged from approximately 3.5% (“all medical expenditure”) to 6.6% (“hospital and related services”).Citation13 The increase in payment therefore fell within the published range of medical inflation.
Discussion
This study was designed to estimate changes in frequency of sinus surgery from 2006 to 2011, considering the new BCD technology launched in 2005, and to determine whether this new approach to surgery led to increases in patient-driven or supplier-induced demand. A secondary objective of the study was to provide some clarity on overall procedural volume rates and growth, as recent reports have provided conflicting conclusions.Citation4,Citation7
In our study, the estimated prevalence of CRS within the ESI population and the incidence of sinus surgery remained constant from 2006 to 2011. Thus, there was no expansion of the clinical indication for sinus surgery. However, in that time frame, whereas the number of surgeries remained static, the case mix changed as more nasal and sinus procedures were performed during each surgery. This finding could explain some of the confusion in the published literature, in which the projected number of procedures was used to evaluate changes in health care utilization.Citation4
Whereas the frequency of BCD-only procedures remained relatively low, the volumes associated with BCD codes did suggest adoption of the technology. However, the incidence data suggests that the observed growth in BCD procedures may have cannibalized the legacy ESS procedures, with no change in overall number of sinus surgeries.
In the ESI population, the rate of CRS leading to at least two consecutive diagnoses at least 12 weeks apart ranged from 409 to 456 patients per 100,000 or slightly below 0.5%. This ratio is lower than a previously published 1.01% rate, obtained using a similar definition of multiple diagnoses for a longer period of time.Citation14 The difference may be due to the fact that the 1.01% value was obtained via patient survey, whereas, in our research, the 0.5% value was obtained from patients actually receiving the diagnosis and care from a physician. It is therefore possible that a larger proportion of patients would self-diagnose versus obtain a diagnosis through a health care professional.
Sinus surgery volume ranged from 114 to 120 surgeries per 100,000 in the ESI population. This finding falls within a previously published range that suggested a frequency of sinus surgery between 92 and 129 surgeries per 100,000 patients.Citation7,Citation15 More importantly, however, using a consistent methodology and a database of more than 20 million patients with continuous 12-month enrollment, we did not see any consistent growth in the rate of sinus surgery over the 6-year period.
During that time, there was approximately one surgery for every 3.5 to 4 patients with CRS. This ratio can be explained by the fact that approximately 40%–80% of patients may get relief from conservative medical management,Citation16,Citation17 and of those remaining 20%–60% who are not experiencing significant improvements, only a fraction may opt for surgery. Interestingly, despite the availability of the in-office BCD procedure, penetration of BCD-only procedures that did not include any form of tissue removal remained relatively small in 2011 (). More importantly, the ratio of surgery to CRS patient did not change over the years, suggesting that the relative number of patients with CRS undergoing surgery remained constant.
The flat growth in surgical incidence and penetration rate of BCD-only procedures further suggests a limited role for supplier-induced demand in the time period considered herein. This may be due to the fact that US-based and European rhinologic medical societies recently facilitated the creation and publication of well-defined guidelines.Citation6,Citation18 These medical guidelines alleviate some of the uncertainty in appropriate treatment modalities and thus possibly reduce the variability in individual physician practice styles that were identified before 2006.Citation19
Our analysis also indicated that a statistically greater number of distinct nasal and sinus procedures were performed during each surgery. There may be multiple reasons underlying this finding – there is an increasing body of evidence suggesting that diseased sinuses, if left untreated, may lead to failure of the entire surgery. Over the study period, surgeons may therefore have elected to treat patients more comprehensively.Citation20 Others have also pointed to financial incentives for variability in surgical practice.Citation19 Regardless of its reason, this increase in total number of procedures has raised concerns.Citation4 However, our analysis shows that on a per-surgery basis, the increase in the number of procedures was small over the 6-year period (0.21 for sinus procedures, 0.05 for nasal procedures) and, importantly from a health care economics standpoint, the total payment per surgery was below hospital and related services medical inflation, which averaged 6.56% during that same time frame, and barely outgrew the overall US medical inflation rate (which includes medical commodities and is estimated at 3.5% yearly growth). Therefore, our findings suggest that patients received greater treatment with no significant increase in actual cost.
There are three limitations to this study that should be discussed. The MarketScan database only includes patients with ESI. These insurance policies tend to be more generous compared to other plans, and populations in this category may have higher income compared to other populations. As a result, these patients may utilize health care differently than the rest of the US population. In addition, this study did not include Medicare/Medicaid patients and thus was limited to patients less than 65 years of age. However, the ESI population is appropriate to study potential changes in surgery volume due to patient- or supplier-induced demand following novel technologies, because this is the population that may best respond to news of new therapies and feel entitled to request specific technologies from their health care provider. In addition, patients with CRS tend to be in their 40s and thus are well-represented in a population of working adults, as included in the MarketScan database.Citation21
An additional limitation of the study rests on the lack of error margins associated with the projection methodology. Error margins for these projections have not been established by MarketScan and so, while the results shown herein represent an approximation of total volumes and provide overall guidance in terms of growth, the relationship of these values versus actuals is unknown. However, the consistent approach used for all consecutive years from 2006 to 2011 and the link of this methodology back to MEPS, a survey used in multiple epidemiological studies in the US,Citation12 suggest that the trends identified through our approach may be credible and representative of changes in the US health care environment.
Finally, this study only considered a 6-year time period and shows natural yearly variations, but provides limited information on long-term growth. Longer time frames may be required to better estimate changes in health care utilization as procedures and reimbursement patterns become more established.
Conclusion
Following the introduction of BCD tools in 2005 and the technical ability to perform procedures in the office care setting, claims data analyses suggest that there was no growth in the incidence of sinus surgery from 2006 to 2011. Therefore, these data suggest that increased utilization did not occur during that time frame.
Disclosure
All authors are employees from Acclarent, Inc., a manufacturer of balloon dilation devices. The authors report no other conflicts of interest in this work.
References
- RosenbergNMUrmanRDGallagherSStengleinJLiuXShapiroFEEffect of an office-based surgical safety system on patient outcomesEplasty201212e5923308306
- KaranfilovBSilversSPashaRSikandAShikaniASillersMORIOS2 Study InvestigatorsOffice-based balloon sinus dilation: a prospective, multicenter study of 203 patientsInt Forum Allergy Rhinol20133540441123136057
- AlbrittonFDCasianoRRSillersMJFeasibility of in-office endoscopic sinus surgery with balloon sinus dilationAm J Rhinol Allergy201226324324822449614
- PsaltisAJSolerZMNguyenSASchlosserRJChanging trends in sinus and septal surgery, 2007 to 2009Int Forum Allergy Rhinol20122535736122447526
- BhattacharyyaNIncremental health care utilization and expenditures for chronic rhinosinusitis in the United StatesAnn Otol Rhinol Laryngol2011120742342721859049
- RosenfeldRMAndesDBhattacharyyaNClinical practice guideline: adult sinusitisOtolaryngol Head Neck Surg2007137Suppl 3S1S3117761281
- PynnonenMADavisMMExtent of sinus surgery, 2000 to 2009: A population-based studyLaryngoscope Epub1022013
- LiSPengYWeinhandlEDEstimated number of prevalent cases of metastatic bone disease in the US adult populationClin Epidemiol20124879322570568
- BrownKLundborgPLevinsonJYangHIncidence of peptic ulcer bleeding in the US pediatric populationJ Pediatr Gastroenterol Nutr201254673373622357120
- HansenLChangSHealth Research Data for the Real World: The Marketscan DatabasesAnn ArborTruven Health Analytics Inc.2012 Available from: http://truvenhealth.com/Portals/0/assets/2012_Truven_MarketScan_white_paper.pdfAccessed February 15, 2013
- International Classification of Diseases, Ninth Revision, Clinical Modification (ICD-9-CM) [webpage on the Internet]AtlantaCenters for Disease Control and Prevention2013 Available from: http://www.cdc.gov/nchs/icd/icd9cm.htmAccessed January 1, 2014
- Medical Expenditure Panel Survey (MEPS), a US-based set of large-scale surveys of families funded by the US Department of Health and Human Services through the Agency for Healthcare Research and Quality (AHRQ) [webpage on the Internet]RockvilleAgency for Healthcare Research and Quality2014 Available from: http://meps.ahrq.gov/meps.web/Accessed February 2, 2014
- United States Department of Labor – Bureau of Labor Statistics Consumer Price Index archived news releases [wepage on the Internet]WashingtonUS Bureau of Labor Statistics Available from: http://www.bls.gov/schedule/archives/cpi_nr.htmAccessed March 23, 2014
- MinYGJungHWKimHSParkSKYooKYPrevalence and risk factors of chronic sinusitis in Korea: results of a nationwide surveyEur Arch Otorhinolaryngol199625374354398891490
- VenkatramanGLikoskyDSZhouWFinlaysonSRGoodmanDCTrends in endoscopic sinus surgery rates in the Medicare populationArch Otolaryngol Head Neck Surg2010136542643020479369
- SubramanianHNSchechtmanKBHamilosDLA retrospective analysis of treatment outcomes and time to relapse after intensive medical treatment for chronic sinusitisAm J Rhinol200216630331212512904
- LalDSciannaJMStankiewiczJAEfficacy of targeted medical therapy in chronic rhinosinusitis, and predictors of failureAm J Rhinol Allergy200923439640019671254
- FokkensWJLundVJMullolJEuropean position paper on rhinosinusitis and nasal polyps 2012Rhinol Suppl201250Suppl 231298
- VenkatramanGLikoskyDSMorrisonDZhouWFinlaysonSRGoodmanDCSmall area variation in endoscopic sinus surgery rates among the Medicare populationArch Otolaryngol Head Neck Surg2011137325325721422309
- GoreMREbertCSJrZanationAMSeniorBABeyond the “central sinus”: radiographic findings in patients undergoing revision functional endoscopic sinus surgeryInt Forum Allergy Rhinol20133213914623129221
- ShashyRGMooreEJWeaverAPrevalence of the chronic sinusitis diagnosis in Olmsted County, MinnesotaArch Otolaryngol Head Neck Surg2004130332032315023840