
 ?Mathematical formulae have been encoded as MathML and are displayed in this HTML version using MathJax in order to improve their display. Uncheck the box to turn MathJax off. This feature requires Javascript. Click on a formula to zoom.
Abstract
Introduction
Alzheimer’s disease (AD) is a slowly progressing neurodegenerative brain disease with irreversible brain effects; it is the most common cause of dementia. With increasing age, the probability of suffering from AD increases. In this research, population growth of the European Union (EU) until the year 2080 and the number of patients with AD are modeled.
Aim
The aim of this research is to predict the spread of AD in the EU population until year 2080 using a computer simulation.
Methods
For the simulation of the EU population and the occurrence of AD in this population, a system dynamics modeling approach has been used. System dynamics is a useful and effective method for the investigation of complex social systems. Over the past decades, its applicability has been demonstrated in a wide variety of applications. In this research, this method has been used to investigate the growth of the EU population and predict the number of patients with AD. The model has been calibrated on the population prediction data created by Eurostat.
Results
Based on data from Eurostat, the EU population until year 2080 has been modeled. In 2013, the population of the EU was 508 million and the number of patients with AD was 7.5 million. Based on the prediction, in 2040, the population of the EU will be 524 million and the number of patients with AD will be 13.1 million. By the year 2080, the EU population will be 520 million and the number of patients with AD will be 13.7 million.
Conclusion
System dynamics modeling approach has been used for the prediction of the number of patients with AD in the EU population till the year 2080. These results can be used to determine the economic burden of the treatment of these patients. With different input data, the simulation can be used also for the different regions as well as for different noncontagious disease predictions.
Introduction
There are more than 35 million persons with dementia all over the word. The most common cause of dementia is Alzheimer’s disease (AD). The economic impact of dementia is already enormous, with total costs greater than €177 billion in Europe alone in 2008.Citation1 In 2010, the total estimated worldwide costs of dementia were ≥604 billion. About 70% of the costs occurred in Western Europe and North America.Citation2 The annual cost per person with dementia is estimated at almost €20,000. This estimation exceeds the assumed costs for patients with cancer or cardiovascular diseases. The economic impacts of AD are shown in several studies.Citation3–Citation11 Mounting an effective response to the AD epidemic will require international research collaboration and innovative approaches to sharing, integration, and analysis of diverse types of data from multiple sources.Citation12 Among the subtypes of dementia, AD is generally considered the most common, accounting for between 60% and 80% of all dementia cases.Citation13
There are various studies predicting the number of patients with AD or dementia in different regions. Some of them are based on expert opinions, and some of them are based on mathematical models. The results of these predictions using different methods are often nearly the same. A detailed literature review on the global occurrence of dementia is shown in Prince et al.Citation14 The literature containing information about the rates of dementia from 1980 to 2009 is studied here as well. The prediction of the number of patients with AD based on mathematical models for the years 2030 and 2050 can also be found in this review. This historical review as well as the prediction contains information about regions all around the world for males and females and for different age groups. Another interesting review and prediction for 2030 and 2050 is shown in Sosa-Ortiz et al.Citation15 The numbers of patients with AD are from all of the world but the patients are not divided by sex. A multistate probabilistic model for all continents has been introduced in Brookmeyer et al,Citation16 predicting the number of patients with AD until the year 2050. The patients were divided into two groups based on the progression of AD. The number of patients with AD has been predicted for each continent separately. In this study, the incidence rate for AD was the same for all continents. One of the other predictions is based on the method of Delphi consensus.Citation17 This method has been used to predict the number of patients with dementia until 2040 based on the opinions of experts without using simulation tools. A comparison of the results of these predictions can be seen in .
Table 1 Prediction of population with AD and dementia in Europe (in millions)
Our research is focused on predicting the spread of AD in the European Union (EU); thus, we use data from related studies about this region. There are also studies about other regions, such as the US,Citation13,Citation18 People’s Republic of China,Citation19 or predictions of the spread of AD in developing countries.Citation20
Alzheimer’s disease
AD is a slowly progressing neurodegenerative brain disease with irreversible brain effects;Citation21 it is the most common cause of dementiaCitation22,Citation23 and is responsible for an estimated 60% to 80% of the cases.Citation13 Dementia is characterized by a decline in memory, language, problem-solving capability, and other cognitive skills that affect a person’s ability to perform everyday activities. AD was first identified more than 100 years ago, but 70 years passed before it was recognized as the most common cause of dementia and a major killer.Citation24 Criteria for all-cause dementia and AD dementia are presented in McKhann et al.Citation25 Another studyCitation26 provides a systematic review of the global literature on the prevalence of dementia (1980–2009) and a meta-analysis estimates the prevalence and numbers of those who are affected.Citation27
AD is a neurodegenerative disease characterized by a progressive cognitive decline, leading to the need for complete care within several years after clinical diagnosis. The greatest risk factor for AD is age. The majority of people with AD are diagnosed at age 65 or older. People younger than 65 can also develop the disease, although this is much more rare. The global prevalence of dementia in the 65+ age group was estimated to be 24 million in 2001, and is predicted to double every 20 years, affecting more than 80 million people worldwide by 2040.Citation28,Citation29 Predictions of the population with AD and dementia in Europe from different sources are in . Unfortunately, the sources chose different years for the data collection and predictions; thus, for some years there are no data. Eurostat does not provide prediction data for the population with AD.
System dynamics and modeling
Models help us to understand dynamics of real-world processes by mimicking actual but simplified forces that are assumed to result in the system’s behavior. Modeling dynamic systems is essential to our understanding of real-world phenomena.Citation30 As Pegels noted,Citation31 the computer modeling process is to the mind what the telescope and the microscope are to the eye. Dynamic models try to reflect changes in real or simulated time and take into account that the model components are constantly changing as a result of previous conditions and current influences.
System dynamics was introduced by ForresterCitation32 as a method for modeling and analyzing the behavior of complex social systems, particularly in an industrial context. It has been used to examine various social, economical, and environmental systemsCitation33 in which a holistic view is important and feedback loops are critical for understanding the interrelationships. The approach has attracted attention in recent years since computer software has become more available to help managers with the modeling of systems and decision making.
System dynamics represents a set of techniques to describe, observe, and examine the behavior of dynamic systems. The process of model creation and simulation is computer aided, providing a graphical representation of a model and enabling the inspection of the system state at any time. The computer assisted modeling of a system’s dynamics provides the ability to run a simulation several times with different values of the variables, allowing further investigation of the influence of the different factors on the system.
It is important for system dynamics to be properly used as a method. StermanCitation34 writes: “System dynamics is a perspective and set of conceptual tools that enable us to understand the structure and dynamics of complex systems.” System dynamics is also a rigorous modeling method that enables us to build formal computer simulations of complex systems and use them to design more effective policies and organizations.
System dynamics and the prediction of the population with AD
Models can show how basic demographic progresses shape the size and composition of a population, revealing the underlying dynamics of growth and attrition, concentration and dispersal, and aging and renewal.Citation35 Population dynamics models serve a wide variety of uses, including the explanation of previous population fluctuations as well as projecting future population progression under hypothetical scenarios.Citation36
The following formula has been used for the population modeling. No detailed model of migration was implemented due to the lack of reliable data regarding migration, although both emigration and immigration are considered in the population size. Births and deaths are proportional to the population N(t).
where b(t) and q(t) are positive functions.
In the following, we will denote
Nx(t)… size of a cohort of the general population at age x
Mx(t)… size of a cohort of the population with AD at the age x
Tqx(t)… specific death rate at age x for the total population
qx(t)… specific death rate at age x for the population with AD
Tpx(t)… specific survival rate at age x for the general population
px(t)… specific survival rate at age x for the population with AD
rx … prevalence rate at age x.
Our theoretical model consists of two systems of recurrence relations. System 1 describes the dynamics of the general population:
(1)
The function f computes the births from the total population; each function Nx(t +1) computes the number of people in the cohort x that “survived” from the previous year when 1 year younger. This survival combines the probability of not-dying with that of migrating.
System 2 describes the population with AD:
(2)
The number Mx(t) is the number of people x-years old with AD at time t. The coefficient r65 denotes the prevalence rate of 65-year-olds and is used for finding how many patients with AD are in the population. Every other cohort of patients is computed a bit differently. We have to combine the proportion of surviving patients from the previous year with those newly-developed in the recent year.
Our estimations are based on data from Eurostat (EU28, the year 2013).Citation37 But this only includes some of the data required for our model; therefore, we have to estimate or calculate the missing data.
Estimation of parameters
Prevalence rate
In AD, the prevalence rate is estimated to be from around 1.5%–2.5% in the 65–69-year bracket, reaching almost 40% in the 90–94-year age group, and it increases exponentially.Citation38 The age-standardized prevalence for those who are older than 59 years varied in a narrow band, 5%−7% in the majority of regions of the world, with a slightly higher prevalence in Latin America (8.5%), and a significantly lower prevalence in the four sub-Saharan African regions (2%−4%). The estimation was that 35.6 million people lived with dementia worldwide in 2010, but according to an estimation, these numbers are predicted to almost double every 20 years in the future: to 65.7 million in 2030 and 115.4 million in 2050. In 2010, 58% of all people suffering from dementia lived in countries with low or middle incomes, with this proportion anticipated to rise to 63% in 2030 and 71% in 2050.Citation14
An exponential function for the prevalence rate depending on age has been created based on the data from:Citation38
We also need to find an expression for the proportion kx(t) of new patients with AD in each year-cohort. For the prevalence rate, one has
(3) and for the cohort x of patients with AD one has
(4)
The whole cohort is composed from the patients who survived from the previous year (and who were 1 year younger); we denote this part by
and from new patients who are diagnosed this year. From EquationEquation 3
(3) , we get
If we put EquationEquations 4(4) and Equation5
(5) together, we can write
(5) from which we get
(6)
Death rates
Firstly, we estimate the evolution of the probability of the death of members of the individual age cohorts (x =0, …, n) based on the available data from the Eurostat database from 2003 to 2012. We used the linear regression model with unknown parameters ax and bx,
A simple linear function would not be suitable because after a couple of years the death rate would become negative. We used a linear rational function for modeling the deceleration of the death rate with a zero limit with increasing time. The parameters ax and bx are calculated coefficients and t is the corresponding time of simulation.
Another challenge is to find the specific death rate (qx) for patients with AD. We know the corresponding life expectancy (the function ex) of patients with AD. It is estimated fromCitation38 by
But we need the values of qx, the death rate according to the age x, for our model. Let us have a look at some basic formulas from demography:
where lx stands for the number of people who survive to age x, dx stands for the number of deaths during the year, Lx gives the number of person-years lived between ages x, and x+1, ax is the coefficient of the distribution of deaths during the year, usually for a newborn cohort a0 =0.08 is used, and for the rest ax =0.5, and Tx gives the total number of person-years lived beyond age x, by all members of the cohort.
We write n for the last year (the year that none survive). Then
from which we get
For the previous age cohort, we have
If we write
we get
and finally we can evaluate pn−1:
(7)
For now on, we will write
For the next step, we have
Then,
(8)
Similarly,
(9)
Now, one can see the pattern from formulas 7–9 and we can formalize the general formula for the birth rate at the age n−x:
(10) for x =1, …, n. And from this survival rate, we can easily compute the required death rate to be qx =1− px.
Stella model
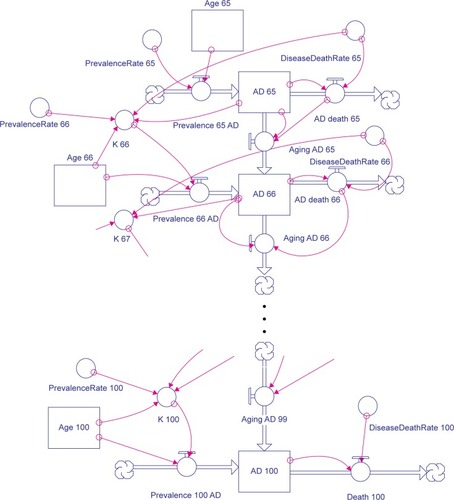
A population model based on the formulas from “Estimation of parameters” section was created using stock and flow diagrams ( and ). The input to the model is the current size of the EU population based on the Eurostat data.
Figure 1 The model of population growth.
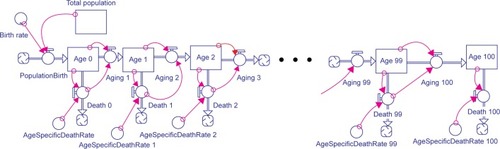
Figure 2 The model of the population with Alzheimer’s disease (AD) growth.
We used the simulation software STELLA to organize the formulas and implement them into formal models that can be run on a computer. STELLA was chosen as the software for this research because it is a powerful tool for modeling complex systems and their development in time. Because of the complexity of dynamic systems, the use of formal models and numbers is essential: they help us dispel the complexity of many real-world processes and force us to be specific. The model in STELLA does not need to be trained or run several times. The results of the model are not affected by randomness.
The population model and the model for the population with AD consist of basic elements of the stock and flow diagram, such as stocks, flows, converters, and action connectors.Citation33
As we can see in and , we use all the elements. The elements named “AGE X” are stocks, which means the place where the people in a given age are waiting to move to the next state (age +1). The only way to enter this stock is through the inflow named “PopulationBirth.” This inflow calculates the number of incoming (birth) people from the sum of the current total population and birth rate. The outflows from the states and from the model are through the outflows named “Death X,” which is calculated from the “AgeSpecificDeathRate.”
The structure of the model of the population with AD is shown in . The main variables in this model are the numbers of patients with AD at each age. The inflow to the first stock of patients at age 65 is given by the relationship between “PrevalenceRate” and the size of cohort of people of age 65. Other inflows are given by the relationships of the coefficient “k” calculated from EquationEquation 6(6) and the size of the corresponding cohort of people at the given age. There are two outflows from the stocks. The first one is death, as affected by the “DiseaseDeathRate.” The other outflow is the aging of patients to the next age-cohort’s stock. The last stock of patients at age 100 has only one outflow, “Death,” because it is the last stock in this model.
Results and discussion
The results of the model run are presented in the following text and figures. There was only one run of the model because there is no randomness in the system dynamics model of the population growth; therefore, the results are always the same. In the result of the simulation, the prediction of the total population is similar to the prediction from Eurostat ( and ). Moreover, our model provides information about the number of people with AD and also the characteristics of the population with AD.
Figure 3 The prediction of population.
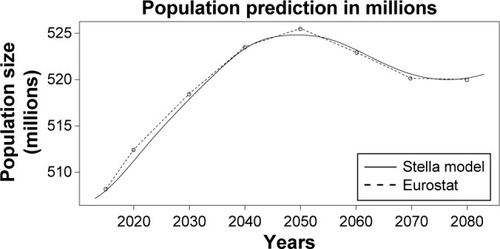
Table 2 Population prediction (in millions)
Most of other predictions are until the year 2050 (). The number of patients with AD in those predictions rises. We have simulated 70 years to the future and it can be seen that number of patients with AD starts to slowly decrease from the year 2060 because of changes in EU population size and its structure. Our population structure has been verified by data from Eurostat, which provides population prediction until the year 2080. Simulating more than 70 years would make our model less accurate because there could be major changes in population structure. The weaknesses of the model is that population structure can change rapidly and may not correspond with Eurostat prediction. There can be also major improvements in AD treatment which can slow disease progression.
Our model is easily alterable and new data about population or disease characteristic can be simply implemented. That enables us to test various scenarios and also create different noncontagious disease predictions.
The data from Eurostat are indicated by the dotted line for better comparison with our results in . Rapid growth can be seen at the beginning of the simulation; it slows down after ~30 years, followed by a slow decrease. We can suspect some oscillations in the future behavior of the population. The maximal value iŝ525 million in 2050.
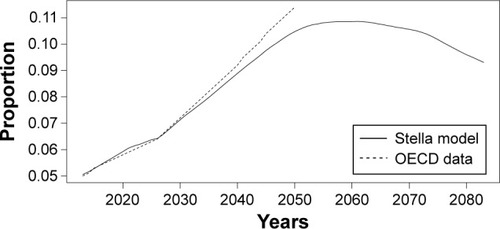
If we look only at the elderly population (people over 80 years old, ), we can see that the model also fits the prediction from the Organisation for Economic Co-operation and Development (OECD),Citation39 especially at the beginning of the simulation. The predictions diverge with longer simulation time. Our prediction is quite optimistic compared to the OECD in the following years: the proportion of the elderly population will decrease, and therefore the population will get younger.
Figure 4 The proportion of population over 80 years old.
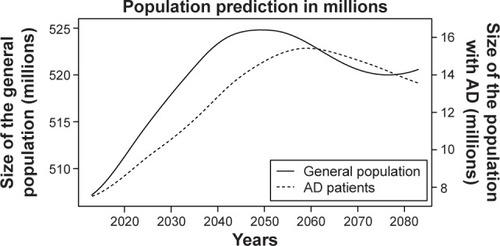
Moreover, we obtained a prediction for the population of patients with AD (). It can be seen that the population of patients with AD will increase at first, but at later times will decrease. It looks like the population growth of patients with AD follows the growth of the general population with a delay. The right Y-axis shows the numbers of the AD population, and the left Y-axis shows the numbers of the general population. The maximal value of the population of patients with AD is ~15 million around the year 2060.
Figure 5 Combined graph of predictions.
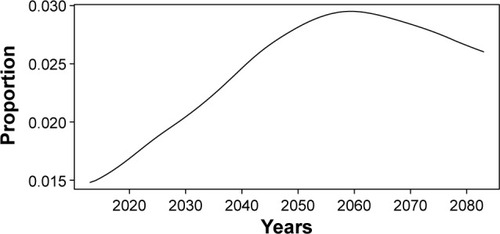
shows the proportion of patients with AD. This proportion will increase from 1.5% to almost 3% in 50 years and then it will decrease to 2.5% after another 20 years. The behavior of this proportion is similar to the behavior of the population of patients with AD.
Figure 6 The proportion of patients with Alzheimer’s disease to the general population.
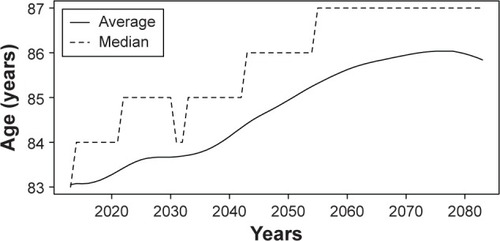
After a closer look at the chosen characteristics, such as median or average, a population that has been in the process of aging starts to become younger after a couple of decades (). This will not apply to patients with AD. They will continue getting older over the years ().
Figure 7 Characteristics of the general population.
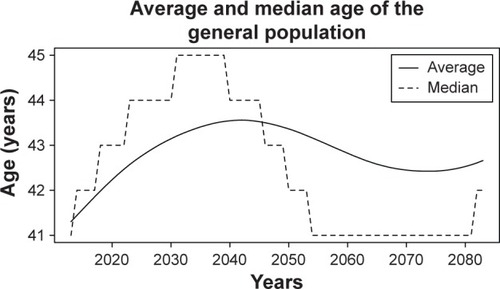
Figure 8 Average and median age of patients with AD.
Conclusion
A system dynamics model simulating the population growth of the EU and the number of patients with AD has been introduced.
Based on the characteristics of AD, it was possible to simulate the spread of AD till the year 2080 and explore different population characteristics. The modeling results of the population growth equal the predictions of Eurostat.Citation37 We were able to create a model of population growth similar to the Eurostat prediction where it is, moreover, possible to observe the number of people with AD and different population characteristics of those patients. The data from Eurostat do not provide information about the number of people with AD at all. Also, compared to other models and predictions, our model contains information about the population structure for all years and age cohorts.
The population of the EU was 508 million and the number of patients with AD was 7.5 million in the year 2013. Based on Eurostat and our predictions, in the year 2040 the population of the EU will be 524 million. Based on our predictions, the number of patients with AD in 2040 will be 13.1 million; the EU population in 2080 will be 520 million with 13.7 million patients with AD. A system dynamics modeling approach has been used for the prediction of the number of patients with AD in the EU population till the year 2080. These results can be used to determine the economic burden of the treatment of these patients. With different input data, such a simulation can also be used for different regions as well as for different noncontagious disease predictions.
Acknowledgments
The support of Grant Agency of Excellence UHK FIM is gratefully acknowledged.
Disclosure
The authors report no conflicts of interest in this work.
References
- WimoAJnssonLGustavssonAThe economic impact of dementia in Europe in 2008 – cost estimates from the Eurocode ProjectInt J Geriatr Psychiatry201126882583221744385
- WimoAJonssonLBondJPrinceMWinbladBThe worldwide economic impact of dementia 2010Alzheimers Dement20139111123305821
- HandelsRLWolfsCAAaltenPJooreMAVerheyFRSeverensJLDiagnosing Alzheimer’s disease: A systematic review of economic evaluationsAlzheimers Dement201410222523723727080
- KlimovaBMaresovaPValisMHortJKucaKAlzheimer’s disease and language impairments: Social intervention and medical treatmentClin Interv Aging20151014011407 Available from: http://europepmc.org/articles/PMC4555976Accessed January 10, 201626346123
- MaresovaPKlimovaBSupporting technologies for old people with dementia: A reviewIFAC-PapersOnLine2015484129134
- MaresovaPMohelskaHKucaKEconomics aspects of ageing populationProc Econ Finan201523534538
- MaresovaPMohelskaHDolejsJKucaKSocio-economic aspects of Alzheimer’s diseaseCurr Alzheimer Res201412990391126510983
- MaresovaPVoseckovaATruhlarovaZKucaKEconomic and social aspects of informal care for Alzheimer’s disease patients in the Czech Republic25th IBIMA ConferenceMay 7–8, 2015Amsterdam, the Netherlands10681074
- MohelskaHMaresovaPEconomic and managerial aspects of Alzheimer’s disease in the Czech RepublicProc Econ Finan201523521524
- MohelskaHMaresovaPValisMKucaKAlzheimer’s disease and its treatment costs: case study in the Czech RepublicNeuropsychiatr Dis Treat2015112349235426396519
- TomaskovaHKuhnovaJKucaKEconomic model of Alzheimer’s diseaseProceedings of the 25th International Business Information Management Association Conference – Innovation Vision 2020: From Regional Development Sustainability to Global Economic GrowthMay 7–8, 2015IBIMAAmsterdam, the Netherlands201531203127
- CarrilloMLeveraging global resources to end the Alzheimer’s pandemicAlzheimers Dement20139436336523809362
- Alzheimer’s AssociationAlzheimer’s disease facts and figuresAlzheimers Dement201511333238425984581
- PrinceMBryceRAlbaneseEWimoARibeiroWFerriCThe global prevalence of dementia: A systematic review and metaanalysisAlzheimers Dement201391637523305823
- Sosa-OrtizALAcosta-CastilloIPrinceMJEpidemiology of dementias and Alzheimer’s diseaseArch Med Res201243860060823159715
- BrookmeyerRJohnsonEZiegler-GrahamKArrighiHMForecasting the global burden of Alzheimer’s diseaseAlzheimers Dement20073318619119595937
- FerriCPPrinceMBrayneCGlobal prevalence of dementia: A Delphi consensus studyLancet200636695032112211716360788
- BrookmeyerRGraySKawasCProjections of Alzheimer’s disease in the United States and the public health impact of delaying disease onsetAm J Public Health1998889133713429736873
- RodriguezJJLFerriCPAcostaDPrevalence of dementia in Latin America, India, and China: A population-based cross-sectional surveyLancet2008372963746447418657855
- PrinceMAcostaDChiuHScazufcaMVargheseMthe 10/66 Dementia Research GroupDementia diagnosis in developing countries: A cross-cultural validation studyLancet2003361936190991712648969
- HampelHPrvulovicDTeipelSThe future of Alzheimer’s disease: The next 10 yearsProg Neurobiol201195471872822137045
- BarkerWLuisCKashubaARelative frequencies of Alzheimer disease, Lewy body, vascular and frontotemporal dementia, and hippocampal sclerosis in the state of Florida brain bankAlzheimer Dis Assoc Disord200216420321212468894
- WilsonRSegawaEBoylePAnagnosSHizelLBennettDThe natural history of cognitive decline in Alzheimer’s diseasePsychol Aging20122741008101722946521
- KatzmanRThe prevalence and malignancy of Alzheimer disease. A major killerArch Neurol19763342172181259639
- McKhannGKnopmanDChertkowHThe diagnosis of dementia due to Alzheimer’s disease: Recommendations from the National Institute on Aging – Alzheimer’s association workgroups on diagnostic guidelines for Alzheimer’s diseaseAlzheimers Dement20117326326921514250
- PrinceMBryceRAlbaneseEWimoARibeiroWFerriCThe global prevalence of dementia: A systematic review and metaanalysisAlzheimers Dement201391637523305823
- ChenJHLinKPChenYCRisk factors for dementiaJ Formos Med Assoc20091081075476419864195
- FerriCPPrinceMBrayneCGlobal prevalence of dementia: A Delphi consensus studyLancet200636695032112211716360788
- ReitzCBrayneCMayeuxREpidemiology of Alzheimer diseaseNat Rev Neurol20117313715221304480
- HannonBRuthMDynamic Modeling of Diseases and PestsNew YorkSpringer-Verlag2008
- PagelsHeinz RThe dreams of reason: The computer and the rise of the sciences of complexityNew YorkSimon and Schuster1988
- ForresterJWIndustrial DynamicsCambridge, MAMIT Press1961
- WolstenholmeEFSystem Enquiry – A System Dynamics ApproachChichesterJohn Wiley & Sons1990
- StermanJBusiness Dynamics – Systems Thinking and Modeling for a Complex WorldBoston, MAIrwin/McGraw-Hill2000
- SchoenRDynamic Population ModelsDordrecht, the NetherlandsSpringer-Verlag2006
- NewmanKBBucklandSTMorganBJTModelling Population DynamicsNew YorkSpringer2014
- EUROSTAT: 2015 Available from: http://ec.europa.eu/eurostat/statistics-explained/index.php/People_in_the_EU_%E2%80%93_population_projectionsAccessed November 7, 2015
- ArizagaRLEpidemiology of dementiaMangoneCAAllegriRFArizagaRLOllariJADementia: a multidisciplinary approach2nd edBuenos AiresEd. Polemos2005717
- ColomboFLlena-NozalAMercierJTjadensFHelp wanted? Providing and Paying Long-term CareParisOrganization for Economic Cooperation and Development2011